Label-free brain injury biomarker detection based on highly sensitive large area organic thin film transistor with hybrid coupling layer†
Weiguo
Huang
a,
Kalpana
Besar
a,
Rachel
LeCover
a,
Pratima
Dulloor
c,
Jasmine
Sinha
a,
Josue F.
Martínez Hardigree
a,
Christian
Pick
d,
Julia
Swavola
d,
Allen D.
Everett
c,
Joelle
Frechette
d,
Michael
Bevan
d and
Howard E.
Katz
*ab
aDepartment of Materials Science and Engineering, The Johns Hopkins University, 206 Maryland Hall, 3400 North Charles Street, Baltimore, Maryland 21218, US. E-mail: hekatz@jhu.edu
bDepartment of Chemistry, The Johns Hopkins University, 3400 North Charles Street, Baltimore, Maryland 21218, US
cDepartment of Pediatrics, Division of Pediatric Cardiology, The Johns Hopkins University, 1800 Orleans Street, Baltimore, Maryland 21287, US
dDepartment of Chemical and Biomolecular Engineering, The Johns Hopkins University, 3400 North Charles Street, Baltimore, Maryland 21218, US
First published on 25th October 2013
Abstract
We describe a sensitive, large-area thin film transistor (TFT) sensor platform for real time detection of low-concentration protein analytes in solution. The sensing area is 7 mm by 7 mm. p-channel (pentacene) and n-channel (a naphthalenetetracarboxylic diimide, NTCDI) organic molecules were each used as semiconductors in conjunction with a newly designed receptor–antibody-functionalized top dielectric layer. This layer, incorporating both a fluorinated polymer and vapor-deposited hydrocarbon, provided maximum capacitive coupling and minimal interference from the aqueous analyte solution, and allowed convenient solvent processing of the antibody coupling layer. Additionally, a new antibody immobilization method was introduced, which led to high immobilization yield and surface coverage. Using glial fibrillary acidic protein (GFAP) as a model protein analyte, this sensor platform demonstrated significant selectivity and recognition of target protein even in much more concentrated non-target protein backgrounds. The dose–response relationship yielded a Langmuir isotherm from which a reasonable affinity constant was calculated for the protein and antibody. A zeta potential measurement provided further evidence of the surface potential change being detected by the TFTs. We explicitly verified for the first time that the response is in fact predominantly from perturbations of TFT channel current. To the best of our knowledge, this is the most sensitive organic TFT (OTFT) protein sensor yet reported, and also the first demonstration of the expected opposite current responses by p- and n-channel semiconductors to the same protein.
Introduction
Organic thin film transistors (OTFTs) have gained considerable attention as a sensor platform in the last two decades.1–15 They have been shown to detect a wide range of analytes, including gases (such as NH3, NO2, O3, and ethylene) and chemicals associated with explosives (such as DNT and TNT).16–19 OTFTs have evolved as low cost, low power consumption, biocompatible, and real-time biomolecule sensor platforms with the ability to detect a variety of biomolecules including DNA, glucose, protein and telomerase.20–37 Analytes can be identified either through the immobilization of a specific receptor or by introducing a specific detection layer on the OTFT surfaces. These detectors are still at an early stage, limited by low sensitivity (the limit of detection is around several micrograms per milliliter), while higher sensitivities were instead achieved by using large surface-to-volume ratio nanostructured or low dimensional non-molecular materials such as silicon nanowires,24,35,39 SnO2 nanobelts,38 single-crystalline silicon,25 carbon nanotubes,40–44 polypyrrole nanotubes,44 and graphene.28 The limitations on these approaches can include their cost and relatively arduous fabrication procedures. Also, because of the small fraction of the active sensing area in nanowire or nanobelt TFT devices, nonspecific binding on the device can reduce detection speed and sensitivity.38 For carbon nanotubes and graphene, attention to this point is needed to differentiate protein covalent attachment from physical adsorption, as carbon nanotubes have a natural affinity for diverse proteins through hydrophobic and electrostatic interactions.45,46 Also, the small active area in nanostructure sensors can lead to transport-limited response rates.Therefore, it remains desirable to develop biosensors based on alternative materials, such as organic or other macroscopic thin films, where these limitations are lessened. Despite significant progress,20,27,30,31 many reported OTFTs lacked sufficient sensitivity to be practically useful for detection, and the specificity and target protein recognition ability of these bioelectronic sensors were not investigated in detail against preferred controls. Furthermore, studies to date were limited to p-channel organic molecules (such as pentacene, DDFTTF, α-sexithiophene, and P3HT)20,21,27,30,31 as sensor semiconductors. n-Channel organic molecules were excluded, likely due to their instability and expected bias stress effects from continuously applying voltage during sensing. Although one report used a perylenetetracarboxylic diimide (PTCDI) as semiconductor for protein detection, the signal was from non-specific adsorption between protein and PTCDI; no antibody was introduced as a specific target protein binding site, and selectivity was not demonstrated.47
In this work, we describe the development of a more sensitive OTFT sensor platform for detecting low-concentration protein analytes in solution with a sensing area of 7 mm by 7 mm. By using a larger area device, specific binding occurring anywhere in this area contributes to the response. Furthermore, a new antibody immobilization method is introduced, giving high immobilization yield and maximal surface coverage, resulting in good sensitivity. Additionally, we investigate the origin of analyte solution responses by conducting a number of control experiments, including some without semiconductor at all. Such control experiments are vital for a thorough understanding of the OTFT sensing platform, and have not been included in previous literature.20–27,30,31,34,37,46 Finally, zeta potential measurement is included as an independent observation of the protein binding-induced potential change on an antibody-functionalized surface.
Because of the present urgency to investigate brain injuries in many clinical settings, we chose glial fibrillary acidic protein (GFAP) as a model analyte. GFAP is an astrocyte cytoskeletal protein identified as a circulating acute brain injury biomarker in children with sickle cell disease (SCD),48,49 birth asphyxia,50–53 and extracorporeal membrane oxygenation support,54 and in adults with traumatic brain injury and stroke.55–59 A unique and large group of patients at risk of brain injury during care are those requiring cardiopulmonary bypass for cardiac surgery and those having invasive vascular procedures. At least 30% of neonates after surgical repair of congenital heart disease will have MRI indicating new injury, predominately stroke.60,61 Similarly, adults after percutaneous intravascular procedures have an average 13–24% incidence of new MRI-evidenced injury resulting in a potential yearly rate of 321![[thin space (1/6-em)]](https://www.rsc.org/images/entities/char_2009.gif) 000–628
000–628![[thin space (1/6-em)]](https://www.rsc.org/images/entities/char_2009.gif) 000 new cases.60,61 Although the clinical circumstances and high-risk patient groups are well known and brain-specific biomarkers are being tested clinically, development of an electronic biosensor platform for acute brain injury biomarkers would fill an important clinical void with the ability to detect acute injury biomarkers such as GFAP in real time and dramatically increasing their utility. The state of the art and traditional immunoassay methods include ELISA (enzyme-linked immunosorbent assay),62–64 SPR (surface plasmon resonance) and microcantilevers,62–64 all of which provide high sensitivity. However, they are expensive, labor intensive, not point of care, impose excessive time delays, lack portability, and/or are not label-free. The isoelectric points (PI points) of anti-GFAP and GFAP are 5.7 and 5.4, respectively. The GFAP amino acid sequence is shown in the Experimental section; both GFAP and the antibody are negatively charged at pH 7.4. (The program for calculating protein charge is provided in ESI;† the program language is Python.)
000 new cases.60,61 Although the clinical circumstances and high-risk patient groups are well known and brain-specific biomarkers are being tested clinically, development of an electronic biosensor platform for acute brain injury biomarkers would fill an important clinical void with the ability to detect acute injury biomarkers such as GFAP in real time and dramatically increasing their utility. The state of the art and traditional immunoassay methods include ELISA (enzyme-linked immunosorbent assay),62–64 SPR (surface plasmon resonance) and microcantilevers,62–64 all of which provide high sensitivity. However, they are expensive, labor intensive, not point of care, impose excessive time delays, lack portability, and/or are not label-free. The isoelectric points (PI points) of anti-GFAP and GFAP are 5.7 and 5.4, respectively. The GFAP amino acid sequence is shown in the Experimental section; both GFAP and the antibody are negatively charged at pH 7.4. (The program for calculating protein charge is provided in ESI;† the program language is Python.)
We employed p-channel (pentacene) and n-channel (8-3 NTCDI) organic molecules as semiconductors. The incorporation of both p- and n-channel transistors in a single sensor chip would enable discrimination of possible electrical cross-talk and/or false-positive signals by correlating the response versus time from the two types of device elements,27 and could also be utilized to make a synergistic inverter sensor. This sensor platform demonstrated excellent selectivity and recognition of GFAP even in much more concentrated non-target protein backgrounds. The dose–response relationship yielded a Langmuir isotherm from which a reasonable affinity constant was calculated for the protein and antibody. To the best of our knowledge, this is the most sensitive OTFT protein sensor yet reported, and also the first demonstration of the expected opposite current responses by p- and n-channel semiconductors to the same protein.
Results and discussion
Device architecture and top dielectric
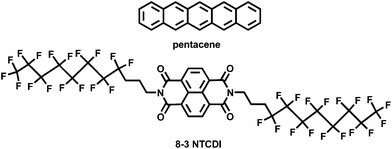
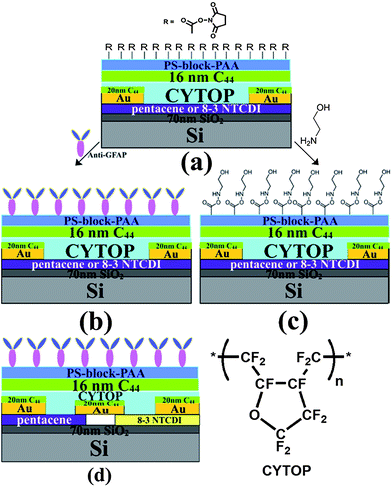
Pentacene and 8-3 NTCDI (Scheme 1) were selected as the semiconductors due to their high mobility and stability, especially 8-3 NTCDI, which exhibits excellent stability and negligible bias stress in air compared to many other n-channel materials,65–67 making it an ideal candidate for devices operating under water. The device structures are shown in Scheme 2; the interdigitated electrode mask for depositing Au source and drain electrodes is shown in Fig. S1,† of which the active area is 7 mm by 7 mm. CYTOP was chosen as a passivation layer as well as top dielectric layer due to its excellent electrical and coating properties. It is easy to form a uniform thin CYTOP layer by simple spin-coating and annealing at 50 °C for 15 minutes under nitrogen atmosphere. The electrical performances of the devices were not affected by spin-coating of the CYTOP layer, as expected for fluoropolymers.68 16–20 nm tetratetracontane (C44H90) was then vapor-deposited on the CYTOP.The devices show excellent linear and saturation regime characteristics for the deposition conditions used: for pentacene, a hole mobility of 0.07 ± 0.01 cm2 V−1 s−1, an on/off ratio of 102 at Vg of −3 V and threshold voltage of −0.3 ± 0.1 V. Typical OTFT transfer and output curves are shown in Fig. S2.† OTFTs were evaluated under Vds = −3 V and Vg = 0 to −3 V for pentacene and Vds = 3 V and Vg = 0 to 3 V for 8-3 NTCDI; the drain current was recorded every 30 seconds. Experiments involving aqueous solutions (except for pH dependence studies) were conducted using 0.05×-diluted phosphate buffer solution (0.05 PBS) at room temperature. In 0.05 PBS, both “on” and “off” current slightly increased, indicating that the passive layer provides excellent protection for the semiconductor. For 8-3 NTCDI, an electron mobility of 0.03 ± 0.01 cm2 V−1 s−1, an on/off ratio of 102 at Vg of 3 V and threshold voltage of 0 ± 0.1 V were obtained. In 0.05 PBS, “on” current decreased and “off” current increased (Fig. S2†), but both stabilized rapidly. The different current change trends of pentacene and 8-3 NTCDI under 0.05 PBS would be consistent with opposite field effects of the buffer on p- and n-semiconductors. In 0.05 PBS, both on/off ratios decrease relative to operation in air.
We found multiple advantages to this composite top dielectric. First, tetratetracontane can fill residual pinholes in the CYTOP layer, reducing penetration of buffer solution into semiconductor layers and minimizing Faradaic leakage current.37 The rate of relative baseline current drift apparent from the control experiments (to be discussed later with Fig. 4) is an order of magnitude less than what had been previously reported in a related example.20 The performance is also better than that of dielectric films containing only CYTOP. In fact, C44H90 itself forms an outstanding barrier against water if it is thick enough. Fig. 1 (pentacene transistor as an example) illustrates the excellent water stability conferred by 100 nm of sublimed C44H90 over 25 minutes. However, the use of C44H90 as the only passive layer makes it difficult to spin coat the next overlying layer because C44H90 will be dissolved or delaminated during spin coating of activated PS-PAA, and cause damage to the layers (gold and semiconductors) under the C44H90. Fig. 1 also shows the poorer stability conferred by CYTOP alone, which had the additional disadvantage of nonwettability of nonfluorous organic solutions, as discussed below. Though nominally thicker, the CYTOP layer was apparently much more porous as well.
The combined top layer (CYTOP + C44H90) showed only slight drain current drift and excellent water stability (Fig. 1) in the accumulation regime. Using atomic force microscopy (AFM), we could relate this to film morphology. As shown in Fig. S3,† the surface of the plain CYTOP film exhibits heterogeneous morphology, with a randomly arranged second phase embedded in the continuous amorphous film, which may lead to pinholes at the phase boundaries. After depositing a thin layer of C44H90, those randomly located features were filled and the surface morphology appears denser, leading to improved water stability. This composite layer is compatible with both the semiconductor layers below and the antibody coupling layer above, with no additional pretreatments needed before spin-coating steps. It is impossible to spin-coat NHS-treated PS-block-PAA on the highly fluorinated CYTOP layer alone. On the other hand, CYTOP prevents the dissolution of semiconductor and the delamination of electrodes during spin-coating of subsequent layers because of its solution orthogonality,68 while the spin-coating of a hydrocarbon directly on Au/pentacene caused this kind of degradation, and tetratetracontane alone did not prevent it.
We investigated the capacitance and coupling effect of the combined top layer.37 Fig. S4† shows the relationship of the combined top layer capacitance with frequency; the capacitance value is stable over a wide frequency range, the value only starting to decrease when the frequency is above 105 Hz. There is a tradeoff between the capacitance and stability/leakage current in buffer solution, necessitating the optimization of the top layer thickness. The coupling effect of the combined top layer was also investigated through the responses of these transistors as a function of electrolyte pH;37 the results are shown in Fig. S5.† The direction of the Vth change for the NTCDI OTFT is opposite that of the pentacene OTFT, as would be expected for the two polarities. For both pH 12 and pH 2 solution, the ionic strengths are the same, so the transistor response may be caused by the change of surface potential due to different ion distributions at different pH values. Finally, we checked the hysteresis behavior of both p- and n-transistors; the results are shown in Fig. S6.† The two transistor types show negligible hysteresis behavior, which indicated that both p- and n-transistors can stably operate in buffer solution protected by the combined top layer.37
Antibody chemistry
Anti-GFAP was immobilized on the NHS-treated PS-block-PAA layer by EDC- and NHS-based bio-conjugation chemistry.20,21 We introduce a different way to activate carboxylic acid groups on the device surface for subsequent antibody immobilizations. In previous literature, NHS activated surfaces were usually generated by in situ surface reaction of EDC–NHS with carboxylic acid in buffer solution. This method usually leads to low activation yield and low antibody immobilization yield.69 Here, we first activated the carboxylic acid on PS-PAA copolymer (molar ratio of styrene![[thin space (1/6-em)]](https://www.rsc.org/images/entities/char_2009.gif) :
:![[thin space (1/6-em)]](https://www.rsc.org/images/entities/char_2009.gif) acrylic acid is about 2
acrylic acid is about 2![[thin space (1/6-em)]](https://www.rsc.org/images/entities/char_2009.gif) :
:![[thin space (1/6-em)]](https://www.rsc.org/images/entities/char_2009.gif) 1) by EDC–NHS in CH2Cl2–DMF mixed solvent, and then spin-coated activated PS-PAA on the device surface. The 1H NMR results show that 100% yield of activating group attachment was achieved. As shown in Fig. S7,† before treatment with EDC–NHS, the carboxylic acid 1H NMR peak appears at 12.22 ppm, and after EDC–NHS treatment, this peak completely disappears, and new a proton peak with an integral value of about 4 appears at 2.8 ppm, indicating that the carboxylic acid groups were completely activated. As a result, this 100% NHS activated surface leads to high antibody immobilization yield and surface coverage. The successful immobilization of anti-GFAP on the device surface was confirmed by fluorescence experiments (Scheme S1†) using methods reported in previous literature.20,38
1) by EDC–NHS in CH2Cl2–DMF mixed solvent, and then spin-coated activated PS-PAA on the device surface. The 1H NMR results show that 100% yield of activating group attachment was achieved. As shown in Fig. S7,† before treatment with EDC–NHS, the carboxylic acid 1H NMR peak appears at 12.22 ppm, and after EDC–NHS treatment, this peak completely disappears, and new a proton peak with an integral value of about 4 appears at 2.8 ppm, indicating that the carboxylic acid groups were completely activated. As a result, this 100% NHS activated surface leads to high antibody immobilization yield and surface coverage. The successful immobilization of anti-GFAP on the device surface was confirmed by fluorescence experiments (Scheme S1†) using methods reported in previous literature.20,38
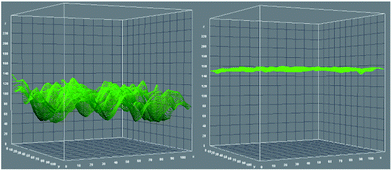
Furthermore, we calculated anti-GFAP surface coverage by comparing the fluorescent emission intensity of fluorescein isothiocyanate (FITC)-labeled anti-GFAP on the device surface with a known concentration of FITC coated on the device surface, an evaluation rarely performed before. Herein, 0.1 mL (10 pmol) FITC ethanol solution (0.1 μM) was dropped on a 1 cm2 NHS activated PS-PAA coated device surface. After the ethanol completely evaporated, the intensity of fluorescence emission was measured. As shown in Fig. 2, the Z axis gives the fluorescence emission intensity value. The average value was about 80 (arbitrary units) while a pure PS-PAA layer does not give any fluorescence emission signal. Then, FITC-labeled anti-GFAP (6 FITC per anti-GFAP in average) was dropped on the NHS-activated PS-PAA coated device surface. After reaction with the surface for 6 hours, the device surface was rinsed with DI water at least 6 times to remove any unbound anti-GFAP, and dried under gentle N2 flow. The fluorescent emission intensity was measured. The average intensity value was about 150 (arbitrary units). Furthermore, the fluorescence emission intensity was very uniform in any direction, indicated that antibody was uniformly immobilized on the device surface. At very low fluorescent dye concentration, the fluorescence emission intensity is proportional to its concentration, therefore, by comparing the fluorescence emission intensity of both surfaces, we determined that FITC molar concentration of FITC labeled anti-GFAP surface is about 20 pmol cm−2, thus the surface coverage of anti-GFAP is about 3.3 pmol cm−2, which is in good agreement with what would be theoretically expected for maximal surface coverage (2 ± 0.5 pmol cm−2).69
Responses to proteins
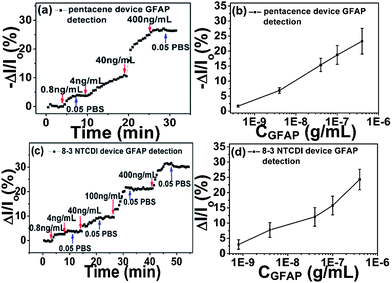
The sensor performances of anti-GFAP modified OTFT devices were first determined by measuring drain current changes on exposure to varying concentrations of GFAP solution, as shown in Fig. 3. There are several key features of these data. First, anti-GFAP-modified pentacene and 8-3 NTCDI devices exhibit opposite current change directions on exposure to GFAP solutions, consistent with the expectation that attached negatively charged species induce lower conductance in p-channel transistors and higher conductance in n-channel transistors. One possible mechanism is that negatively charged target proteins pull charge carriers (holes) away from the channel region for a p type transistor, and push charge carriers (electrons) toward the channel region for an n type transistor, as suggested in previous literature.20,30 Another explanation, consistent with our data, is that the negatively charged protein drives positive counterions closer to the coupling layer interface, creating a dipole projecting negative charge toward the medium and positive charge toward the OTFT.Second, the responses show substantial signal dependence on protein concentration in a wide range (from 400 ng mL−1 down to 0.8 ng mL−1); after reaching a stable current level at a certain concentration, further response is obtained by introducing a higher-GFAP-concentration solution. The magnitude and percentage of current changes at the same target protein concentration are higher than previous reported OTFT protein sensors,20,21,30 which indicates that this sensor platform shows higher sensitivity.
Third, the current changes are mainly due to the threshold voltage shifts, and representative threshold voltage shifts are shown in Fig. S8.† The drain current changes of pentacene and 8-3 NTCDI devices at different charge densities of bound GFAP on the OTFT surface are shown in Fig. S9;† charge density values were calculated from the threshold voltage changes and the top layer capacitance. As we can see, the drain current changes follow the trend of charge density change, which as we showed in Fig. 3, scales with the logarithm of GFAP concentration over 3 orders of magnitude. While the charge density change may also be proportional to the number of bound protein molecules, there may not necessarily be a numerical correspondence between charge density change and the nominal net charge of the protein molecules, because of internal compensation of protein charges by the surrounding medium.70
Fourth, the drain current changes are only slightly reversible on rinsing the device surface with pure 0.05 PBS, due to the strong antibody–antigen binding between anti-GFAP and GFAP,38 making GFAP very difficult to rinse off from device surfaces. Reversibility was greater at higher ionic strength. The recovered signal may indicate the part of the response generated by nonspecific adsorption and metastable binding between anti-GFAP and GFAP. From Fig. 3(b) and (d), by fitting the 0.05 PBS data with the Langmuir model (see ESI†),20 we can estimate an affinity constant for anti-GFAP and GFAP in this medium of (1.2 ± 0.5) × 1010 (M−1), reasonable for a protein and its antibody. According to the definition of limit of detection (LOD = Rblank + 3S, where Rblank is the blank response and S is the standard deviation of the response),16,74,75 we obtained an estimated value of 1 ng mL−1 (about 20 pM) for the LOD, the highest sensitivity ever reported for OTFT protein sensing to date.
We further investigated the selectivity using bovine serum albumin (BSA) as a representative non-target protein, for three reasons. First, BSA shares many similarities with human serum albumin (HSA) in bio-function and bio-chemical properties, making it a good model for a clinical interferent. Second, BSA is also negatively charged at pH 7.4, the charge number being −13 (calculated by the program provided in the ESI†), the same as the charge number of GFAP at pH 7.4. Third, the molecular weight difference between BSA and GFAP is small. Note that BSA was used as the analyte in a previous study.20 As shown in Fig. 4, for both anti-GFAP modified pentacene and 8-3 NTCDI devices, BSA buffer solution only generates random and inconsequential signals (comparable to device noise) when the concentration of BSA is lower than 0.1 mg mL−1, far higher than the GFAP concentrations. Some reversible signal can be detected in 0.05 PBS by further increasing BSA concentration, though the signals generated by high concentration BSA can be completely recovered while GFAP signals only show slight recovery. This is the key difference between the GFAP signal and BSA signal in this medium; because the BSA signal is only generated by weak non-specific adsorption, it can be fully recovered by rinsing device surfaces with pure 0.05 PBS, whereas the GFAP signal is generated by strong specific binding between anti-GFAP and GFAP, which makes recovery difficult. Moreover, the data in Fig. 4 also indicate that anti-GFAP attached on the device surface not only provides binding sites for GFAP, but also prevents non-target protein from diffusing into the double layer (Debye screening length range). The Debye screening lengths λD at 0.05 PBS is about 3.3 nm,71–73 which is smaller than the size of anti-GFAP. As a result, anti-GFAP occupies most of the space of the double layer, inhibiting BSA diffusion except at very high BSA concentration gradients.
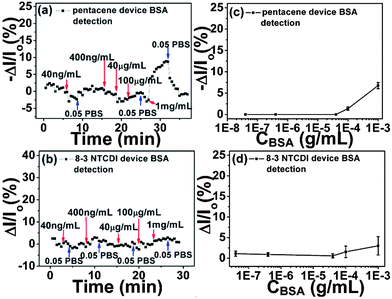 | ||
| Fig. 4 Drain current changes of anti-GFAP modified pentacene (a) and 8-3 NTCDI (b) devices versus time at different BSA concentrations. Drain current changes of anti-GFAP modified pentacene (c) and 8-3 NTCDI (d) devices versus BSA concentrations; Y bar is the standard deviation of drain current changes, each data point is repeated at least five times. Note the much higher concentrations used compared to Fig. 3. | ||
This is also verified by the data in Fig. 5, where all the responses were recorded using devices that were not functionalized with the anti-GFAP layer. As shown in Scheme 2(c), ethanolamine instead of anti-GFAP was used to react with an NHS-treated PS-block-PAA surface for 6 hours. The resulting –OH rich surface should not be able to specifically bind with any protein nor exhibit any selectivity.
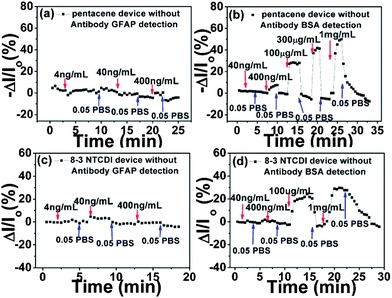 | ||
| Fig. 5 Drain current changes of pentacene (a and b) and 8-3 NTCDI (c and d) devices versus time at different GFAP and BSA concentrations, without anti-GFAP functionalization. Note the much higher concentrations used in (b and d) compared to Fig. 3. | ||
Furthermore, most of the volume that would be taken by a double layer is unoccupied, and any protein that moves into that volume would cause a reversible current change. As expected, in Fig. 5, both GFAP and BSA are shown to generate reversible signals. BSA signals in Fig. 5 are much higher than those in Fig. 4 at the same BSA concentrations, indicated that BSA could freely diffuse into the double layer region without being hindered by an anti-GFAP layer. At the higher BSA concentration, even more BSA diffuses into the double layer region and gives higher reversible responses. GFAP also shows non-specific adsorption responses; the signals of GFAP in Fig. 3 are much higher than those in Fig. 5 at the same GFAP concentrations because the strong affinity between anti-GFAP and GFAP drives more GFAP into the double layer region. All these results unambiguously illustrate that the anti-GFAP layer plays a critical role in generating the desired specific signals and reducing non-specific adsorption signals.
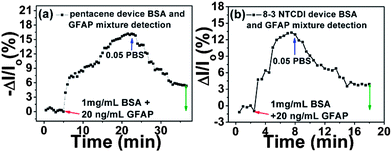
We further investigated the sensor responses to GFAP in a mixture with highly concentrated non-target BSA, to simulate a clinical situation where GFAP would exist in a mixture with other, more concentrated human serum albumin (HSA) and other proteins. As shown in Fig. 6, a mixture of 1 mg mL−1 BSA and 20 ng mL−1 GFAP was used. For pentacene, the drain current decreased then saturated, while for 8-3 NTCDI, the drain current increased then saturated. After rinsing with pure 0.05 PBS, both devices recovered but not completely back to the original current levels, with the irreversible part of the responses attributed to GFAP according to the previous sensing results. Although the irreversible response magnitude is smaller than the responses to the same concentration of pure GFAP, the results are still promising for clinical application. The net signal of anti-GFAP–GFAP specific binding can be preserved and identified after 0.05 PBS rinsing to reverse other non-specific and meta-stable signals.
We wished to verify that the response mechanism did in fact involve a response in the semiconductor to the antibody–GFAP binding-induced polarization of the upper device surface. As shown in Scheme 3, we carried out a set of control experiments where the semiconductor was omitted from the device. The results are shown in Fig. 7. The absolute currents observed in the devices are shown in Table 1. The ratio of current with pentacene to current without pentacene is about 30 (±9.7), and the ratio is about 7.5 (±2.2) for 8-3 NTCDI. About 95–98% of the current flows through the semiconductor between the source and the drain with pentacene as the semiconductor, based on only 2–5% of measured current without the semiconductor compared to with it. For the NTCDI semiconductor, between 80 and 90% of the current flows through the semiconductor. Importantly, the response to 1 ng mL−1 of GFAP without any semiconductor is undetectable, so all of the response to such low concentrations involves current through the semiconductor. Because adding the semiconductor roughly doubles the total area of semiconductor and source–drain electrodes combined, the fact that adding semiconductor generally increased the current by much more than 100% means that the current does not significantly involve random leakage between the conductive OTFT layers and the aqueous solutions.
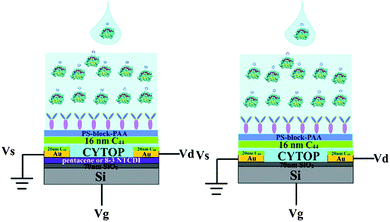 | ||
| Scheme 3 Two different test architectures: from left to right, with semiconductor and without semiconductor. | ||
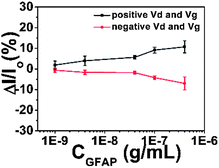 | ||
| Fig. 7 Responses of devices with no semiconductor to GFAP. Each data point is repeated at least five times. | ||
| Semiconductor | No semiconductor | Current ratio (with/without semiconductor) | |||
|---|---|---|---|---|---|
| Pentacene | 8-3 NTCDI | Negative Vd & Vg | Positive Vd & Vg | Pentacene | 8-3 NTCDI |
| 3 ± 2 μA | 0.6 ± 0.3 μA | 100 ± 40 nA | 80 ± 40 nA | 30 (±9.7) | 7.5 (±2.2) |
Zeta potential measurement
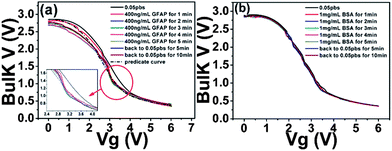
In order to characterize device surface potential change before and after GFAP binding with immobilized anti-GFAP in a more fundamental way, we measured the zeta potential change of particles of which surface has exactly the same biochemical structures and properties with FET device surface before and after GFAP binding. Although zeta potential is not exactly equal to surface potential or Stern potential in the double layer, the trend of zeta potential change is consistent with the trend of surface potential change.76,77 We first functionalized the particles (Life Technologies Corporation, carboxyl latex, particle surface is covered with COOH group) with anti-GFAP by EDC–NHS based bio conjugation chemistry for 6 hours, then anti-GFAP modified particle suspension was washed five times by centrifuge (4000 rpm, 4 minutes) to remove any unbound anti-GFAP. The zeta potential of these anti-GFAP modified particles was measured with a value of −32 mV. 100 ng GFAP was added to 60 μg anti-GFAP modified particle suspension (total volume is 2 mL), after 30 minutes, and the GFAP bonded anti-GFAP modified particle suspension was washed again five times to remove any unbounded GFAP. The zeta potential of these GFAP/anti-GFAP/particles was measured, and a value of −39.3 mV was obtained. All the measurements were conducted in 0.05 PBS. As we can see, after GFAP binding, the zeta potential (reflecting the surface potential) becomes more negative,76,77 this is also consistent with the current change of the TFT devices. Furthermore, these results provide further evidence that the surface potential change can be detected by TFT devices.Having complementary responses from pentacene and 8-3-NTCDI, we made a first attempt to obtain a voltage response from an inverter incorporating the two semiconductors, the structure of which is shown in Scheme 2(d).78 The inverter electrical performances in air and in 0.05 PBS are shown in Fig. S2.† This inverter shows the proper characteristics in air (Vg sweep from 0 V to 6 V, Vdd = 3 V, Vs = 0 V) with sharp switching behavior. After exposure to 0.05 PBS, output voltage slightly decreased to 2.8 V at Vg = 0 V and slightly increased to 0.4 V at Vg = 6 V. When 400 ng mL−1 GFAP 0.05 PBS solution was introduced, the output V–Vg curve gradually shifted to the left and then saturated while output voltage slightly decreased to 2.68 V at Vg = 0 V. After rinsing with pure 0.05 PBS, the curve only slightly shifted back to the right, indicating irreversible anti GFAP–GFAP binding (Fig. 8). No obvious shift occurred on introducing 1 mg mL−1 BSA 0.05 PBS solution. This is the first indication that an inverter, or certainly an organic inverter, can respond to a protein. While the magnitude of the voltage shift is modest, the observation is in line with theoretical expectations based on the resistance changes, plotted as black dotted line in Fig. 8. The observation provides further evidence for the opposite current responses of p- and n-OTFTs to the same protein solution, and opens the door for improvement of this device architecture so that digital responses can be obtained.
Additional discussion
We hypothesize that the protein binding to the antibody creates a surface dipole with the negative end toward the solution and the positive end toward the device.77 The OTFT threshold voltage shifts and zeta potential measurement are consistent with this. The current is mostly from the source to the drain, along the semiconductor channel. The dipole decreases the hole concentration for pentacene and increases the electron concentration for the NTCDI. The response must require both the antibody and the GFAP protein because of all the control experiments (with either the nontarget BSA or without the antibody) that did not give the response. The response cannot be from a small molecule impurity in the GFAP solution because the response is mostly irreversible. The change in pH when the GFAP is added is much too small to give a response (Table S1†), considering the measured responses to large, intentional pH changes.The CYTOP layer acts as a second (top) gate dielectric, and any selective binding of the target protein to surface-linked antibody occurring within the Debye screening length (double layer) should lead to charge density and distribution changes at the dielectric–electrolyte interface,25,71–73 thus changing the interfacial potential; all these changes will result in a corresponding change of the source–drain current. For p-channel transistors, binding of negatively charged species on the top gate will induce a net dipole pointing negative to positive toward the semiconductor, and pull holes away from channel, causing a drain current decrease, whereas opposite responses should be observed for an n-channel transistor.20,21,30 There are also some other reports showing that binding of negatively charged species on the top gate increased p transistor drain current.21b Thus, antigen–antibody binding on device surfaces is much less predictable than might be expected.79 The net charge density or surface potential change after target protein binding cannot be simply assessed from the net charge of bound protein; the charge distribution along the probe (antibody) and its conformation change on binding with target protein will also affect the ultimate surface potential change direction.25 Furthermore, a recent study pointed out that in some situations more sophisticated models rather than the classic electrochemical double layer would be required to assess the role of target position relative to the double layer, since large signals were observed even though the bound analyte was far from the surface. The new models should take into account the discreteness of the charges and the fundamentally three-dimensional nature of the double layer, as well as the conformational changes of the biomaterial layer upon interaction.25 Whatever the mechanisms for responses in any given system, opposite responses from n and p semiconductors should be expected, and it is worthwhile to incorporate both p- and n-transistors in one chip to discriminate possible electrical cross-talk and/or false-positive signals by correlating the response versus time from the two types of device elements.
Inorganic semiconductors such as crystalline Si could also be employed as an electrically active layer, result in a device similar to the Si based ChemFET,80 with the top bio-receptor layer functionalized as a gate layer. Crystalline Si should be able to give better performance while compared with organic semiconductors due to its high mobility and excellent durability. The main advantages of using organic semiconductors to inorganic semiconductors are: (1) a flexible device can be achieved by using organic semiconductors, which is promising to integrate into wearable or implantable medical care device; (2) spin-coating and printing methods can be employed for organic semiconductors due to their good solubility in common organic solvents, which makes scale up potentially more feasible; (3) large area devices can be easily fabricated by using organic semiconductors; (4) there is potentially lower cost for organic semiconductor device fabrication; (5) surface modification is facile by simple chemical tailoring.
Conclusions
We have developed a sensitive (20 pM) and selective sensor platform for brain injury marker (GFAP) detection using both p- and n-type organic molecules as semiconductors and a hybrid fluorocarbon–hydrocarbon top dielectric. Control experiments showed that this sensor platform exhibits excellent selectivity and target protein recognition ability. p- and n-channel semiconductors gave opposite current responses, as expected. To the best of our knowledge, this is the most sensitive protein sensor based on OTFTs. We also report the first use of an n-channel organic film as a specific protein sensor semiconductor, opening up the possibility of sensitive complementary organic inverter biosensors. Furthermore, we successfully discriminate the artificial response from the intrinsic true response by a number of control experiments, which is important for understanding the origin of sensor responses.The ability to define the p- and n-channels and the ease of processing are the main advantages of our use of organic semiconductors at this stage. While they presently provide a convenient demonstration vehicle, the semiconducting and transduction activities could ultimately be obtained with inorganic alternatives as well, while continuing to take advantage of the top dielectric and coupling chemistries. This platform should be generalizable to other clinically relevant biomarker complexation and detection needs.
Experimental section
Materials and device fabrication
All materials were purchased from Sigma-Aldrich and used without further purification unless otherwise noted. 8-3 NTCDI was synthesized according to previous literature.81,82 Glial Fibrillary Acidic Protein (GFAP) was purchased from EMD Biosciences, and anti-GFAP (SMI-26R) was purchased from Covance. Highly n-doped 〈100〉 silicon (as gate electrodes) wafers with 70 ± 5 nm thermally grown oxide were diced into 1 in. by 1 in. substrates, cleaned with piranha solution (Caution – corrosive!), sonicated in acetone and isopropanol, and then dried by forced nitrogen gas. Substrates were further dried by 100 °C vacuum annealing for 20 minutes prior to a 2 hour exposure to hexamethyldisilazane (HMDS) vapor at 110 °C in a loosely sealed vessel. Pentacene (triple sublimed) or 8-3 NTCDI (triple sublimed) was then thermally evaporated directly onto HMDS-treated substrates with a thickness of 50 nm at a rate of 0.3 Å s−1, substrate temperature during the deposition was held constant at 80 °C. The deposition chamber pressure was <5 × 10⁻⁶ Torr. Then, gold electrodes (50 nm) were thermally vapor-deposited through an interdigitation mask (as show in Fig. S1,† channel width/length (77![[thin space (1/6-em)]](https://www.rsc.org/images/entities/char_2009.gif) 000 μm/250 μm)) at 0.3 Å s−1. 20 nm tetratetracontane was then thermally evaporated on Au electrodes to protect electrodes against any trace amount of buffer solution that may penetrate through the CYTOP layer. CYTOP (9% weight, Bellex International Corporation) was spin-coated on device surfaces with a thickness of 200 ± 20 nm, and annealed at 50 °C for 15 minutes under nitrogen atmosphere. 16–20 nm tetratetracontane was then thermally evaporated onto the CYTOP layer to fill any residual pinholes in the CYTOP film; furthermore, this tetratetracontane layer also functioned as an adhesive layer for the following N-hydroxysuccinimide (NHS) treated PS-block-PAA (poly(styrene)-block-poly(acrylic acid)) layer. AFM topography images were observed by tapping mode using Molecular imaging PicoPlus. The carboxylic acid groups of PS-block-PAA were activated by adding 20 mg N-(3-dimethylaminopropyl)-N′-ethylcarbodiimide hydrochloride (EDC) into the PS-block-PAA solution (10 mg mL−1 in mix solvent of 0.6 mL anhydrous dichloromethane and 0.4 mL anhydrous N,N′-dimethylformamide), and after stirring at room temperature for 1 hour, 10 mg N-hydroxysuccinimide (NHS) was added to the mixture, with continued stirring at room temperature for another 6 hours. The resulting mixture was spin-coated on the tetratetracontane layer at a speed of 3000 rpm for 120 seconds. Then the device surface was dipped into DI water for 5 minutes to remove excess EDC and NHS, and dried with gentle nitrogen flow, repeating this dip–dry cycle 5 times to make sure all the excess EDC and NHS were completely removed. The resulting PS-block-PAA layer thickness was 20 ± 5 nm. All the OTFTs were characterized using an Agilent 4155C semiconductor analyzer. During sensor performance characterization, Vg = Vds = −3 V (for pentacene devices) or 3 V (for 8-3 NTCDI devices). Perfluorodecalin was used to remove CYTOP at certain areas to access the gold electrodes for measurement.68 Solutions to which responses were recorded, or which were used for rinsing, were introduced onto devices as 100 μL aliquots via a micropipette, and withdrawn either by micropipette or tissue paper absorption. In order to prevent water evaporate, the measurements were conducted in a water-vapour-saturated environment.
000 μm/250 μm)) at 0.3 Å s−1. 20 nm tetratetracontane was then thermally evaporated on Au electrodes to protect electrodes against any trace amount of buffer solution that may penetrate through the CYTOP layer. CYTOP (9% weight, Bellex International Corporation) was spin-coated on device surfaces with a thickness of 200 ± 20 nm, and annealed at 50 °C for 15 minutes under nitrogen atmosphere. 16–20 nm tetratetracontane was then thermally evaporated onto the CYTOP layer to fill any residual pinholes in the CYTOP film; furthermore, this tetratetracontane layer also functioned as an adhesive layer for the following N-hydroxysuccinimide (NHS) treated PS-block-PAA (poly(styrene)-block-poly(acrylic acid)) layer. AFM topography images were observed by tapping mode using Molecular imaging PicoPlus. The carboxylic acid groups of PS-block-PAA were activated by adding 20 mg N-(3-dimethylaminopropyl)-N′-ethylcarbodiimide hydrochloride (EDC) into the PS-block-PAA solution (10 mg mL−1 in mix solvent of 0.6 mL anhydrous dichloromethane and 0.4 mL anhydrous N,N′-dimethylformamide), and after stirring at room temperature for 1 hour, 10 mg N-hydroxysuccinimide (NHS) was added to the mixture, with continued stirring at room temperature for another 6 hours. The resulting mixture was spin-coated on the tetratetracontane layer at a speed of 3000 rpm for 120 seconds. Then the device surface was dipped into DI water for 5 minutes to remove excess EDC and NHS, and dried with gentle nitrogen flow, repeating this dip–dry cycle 5 times to make sure all the excess EDC and NHS were completely removed. The resulting PS-block-PAA layer thickness was 20 ± 5 nm. All the OTFTs were characterized using an Agilent 4155C semiconductor analyzer. During sensor performance characterization, Vg = Vds = −3 V (for pentacene devices) or 3 V (for 8-3 NTCDI devices). Perfluorodecalin was used to remove CYTOP at certain areas to access the gold electrodes for measurement.68 Solutions to which responses were recorded, or which were used for rinsing, were introduced onto devices as 100 μL aliquots via a micropipette, and withdrawn either by micropipette or tissue paper absorption. In order to prevent water evaporate, the measurements were conducted in a water-vapour-saturated environment.
Antibody immobilization
Anti-GFAP was covalently attached to the activated PS-block-PAA surface from a 6.6 μM anti-GFAP PBS solution for 6 hours at room temperature, and then gently rinsed with PBS to remove any non-covalently bound materials. Additionally, ethanolamine solution (5% volume in PBS) was then dropped on the device surface and allowed to react for another 6 hours to block any activated carboxylic groups that did not already react with the anti-GFAP. Finally, the device surface was gently rinsed 5 times to remove excess ethanolamine solution. As a control experiment, OFET devices without anti-GFAP were prepared by reacting ethanolamine solution (5% volume in PBS) with NHS treated PS-block-PAA surfaces for 6 hours at room temperature. To avoid water evaporation and contamination, the samples were maintained in a humid bacteria-free chamber during the reactions.Zeta potential measurement
Particles (Life Technologies Corporation, 4 wt% in water, carboxyl latex, particle surface is covered with COOH group carboxyl latex, 0.59 μm diameter) was first suspend in 0.05 PBS (10 mg mL−1), EDC and then NHS was added into suspension to activate carboxylic acid group, after 1 hour, the suspension was washed five time by repeat centrifuge (4000 rpm, 4 minutes) to remove excess EDC and NHS. Anti-GFAP (0.33 mg mL−1 in 0.05 PBS) was added into the EDC–NHS activated suspension, gently stirred for another 6 hours, and then the suspension was washed five time by repeat centrifuge (4000 rpm, 4 minutes) to remove unbound anti-GFAP. Finally, 200 ng GFAP was added into Anti-GFAP modified particles, gently stirred for another 30 minutes, the resulted suspension was washed again to remove unbounded GFAP. Both anti-GFAP modified particles (anti-GFAP/particles) and final GFAP/anti-GFAP/particles was subjected to zeta potential measurement. For anti-GFAP/particles, the value of zeta potential is −32 mV, and the zeta potential value of GFAP/anti-GFAP/particles is −39.3 mV. Each measurement was repeated for 3 times. Data was acquired by Malvern instruments ZEN 3600 Zetasizer.GFAP information
The molecular weight of GFAP is about 50 kDa, and its isoelectric point (PI point) is 5.4. The charge number at pH 7.4 is −13, the program for calculating charge number is provided in ESI.†GFAP sequence: MERRRITSAA RRSYVSSGEM MVGGLAPGRR LGPGTRLSLA RMPPPLPTRV DFSLAGALNA GFKETRASER AEMMELNDRF ASYIEKVRFL EQQNKALAAE LNQLRAKEPT KLADVYQAEL RELRLRLDQL TANSARLEVE RDNLAQDLAT VRQKLQDETN LRLEAENNLA AYRQEADEAT LARLDLERKI ESLEEEIRFL RKIHEEEVRE LQEQLARQQV HVELDVAKPD LTAALKEIRT QYEAMASSNM HEAEEWYRSK FADLTDAAAR NAELLRQAKH EANDYRRQLQ SLTCDLESLR GTNESLERQM REQEERHVRE AASYQEALAR LEEEGQSLKD EMARHLQEYQ DLLNVKLALD IEIATYRKLL EGEENRITIP VQTFSNLQIR ETSLDTKSVS EGHLKRNIVV KTVEMRDGEV IKESKQEHKD VM.
Enzyme-linked immuno sorbent assay (ELISA) experiment
The GFAP assay was developed using the antibody reagents (described by Petzold Etal) and adapted as an ELISA on MesoScale Discovery (MSD) platform (Gaithersburg, MD). Monoclonal anti-GFAP SMI-26 (Covance, Princeton, NJ) was used as a capture at 100 ng in 30 μL PBS per well, incubated overnight in standard bind MSD plates. Polyclonal anti-GFAP (Dako, Carpinteria, CA) conjugated with Sulfo-Tag (MSD) was used for detection at 1 μg mL−1 in PBS. Standard curves were made of purified GFAP (Calbiochem, La Jolla, CA) in 1% bovine serum albumin (SeraCare Life Sciences, Milford, MA) with 4 fold dilutions starting at 40 ng mL−1. Assays were analyzed on a Sector Imager 2400 (MSD) according to the manufacturer's protocol. Lower limit of detection was 0.011 ng mL−1. The lower limit of quantification, defined as the lowest dilution with a calculated concentration ±20% of a known concentration, was 0.040 ng mL−1.Acknowledgements
We thank Dr Jun Yang for fruitful discussion. We are grateful to the Cove Point Foundation for primary support of this work. We also thank the JHU Environment, Energy, Sustainability and Health Institute for support of water-stable OTFT development, and DOE Office of Basic Energy Sciences Grant number DE-FG02-07ER46465 for material synthesis and AFM characterizations.Notes and references
- L. Torsi, A. Dodabalapur, L. Sabbatini and P. G. Zambonin, Sens. Actuators, B, 2000, 67, 312–316 CrossRef CAS.
- B. Crone, A. Dodabalapur, A. Gelperin, L. Torsi, H. E. Katz, A. J. Lovinger and Z. Bao, Appl. Phys. Lett., 2001, 78, 2229–2231 CrossRef CAS.
- K. Potje-Kamloth, Chem. Rev., 2008, 108, 367–399 CrossRef CAS PubMed.
- T. Someya, A. Dodabalapur, J. Huang, K. C. See and H. E. Katz, Adv. Mater., 2010, 22, 3799–3811 CrossRef CAS PubMed.
- J. Huang, J. Miragliotta, A. Becknell and H. E. Katz, J. Am. Chem. Soc., 2007, 129, 9366–9376 CrossRef CAS PubMed.
- M. L. Hammock, A. N. Sokolov, R. M. Stoltenberg, B. D. Naab and Z. N. Bao, ACS Nano, 2012, 6, 3100–3108 CrossRef CAS PubMed.
- (a) L. Torsi, G. M. Farinala, F. Marinelli, M. C. Tanese, O. H. Omar, L. Valli, F. Babudri, F. Palmisano, P. G. Zambonin and F. Naso, Nat. Mater., 2008, 7, 412–417 CrossRef CAS PubMed; (b) M. Magliulo, A. Mallardi, R. Gristina, F. Ridi, L. Sabbatini, N. Cioffi, G. Palazzo and L. Torsi, Anal. Chem., 2013, 85, 3849–3857 CrossRef CAS PubMed.
- C. Kim, Z. M. Wang, H.-J. Choi, Y.-G. Ha, A. Facchetti and T. J. Marks, J. Am. Chem. Soc., 2008, 130, 6867–6878 CrossRef CAS PubMed.
- A. N. Sokolov, B. C.-K. Tee, C. J. Bettinger, J. B.-H. Tok and Z. N. Bao, Acc. Chem. Res., 2012, 45, 361–371 CrossRef CAS PubMed.
- J. E. Royer, C. Y. Zhang, A. C. Kummel and W. C. Trogler, Langmuir, 2012, 28, 6192–6200 CrossRef CAS PubMed.
- F. I. Bohrer, C. N. Colesniuc, J. Park, M. E. Ruidiaz, I. K. Schuller, A. C. Kummel and W. C. Trogler, J. Am. Chem. Soc., 2009, 131, 478–485 CrossRef CAS PubMed.
- F. I. Bohrer, A. Sharoni, C. N. Colesniuc, J. Park, I. K. Schuller, A. C. Kummel and W. C. Trogler, J. Am. Chem. Soc., 2007, 129, 5640–5646 CrossRef CAS PubMed.
- T. Sekitani and T. Someya, Adv. Mater., 2010, 22, 2228–2246 CrossRef CAS PubMed.
- T. Someya, J. Small, P. Kim, C. Nuckolls and J. T. Yardley, Nano Lett., 2003, 3, 877–881 CrossRef CAS.
- T. Someya, A. Dodabalapur, A. Gelperin, H. E. Katz and Z. Bao, Langmuir, 2002, 18, 5299–5302 CrossRef CAS.
- (a) W. G. Huang, K. Besar, R. LeCover, A. M. Rule, P. N. Breysse and H. E. Katz, J. Am. Chem. Soc., 2012, 134, 14650–14653 CrossRef CAS PubMed; (b) L. Li, P. Gao, M. Baumgarten, K. Müllen, N. Lu, H. Fuchs and L. Chi, Adv. Mater., 2013, 25, 3419–3425 CrossRef CAS PubMed.
- M. Bouvet, H. Xiong and V. Parra, Sens. Actuators, B, 2010, 146, 501–506 CrossRef PubMed.
- B. Esser, J. M. Schnorr and T. M. Swager, Angew. Chem., Int. Ed. Engl., 2012, 51, 5752–5756 CrossRef CAS PubMed.
- A. Das, R. Dost, T. Richardson, M. Grell, J. J. Morrison and M. L. Turner, Adv. Mater., 2007, 19, 4018–4023 CrossRef CAS.
- H. U. Khan, J. Jang, J.-J. Kim and W. Knoll, J. Am. Chem. Soc., 2011, 133, 2170–2176 CrossRef CAS PubMed.
- (a) M. Magliulo, A. Mallardi, M. Y. Mulla, S. Cotrone, B. R. Pistillo, P. Favia, I. Vikholm-Lundin, G. Palazzo and L. Torsi, Adv. Mater., 2013, 25, 2090–2094 CrossRef CAS PubMed; (b) M. L. Hammock, O. Knopfmacher, B. D. Naab, J. B.-H. Tok and Z. Bao, ACS Nano, 2013, 7, 3970–3980 CrossRef CAS PubMed.
- D. Goncalves, D. M. F. Prazeres, V. Chu and J. P. Conde, Biosens. Bioelectron., 2008, 24, 545–661 CrossRef CAS PubMed.
- B. Khamaisi, O. Vaknin, O. Shaya and N. Ashkenasy, ACS Nano, 2010, 4, 4601–4608 CrossRef CAS PubMed.
- (a) G. Zheng, F. Patolsky, Y. Cui, W. U. Wang and C. M. Lieber, Nat. Biotechnol., 2005, 23, 1294–1301 CrossRef CAS PubMed; (b) F. Shen, J. Wang, Z. Xu, Y. Wu, Q. Chen, X. Li, X. Jie, L. Li, M. Yao, X. Guo and T. Zhu, Nano Lett., 2012, 12, 3722–3730 CrossRef CAS PubMed.
- (a) O. Keskin, BMC Struct. Biol., 2007, 7, 31 CrossRef PubMed; (b) P. Estrela, D. Paul, Q. Song, L. K. J. Stadler, L. Wang, E. Huq, J. J. Davis, P. K. Ferrigno and P. Migliorato, Anal. Chem., 2010, 82, 3531–3536 CrossRef CAS PubMed.
- L. Kergoat, L. Herlogsson, D. Braga, B. Piro, M.-C. Pham, X. Crispin, M. Berggren and G. Horowitz, Adv. Mater., 2010, 22, 2565–2569 CrossRef CAS PubMed.
- F. Buth, A. Donner, M. Sachsenhauser, M. Stutzmann and J. A. Garrido, Adv. Mater., 2012, 24, 4511–4517 CrossRef CAS PubMed.
- (a) S. J. Park, O. S. Kwon, S. H. Lee, H. S. Song, T. H. Park and J. Jang, Nano Lett., 2012, 12, 5082–5090 CrossRef CAS PubMed; (b) S. Jiang, R. Cheng, X. Wang, T. Xue, Y. Liu, A. Nel, Y. Huang and X. Duan, Nat. Commun., 2013, 4, 2225 Search PubMed.
- Z.-S. Kim, S. C. Lim, S. H. Kim, Y. S. Yang and D.-H. Hwang, Sensors, 2012, 12, 11238–11248 CrossRef CAS PubMed.
- (a) H. U. Khan, M. E. Roberts, O. Johnson, R. Förch, W. Knoll and Z. Bao, Adv. Mater., 2010, 22, 4452–4456 CrossRef CAS PubMed; (b) Y. M. Park and A. Salleo, Appl. Phys. Lett., 2009, 95, 133307 CrossRef.
- S. Lai, M. Demelas, G. Casula, P. Cosseddu, M. Barbaro and A. Bonfiglio, Adv. Mater., 2013, 25, 103–107 CrossRef CAS PubMed.
- X. Duan, R. Gao, P. Xie, T. Cohen-Karni, Q. Qing, H. S. Choe, B. Tian, X. Jiang and C. M. Lieber, Nat. Nanotechnol., 2012, 7, 174–179 CrossRef CAS PubMed.
- M. C. Mcalpine, H. Ahmad, D. Wang and J. R. Heath, Nat. Mater., 2007, 6, 379–384 CrossRef CAS PubMed.
- L. Kergoat, B. Piro, M. Berggren, M.-C. Pham, A. Yassar and G. Horowitz, Org. Electron., 2012, 13, 1–6 CrossRef CAS PubMed.
- T.-W. Lin, P.-J. Hsieh, C.-L. Lin, Y.-Y. Fang, J.-X. Yang, C.-C. Tsai, P.-L. Chiang, C.-Y. Pan and Y.-T. Chen, Proc. Natl. Acad. Sci. U. S. A., 2010, 107, 1047–1052 CrossRef CAS PubMed.
- G. Gruner, Anal. Bioanal. Chem., 2006, 384, 322–335 CrossRef CAS PubMed.
- (a) P. A. Bobbert, A. Sharma, S. G. J. Mathijssen, M. Kemerink and D. M. de Leeuw, Adv. Mater., 2012, 24, 1146–1158 CrossRef CAS PubMed; (b) M.-J. Spijkman, J. J. Brondijk, T. C. T. Geuns, E. C. P. Smits, T. Cramer, F. Zerbetto, P. Stoliar, F. Biscarini, P. W. M. Blom and D. M. de Leeuw, Adv. Funct. Mater., 2010, 20, 898–905 CrossRef CAS.
- Y. Cheng, K.-S. Chen, N. L. Meyer, J. Yuan, L. S. Hirst, P. B. Chase and P. Xiong, Biosens. Bioelectron., 2011, 26, 4538–4554 CrossRef CAS PubMed.
- M. M. A. Hakim, M. Lombardini, K. Sun, F. Giustiniano, P. L. Roach, D. E. Davies, P. H. Howarth, M. R. R. de Planque, H. Morgan and P. Ashburn, Nano Lett., 2012, 12, 1868–1872 CrossRef CAS PubMed.
- (a) M. B. Lerner, J. D'Souza, T. Pazina, J. Dailey, B. R. Goldsmith, M. K. Robinson and A. T. C. Johnson, ACS Nano, 2012, 6, 5143–5149 CrossRef CAS PubMed; (b) S. Liu and X. Guo, NPG Asia Mater., 2012, 4, e23 CrossRef; (c) X. Guo, Adv. Mater., 2013, 25, 3397–3408 CrossRef CAS PubMed; (d) S. Liu, X. Zhang, W. Luo, Z. Wang, X. Guo, M. L. Steigerwald and X. Fang, Angew. Chem., Int. Ed., 2011, 50, 2496–2502 CrossRef CAS PubMed; (e) S. Sorgenfrei, C.-Y. Chiu, R. L. Gonzalez, Jr, Y.-J. Yu, P. Kim, C. Nuckolls and K. L. Shepard, Nat. Nanotechnol., 2011, 6, 126–132 CrossRef CAS PubMed.
- B. L. Allen, P. D. Kichambare and A. Star, Adv. Mater., 2007, 19, 1439–1451 CrossRef CAS.
- I. Heller, A. M. Janssens, J. Mannik, E. D. Minot, S. G. Lemay and C. Dekker, Nano Lett., 2008, 8, 591–595 CrossRef CAS PubMed.
- Z. F. Kuang, S. N. Kim, W. J. Crookes-Goodson, B. L. Farmer and R. R. Naik, ACS Nano, 2010, 4, 452–458 CrossRef CAS PubMed.
- (a) S. N. Kim, J. F. Rusling and F. Papadimitrakopoulos, Adv. Mater., 2007, 19, 3214–3228 CrossRef CAS PubMed; (b) H. Yoon, S. H. Lee, O. S. Kwon, H. S. Song, E. H. Oh, T. H. Park and J. Jang, Angew. Chem., Int. Ed., 2009, 48, 2755–2758 CrossRef CAS PubMed; (c) H. S. Song, O. S. Kwon, S. H. Lee, S. J. Park, U.-K. K. J. Jang and T. H. Park, Nano Lett., 2013, 13, 172–178 CrossRef CAS PubMed.
- Y. Gao and I. Kyratzis, Bioconjugate Chem., 2008, 19, 1945–1950 CrossRef CAS PubMed.
- Y. Ohno, K. Maehashi, Y. Yamashiro and K. Matsumoto, Nano Lett., 2009, 9, 3318–3322 CrossRef CAS PubMed.
- M. Ramesh, H.-C. Lin and C.-W. Chu, J. Mater. Chem., 2012, 22, 16506–16513 RSC.
- W. J. Savage, E. Barron-Casella, Z. Fu, P. Dulloor, L. Williams, B. J. Crain, D. A. White, J. M. Jenning, J. E. Van Eyk, M. R. Debaun, A. D. Everett and J. F. Casella, Am. J. Hematol., 2011, 86, 427–429 CrossRef CAS PubMed.
- W. J. Savage, A. D. Everett and J. F. Casella, Acta Haematol., 2011, 125, 103–106 CrossRef PubMed.
- J. E. Bell, J. C. Becher, B. Wyatt, J. W. Keeling and N. McIntosh, Brain, 2005, 128, 1070–1081 CrossRef CAS PubMed.
- G. Bernert, H. Hoeger, W. Mosgoeller, D. Stolzlechner and B. Lubec, Pediatr. Res., 2003, 54, 523–528 CrossRef PubMed.
- M. Blennow, K. Sävman, P. Ilves, M. Thoresen and L. Rosengren, Acta Paediatr., 2001, 90, 1171–1175 CrossRef CAS.
- M. Blennow, H. Hagberg and L. Rosengren, Pediatr. Res., 1995, 37, 260–264 CrossRef CAS PubMed.
- M. M. Bembea, W. Savage, J. J. Strouse, J. M. Schwartz, E. Graham, C. B. Thompson and A. Everett, Pediatr. Crit. Care Med., 2011, 12, 572–579 CrossRef PubMed.
- L. E. Pelinka, A. Kroepfl and R. Schmidhammer, J. Trauma, 2004, 57, 1006–1012 CrossRef CAS.
- M. Honda, R. Tsuruta and T. Kaneko, J. Trauma, 2010, 69, 104–109 CrossRef CAS PubMed.
- M. Wiesmann, E. Steinmeier, O. Magerkurth, J. Linn, D. Gottmann and U. Missler, Acta Neurol. Scand., 2010, 121, 178–185 CrossRef CAS PubMed.
- F. Dvorak, I. Haberer, M. Sitzer and C. Foerch, Cerebrovasc. Dis., 2009, 27, 37–41 CrossRef CAS PubMed.
- C. Foerch, I. Curdt and B. Yan, J. Neurol., Neurosurg. Psychiatry, 2006, 77, 181–184 CrossRef CAS PubMed.
- D. B. Andropouls, J. V. Hunter, D. P. Nelson, S. A. Stayer, A. R. Stark, E. D. McKenzie, J. S. Heinle, D. E. Graves and D. C. Fraser Jr, J. Thorac. Cardiovasc. Surg., 2010, 139, 543–556 CrossRef PubMed.
- D. R. Gress, J. Am. Coll. Cardiol., 2012, 60, 1614–1616 CrossRef PubMed.
- A. Petzold, G. Keir, A. J. E. Green, G. Giovannoni and E. J. Thompson, J. Immunol. Methods, 2004, 287, 169–177 CrossRef CAS PubMed.
- E. Stenberg, B. Persson, H. Roos and C. Urbaniczky, J. Colloid Interface Sci., 1991, 143, 513–526 CrossRef CAS.
- G. H. Wu, R. H. Datar, K. M. Hansen, T. Thundat, R. J. Cote and A. Majumdar, Nat. Biotechnol., 2001, 19, 856–860 CrossRef CAS PubMed.
- Y. Fujisaki, Y. Nakajima, D. Kumaki, T. Yamamoto, S. Tokito, T. Kono, J. Nishida and Y. Yamashita, Appl. Phys. Lett., 2010, 97, 133303 CrossRef.
- M. Barra, F. V. Di Girolamo, F. Chiarella, M. Salluzzo, Z. Chen, A. Facchetti, L. Anderson and A. Cassinese, J. Phys. Chem. C, 2010, 114, 20387 CAS.
- T. N. Ng, S. Sambandan, R. Lujan, A. C. Arias, C. R. Newman, H. Yan and A. Facchetti, Appl. Phys. Lett., 2009, 94, 233307 CrossRef.
- (a) H. H. Fong, J.-L. Lee, Y.-F. Lim, A. A. Zakhidov, W. W. H. Wong, A. B. Holmes, C. K. Ober and G. G. Malliaras, Adv. Mater., 2011, 23, 735–739 CrossRef CAS PubMed; (b) P. G. Taylor, J.-K. Lee, A. A. Zakhidov, M. Chatzichristidi, H. H. Fong, J. A. DeFranco, G. G. Malliaras and C. K. Ober, Adv. Mater., 2009, 21, 2314–2317 CrossRef CAS.
- J. Lahiri, L. Isaacs, J. Tien and G. M. Whitesides, Anal. Chem., 1999, 71, 777–790 CrossRef CAS.
- R. B. M. Schasfoort, P. Bergveld, R. P. H. Kooyman and J. Greve, Anal. Chim. Acta, 1990, 238, 323–329 CrossRef CAS.
- E. Stern, R. Wagner, F. J. Sigworth, R. Breaker, T. M. Fahmy and M. A. Reed, Nano Lett., 2007, 7, 3405–3409 CrossRef CAS PubMed.
- S. Sorgenfrei, C.-Y. Chiu, M. Johnston, C. Nuckolls and K. L. Shepard, Nano Lett., 2011, 11, 3739–3743 CrossRef CAS PubMed.
- G. S. Kulkarni and Z. H. Zhong, Nano Lett., 2012, 12, 719–723 CrossRef CAS PubMed.
- F. L. Bohrer, C. N. Colesniuc, J. Park, I. K. Schuller, A. C. Kummen and W. C. Trogler, J. Am. Chem. Soc., 2008, 130, 3712–3713 CrossRef CAS PubMed.
- O. S. Khalil, Clin. Chem., 1999, 45, 165–177 CAS.
- (a) B. Masereel, M. Dinguizli, C. Bouzin, N. Moniotte, O. Feron, B. Gallez, T. V. Borght, C. Michiels and S. Lucas, J. Nanopart. Res., 2011, 1573–1580 CrossRef CAS; (b) F. Thielbeer, K. Donaldson and M. Bradley, Bioconjugate Chem., 2011, 22, 144–150 CrossRef CAS PubMed; (c) K. Rezwan, L. P. Meier, M. Rezwan, J. Vörös, M. Textor and L. J. Gauckler, Langmuir, 2004, 10055–10061 CrossRef CAS PubMed; (d) A. C. Pinho and A. P. Piedade, ACS Appl. Mater. Interfaces, 2013, 8187–8194 CrossRef CAS PubMed.
- (a) Y. Jin, T. Honig, I. Ron, N. Friedman, M. Sheves and D. Cahen, Chem. Soc. Rev., 2008, 37, 2422–2432 RSC; (b) N. Amdursky, I. Pecht, M. Sheves and D. Cahen, J. Am. Chem. Soc., 2012, 134, 18221–18224 CrossRef CAS PubMed; (c) W. Li, L. Sepunaru, N. Amdursky, S. R. Cahen, I. Pecht, M. Sheves and D. Cohen, ACS Nano, 2012, 6, 10816–10824 CAS; (d) L. Sepunaru, N. Friedman, I. Pecht, M. Sheves and D. Cahen, J. Am. Chem. Soc., 2012, 134, 4169–4176 CrossRef CAS PubMed; (e) I. Ron, I. Pecht, M. Sheves and D. Cahen, Acc. Chem. Res., 2010, 43, 945–953 CrossRef CAS PubMed; (f) I. Ron, L. Sepunaru, S. Itzhakov, T. Belenkova, N. Friedman, I. Pecht, M. Sheves and D. Cahen, J. Am. Chem. Soc., 2010, 132, 4131–4140 CrossRef CAS PubMed.
- N. J. Tremblay, B. J. Jung, P. Breysse and H. E. Katz, Adv. Funct. Mater., 2011, 21, 4314–4319 CrossRef CAS PubMed.
- T. Goda and Y. Miyahara, Biosens. Bioelectron., 2013, 45, 89–94 CrossRef CAS PubMed.
- J. Janata, Electroanalysis, 2004, 16, 1831–1835 CrossRef CAS.
- H. E. Katz, A. J. Lovinger, J. Johnson, C. Kloc, T. Siegrist, W. Li, Y. Y. Lin and A. Dodabalapur, Nature, 2000, 404, 478–481 CrossRef CAS PubMed.
- H. E. Katz, J. Johnson, A. J. Lovinger, T. Siegrist and W. Li, J. Am. Chem. Soc., 2000, 122, 7787–7792 CrossRef CAS.
Footnote |
| † Electronic supplementary information (ESI) available. See DOI: 10.1039/c3sc52638k |
| This journal is © The Royal Society of Chemistry 2014 |

