Magnetic nanoparticle-loaded polymer nanospheres as magnetic hyperthermia agents†
Xiao Li
Liu
ab,
Eugene Shi Guang
Choo
b,
Anansa S.
Ahmed
c,
Ling Yun
Zhao
d,
Yong
Yang
b,
Raju V.
Ramanujan
c,
Jun Min
Xue
b,
Dai Di
Fan
a,
Hai Ming
Fan
*a and
Jun
Ding
*b
aShaanxi Key Laboratory of Degradable Biomedical Materials, School of Chemical Engineering, Northwest University, Xi'an, Shaanxi 710069, China. E-mail: fanhm@nwu.edu.cn; Fax: +86 2988303336; Tel: +86 29 88303336
bDepartment of Materials Science & Engineering, Faculty of Engineering, National University of Singapore, 7 Engineering Drive 1, Singapore 117574, Singapore. E-mail: msedingj@nus.edu.sg; Fax: +65 6776-3604; Tel: +65 6516-4317
cSchool of Materials Science and Engineering, Nanyang Technological University, Block N4.1, Nanyang Avenue, 639798, Singapore
dInstitute of Medical Physics and Engineering, Key Laboratory of Particle & Radiation Imaging, Ministry of Education, Department of Engineering Physics, Tsinghua University, Beijing, 100084, China
First published on 29th October 2013
Abstract
Uniform magnetic nanoparticle-loaded polymer nanospheres with different loading contents of manganese ferrite nanoparticles were successfully synthesized using a flexible emulsion process. The MnFe2O4-loaded polymer nanospheres displayed an excellent dispersibility in both water and phosphate buffer saline. The effect of loading ratio and size of MnFe2O4 nanoparticles within the nanospheres on the specific absorption rate (SAR) under an alternating magnetic field was investigated. Our results indicate that a large size (here 18 nm) and a low loading ratio are preferable for a high SAR. For a smaller particle size (6 nm), the low loading ratio did not result in an enhancement of the SAR value, while a very low SAR value is expected for 6 nm. In addition, the SAR of low-content MnFe2O4 (18 nm)-loaded polymer nanospheres in the agarose gel which is simulated for in vivo environment is the highest among the samples and does not change substantially in physiological environments. This differs largely from the behaviour of singly dispersed nanoparticles. Our results have paved the way for the design of MnFe2O4-loaded polymer nanospheres as magnetic hyperthermia agents for in vivo bio-applications.
Introduction1
Magnetic hyperthermia is a promising therapeutic concept for malignant tumor treatment by converting electromagnetic energy into heat using magnetic nano-mediators. This is based on the evidence that cancer cells are more sensitive than normal cells to temperatures higher than 41 °C.1–3 By engineering of magnetic nanoparticles, the magnetic hyperthermia effect can be utilized for controlled delivery of drugs or combined with magnetic resonance imaging (MRI) for in situ assessment of therapeutic efficacy at the cellular and molecular levels.4–6 These make it a promising modality for cancer diagnosis and treatment in clinical oncology.7–10 Superparamagnetic nanoparticles are widely used in hyperthermia investigations.11–14 However, small sized superparamagnetic nanoparticles have their limitation on these multi-modality bio-related applications, while large size nanoparticles are desired for many biomedical applications.15,16 For example, the nanocarriers loaded with therapeutic drugs often have an optimum size range. This favourable size range is about 100–200 nm in diameter in order to enhance permeability and retention (EPR) of nanocarriers due to the leaky vasculature of the tumour microenvironment and to avoid the human complement system, macrophage uptake, splenic as well as liver filtration.17,18 Feng et al. also reported that larger nanoparticles acquire much better properties for cellular uptake.19 Bèalle et al.20 reported that the SAR for 200 nm ultra magnetic liposome (UML) particles, in which magnetic nanoparticles are encapsulated, is remarkably higher than that of smaller sized magnetic nanoparticles. Recently, magnetic nanoparticle-loaded polymer nanospheres (MLPNs), at the range of this size, have attracted significant attention.21 Off-resonance MRI imaging by using those MLPNs has been reported.22 However, the property of hyperthermia mediated by MLPNs is not well understood. It is very interesting to study if those MLPNs can be used as magnetic hyperthermia agents and how the loading ratio and particle size affect the hyperthermia performance.Previous studies of hyperthermia agents mainly focused on designing and optimizing the size, composition and surface coating of magnetic nanoparticles to maximize the specific absorption rate (SAR) of the magnetic hyperthermia agent. A high SAR has been reported for magnetic nanoparticles with a high value of magnetization.8,23 However, one of the critical challenges in future clinical applications of magnetic hyperthermia is to address the issues of biokinetics, biodistribution and biodegradation of hyperthermia agents in the body and at the same time retain a high SAR. For example, preferential interactions with malignant cells are always desirable for nanoparticles injected into the tumors.24 In addition, aggregation of some degree, which could strongly affect the hyperthermia performance, is a common existence state for nanoparticles in a biosystem when attached to the surface or internalized into malignant cells.25 As illustrated by Fortin et al.,26 the intracellular nanoparticles generated less heat than those dispersed in water, which is attributed to the abrogation of the Brownian contribution to heat generation when the particles were confined within intracellular vesicles. Therefore, free-standing magnetic nanoparticles may suffer significant heat loss in tissue and cellular environments in the SAR compared to that in water solution due to remarkably reduced Brownian relaxation loss. In this context, MLPNs may provide a model system to study partial aggregation and offer a viable solution to overcome the drawbacks of small magnetic nanoparticles and meet the above demands for a non-changing SAR in a physiological environment.
In the present study, we construct uniform MnFe2O4-loaded polymer nanospheres as hyperthermia agents. The MnFe2O4 nanoparticles are embedded within the amphiphilic copolymer (PBMA-g-C12) through a previously established mini-emulsion method.21 By varying the concentration of MnFe2O4 nanoparticles in the mini-emulsion system, the amounts of magnetic nanoparticles encapsulated in the spherical matrix could be controlled. The crystal structure, morphology and magnetic properties of all the samples as well as the colloidal stability of dispersions are characterized. The dependence of the measured SAR on different loading ratios and varied sizes of loaded magnetic nanoparticles for MLPNs is systematically investigated. In order to demonstrate the potential of MLPNs as ideal mediators for magnetic hyperthermia in biological applications, MLPNs are dispersed within the agarose gel, which served as a tissue-equivalent phantom.27 The inductive heating properties in agarose gel phantom systems are also systematically studied. The goal of this study is to gain insight into the effect of loading ratio and the interplay of different sized nanoparticles in MLPNs on the SAR as well as provide a general approach to optimize MLPNs for retaining high performance hyperthermia treatment in a physiological simulated environment for future clinical applications.
Experimental section
Chemicals
Poly(isobutylene-alt-maleic anhydride) (PBMA; Mw = 6000, 85%), 1-dodecylamine (98%), poly(vinyl alcohol) (PVA; average Mw 31![[thin space (1/6-em)]](https://www.rsc.org/images/entities/char_2009.gif) 000–50
000–50![[thin space (1/6-em)]](https://www.rsc.org/images/entities/char_2009.gif) 000, 87–89% hydrolyzed), 1,2-hexadecanediol (70%), manganese(II) acetylacetonate (Mn(acac)2), benzyl ether (99%), and tetrahydrofuran (THF; 99.9%) were obtained from Aldrich. Iron(III) acetylacetonate (Fe(acac)3; 97.9%), oleic acid, and oleylamine (70%) were purchased from Fluka. Hexane (J.T. Baker, 99.0%) and chloroform (Fisher Scientific; 99.99%) were used as received.
000, 87–89% hydrolyzed), 1,2-hexadecanediol (70%), manganese(II) acetylacetonate (Mn(acac)2), benzyl ether (99%), and tetrahydrofuran (THF; 99.9%) were obtained from Aldrich. Iron(III) acetylacetonate (Fe(acac)3; 97.9%), oleic acid, and oleylamine (70%) were purchased from Fluka. Hexane (J.T. Baker, 99.0%) and chloroform (Fisher Scientific; 99.99%) were used as received.
Synthesis of PBMA-g-C12
To synthesize the amphiphilic copolymer, the pre-polymer PBMA was grafted with 1-dodecylamine (C12) as reported previously.28,29 Briefly, in a cap-sealed conical flask, PBMA (1 g, 6.5 mmol anhydride) and 1-dodecylamine (0.9 g, 75 mol% anhydride) were mixed in THF (15 mL). The reaction flask was then heated to 50 °C and the reaction mixture turned to a clear yellow solution. The mixture was incubated overnight at 50 °C to ensure a complete reaction. The final product was extracted by solvent evaporation and then dried in vacuo at room temperature for 2 days to obtain yellow powder.Synthesis of MnFe2O4 nanoparticles
The synthesis of MnFe2O4 nanoparticles followed closely to the procedures as reported in our previous publication with slight modifications.30 Mono-dispersed MnFe2O4 nanoparticles (average particle diameter: 6 nm) were synthesized in a one-pot reaction by the following formulation: Fe(acac)3 (8 mmol), Mn(acac)2 (4 mmol), oleic acid (40 mmol), and benzyl ether (50 mL) were charged into a three-neck round bottom flask. The temperature was slowly raised from room temperature to 165 °C and maintained isothermally for 30 min. The reaction flask was then quickly heated to 280 °C. Finally, the reaction mixture was refluxed at 280 °C for 30 min to allow the nanocrystals to grow. The resulting black mixture was cooled and washed by repeated dispersion and precipitation using hexane and ethanol, respectively. The final product was dispersed completely in chloroform (50 mg mL−1) and the resultant ferrofluid was stored in a sealed glass vial.18 nm MnFe2O4 nanoparticles were synthesized by the following formulation: Fe(acac)3 (8 mmol), Mn(acac)2 (4 mmol), oleic acid (28 mmol), and benzyl ether (35 mL) were charged into a three-neck round bottom flask. The temperature was slowly raised from room temperature to 165 °C and maintained isothermally for 30 min. The reaction flask was then quickly heated to 280 °C. Finally, the reaction mixture was refluxed at 280 °C for 30 min to allow the nanocrystals to grow. The resulting black mixture was cooled to room temperature. Following the purification and extraction procedures described in the synthesis of 6 nm MnFe2O4 nanoparticles, a black-brown chloroform dispersion of 18 nm MnFe2O4 nanoparticles was produced.
Synthesis of MLPNs with different loading ratios of MnFe2O4 nanoparticles
The formation of MLPNs was achieved by the combination of mini-emulsion and solvent evaporation techniques as reported previously.22 Individual stock solutions of PBMA-g-C12 and magnetic nanoparticles were first dissolved in chloroform and the organic phase was prepared by mixing the two solutions with different ratios. To make a mini-emulsion, the organic phase was poured into the aqueous phase (10× vol excess, 1 wt% PVA as stabilizer) and the emulsion can be formed by using an ultrasonic homogenizer (SONICS VCX 130 PB) at 20 kHz frequency and 60% amplitude for 5 min. The emulsion was then heated at 50 °C in an open glass beaker under rapid stirring to allow chloroform evaporation. All the samples reported here were prepared with a fixed amount of polymer stock solution (0.5 mL, 20 mg mL−1), while varying the amount of magnetic nanoparticles (10 mg for high loading and 1 mg for low loading). The as-prepared colloids firstly underwent centrifugation at 2000 rpm for 10 min to remove unusually large aggregates. The colloids were then purified by centrifugation at 8000 rpm for 10 min for complete separation of MLPNs, which were then redispersed in water–methanol (50![[thin space (1/6-em)]](https://www.rsc.org/images/entities/char_2009.gif) :
:![[thin space (1/6-em)]](https://www.rsc.org/images/entities/char_2009.gif) 50). Purification was repeated at least twice before the MLPNs were finally redispersed in water or appropriate aqueous medium.
50). Purification was repeated at least twice before the MLPNs were finally redispersed in water or appropriate aqueous medium.
Phase transfer of hydrophobic MnFe2O4 nanoparticles
Monodispersed hydrophilic magnetic nanoparticles were prepared as control by using the same polymer. To achieve this, a large surfactant/nanoparticle ratio was used to avoid the aggregation of the magnetic nanoparticles. In a typical process, MnFe2O4 nanoparticles (5 mg) and PBMA-g-C12 (25 mg) were dispersed in chloroform (1 mL). The solvent was evaporated and then dried in vacuo for 2 days to obtain a completely dried MnFe2O4 nanoparticle/polymer composite film. The film could be re-dissolved in water (5 mL) through the coordination of the amphiphilic copolymer around the hydrophobic MnFe2O4 nanoparticles to form stable colloids. To attain complete dispersion of the MnFe2O4 nanoparticles, 1 mL of aqueous sodium hydroxide (0.1 M) was added. Sodium hydroxide acted as an effective hydrolyzing agent to solubilize the excess surfactants and break up any aggregation caused by excess surfactants. The product was a clear colloid solution of MnFe2O4 nanoparticles. The particles were purified by dialyzing against Millipore water for 3 days in a dialysis sac (molecular weight cut-off = 12 kDa).Characterizations
Magnetic properties of MLPNs and magnetic nanoparticles were characterized using a LakeShore Model 7407 vibrating sample magnetometer (VSM) at room temperature and a superconducting quantum interference device (SQUID) magnetometer at temperatures ranging from 5 K to 300 K. The loading ratio of magnetic nanoparticles within MLPNs was determined using a thermogravimetric analysis (TGA) SDTQ600 instrument. The crystal phase was verified by X-ray diffraction (XRD) patterns recorded on a powder diffractometer (Bruker D8 Advanced Diffractometer System) with a Cu Kα (1.5418 Å) source. The morphology of MLPNs was observed under a scanning electron microscope (SEM) (Zeiss Supra 40) and a transmission electron microscope (TEM) (JEOL 100CX). Fe and Mn concentrations of hyperthermia samples were determined by inductively coupled plasma (ICP) analysis using a Perkin-Elmer Dualview Optima 5300 DV ICP-OES system. Dynamic light scattering (DLS) measurements were performed in a Malvern Zetasizer Nano-ZS device to determine the hydrodynamic size of samples in a colloidal suspension. Samples were equilibrated at 37 °C for 1 min before measurement and 5 sets of measurements were taken.In vitro hyperthermia
MLPNs and MnFe2O4 nanoparticles were dispersed in water or in 5% agarose gel. Plastic bottles containing 1 mL samples with concentration of 0.3 mg mL−1 MnFe2O4 and thermally insulated with ceramic wool were placed within a six-loop water-cooled copper coil driven by an Inductelec A.C. generator (Sheffield, UK). The applied frequency was 435 kHz and the heating behaviour of the samples was studied at a field strength (H0) of 4 kA m−1. The ambient temperature was around 30 °C. A LuxtronMD600 fiber optic thermometry unit connected to a computer was used to measure the samples’ temperature. The specific absorption rate (SAR) of samples was calculated from the following equation.8 | (1) |
Cytotoxicity assay
NIH3T3 cells were routinely cultured in DMEM (Dulbecco's Modified Eagle Medium) supplemented with 10% fetal calf serum in a 5% CO2 atmosphere at 37 °C. Cells in exponential phase were seeded into a 96-well plate (TPP) at a concentration of 8000 cells per well and were allowed to grow for another 24 h. 20 μL magnetic suspensions with various MnFe2O4 concentrations (0.1 to 200 μg mL−1) were added to each well. After 24 h co-incubation, CCK-8 (10 μL) was added to each well and the 96-well plate was further incubated for 4 h before the absorbance readings, which were conducted at 450 nm using a FluoStar Optima microplate reader.Statistical analysis
The One-way ANOVA with Tukey's post-hoc test was used to analyze the difference between three groups, using Graph Pad Prism Version 5.0 (GraphPad Software). Data are reported as mean values ± SEM. A P value of less than 0.05 was considered statistically significant.Results and discussion
Synthesis and characterizations of MLPNs
MnFe2O4 nanoparticles (NPs) with different sizes were first synthesized using Mn(acac)2 and Fe(acac)3 as metal precursors.30 In this work, we first choose MnFe2O4 NPs instead of widely used Fe3O4 nanoparticles because of their higher magnetization (approximate magnetic spins of 5 μB per MnFe2O4 formula while Fe3O4 has magnetic spins of 4 μB per chemical formula) and reduced magnetocrystalline anisotropy,35 which are favorable for higher susceptibility and therefore for enhanced magnetic hyperthermia performance. The as-synthesized MnFe2O4 NPs were completely dispersed in hexane or other non-polar solvents to form a perfect ferrofluid. TEM images in Fig. 1a and b clearly show the MnFe2O4 NPs with a mean size of 6.0 ± 1.1 nm and 18.0 ± 0.9 nm, respectively. The particles are highly uniform in morphology and size. It should be noted that the octahedron geometry of 18 nm MnFe2O4 NPs is transformed into a nearly spherical shape when the particle size decreases to 6 nm due to minimization of surface energy. The crystal structure of the MnFe2O4 NPs was identified by using XRD (Fig.1c). All diffraction peaks can be exclusively indexed as cubic spinel MnFe2O4 (JCPDS no. 10-0319), indicating the high crystallinity. As compared to 18 nm MnFe2O4 NPs, the broadening of XRD peaks is observed for 6 nm MnFe2O4 NPs due to the finite size effect. The mean crystallite size estimated on the basis of the most intense peak of the XRD pattern using the Scherrer equation is about 5.58 nm and 17.03 nm for 6 nm and 18 nm MnFe2O4 NPs, which is consistent with the observation under a TEM.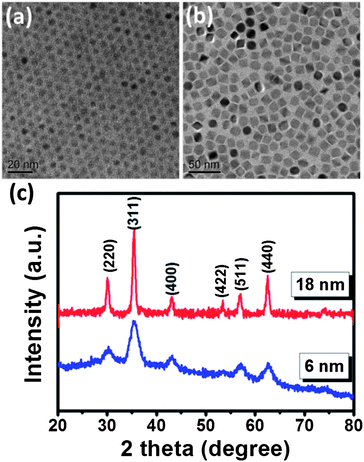 | ||
| Fig. 1 TEM image of (a) 6 nm MnFe2O4 NPs and (b) 18 nm MnFe2O4 NPs; (c) XRD profile of both MnFe2O4 NPs. | ||
Scheme 1 illustrates the formation of MLPNs via the mini-emulsion technique. In this process, the polymer PBMA-g-C12 and MnFe2O4 NPs condense into a tight spherical cluster with the evaporation of the organic solvent. The MnFe2O4 NPs are bound together primarily via strong interdigitated hydrophobic interactions between the tight hydrophobic brushes of PBMA-g-C12 and the oleic acid ligands of MnFe2O4 NPs. By varying the ratios of MnFe2O4 NPs in the mini-emulsion system, controlled amounts of MnFe2O4 NPs could be loaded in the matrix. Herein, according to their varied MnFe2O4 NPs' content and size, MLPNs are labeled as MLPNs 1 (high-content (6 nm)), MLPNs 2 (low-content (6 nm)), MLPNs 3 (high-content (18 nm)), and MLPNs 4 (low-content (18 nm)).
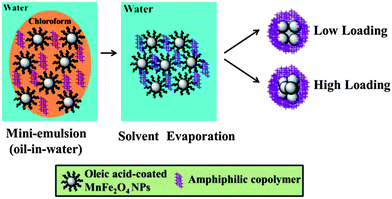 | ||
| Scheme 1 Schematic diagram illustrating the formation of water dispersed MLPNs with different contents through the oil-in-water mini emulsion/solvent evaporation process. | ||
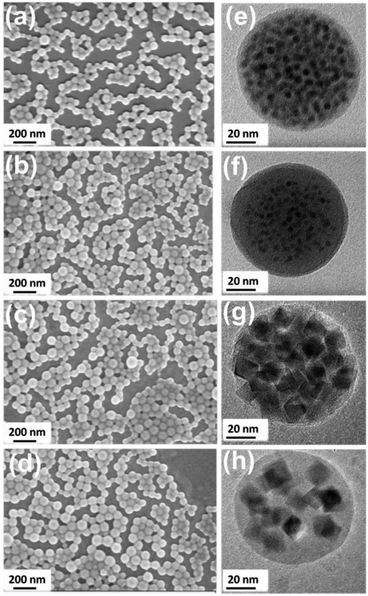
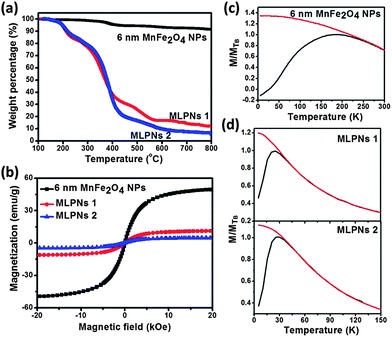
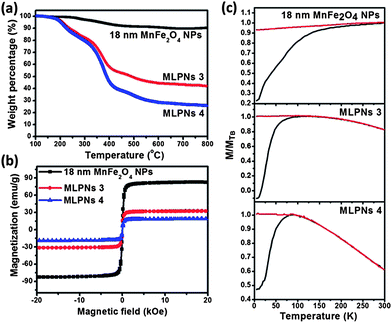
SEM images in Fig. 2a–d show that monodispersed spherical MLPNs with excellent size uniformity are achieved. Regardless of the loading amount and the size of MnFe2O4 NPs loaded, all the MLPNs show an average size of around 80 nm by controlling the emulsion conditions. More importantly, MnFe2O4 NP agglomeration is prevented as the particles are dispersed uniformly throughout the entire matrix. As confirmed by the TEM images, both 6 nm and 18 nm MnFe2O4 NPs are dispersed and embedded within the spherical matrix. Estimations of intra-particle distance dsep (see ESI S1† for details of calculation) of MnFe2O4 NPs within MLPNs were calculated using the TGA data (in Fig. 3a and 4a) and the results are shown in Table 1. The dsep values from Table 1 agreed well with those that are observed in the TEM images, as it could be seen that dsep of the high-content MLPNs is much lower than that of the low-content ones. Moreover, regardless of the size of the loaded MnFe2O4 NPs, similar dsep values are noticed for both MLPNs corresponding to high-content and low-content.
| Hydrodynamic size (nm) | d sep (nm) | M s (emu g−1) | V MNP/VMNC | Calculated SAR | SAR (W g−1) | |
|---|---|---|---|---|---|---|
| 6 nm MnFe2O4 NPs | 13 | — | 49 | — | — | 83 |
| MLPNs 1 | 100 | 9.2 | 11 | 0.04 | 27 | 7 |
| MLPNs 2 | 105 | 14.6 | 5 | 0.02 | 7 | 4 |
| 18 nm MnFe2O4 NPs | 28 | — | 83 | — | — | 580 |
| MLPNs 3 | 101 | 8.6 | 32 | 0.24 | 43 | 102 |
| MLPNs 4 | 106 | 15.2 | 19 | 0.12 | 537 | 332 |
The weight loss below 200 °C, as illustrated in Fig. 3a and 4a, is attributed to the evaporation of the absorbed water. The weight loss at around 200 °C and 600 °C of the MnFe2O4 NPs and MLPNs may account for the mass loss of oleic acid and PBMA-g-C12 on the sample surface. It is obvious to note that the high-content of nanoparticles in MLPNs (MLPNs 1 and MLPNs 3) would result in less mass loss due to lower polymer mass ratios within the MLPNs. The observations prove that the nanoparticle-content within the MLPNs can be controlled by simply varying the loaded MnFe2O4 NPs during the emulsion process. Fig. 3a and 4a also indicate that weight loss is higher for the MLPNs loaded with 6 nm MnFe2O4 NPs than those loaded with 18 nm MnFe2O4 NPs. Estimations of the volume fraction (VMNP/VMNC) of MnFe2O4 NPs inside a MLPN (see ESI S1† for details of calculation) were calculated using the TGA data (in Fig. 3a and 4a) and the results are shown in Table 1. It could be seen that VMNP/VMNC of the high-content MLPNs is much higher than that of the low-content ones. Moreover, VMNP/VMNC is higher for the MLPNs loaded with 18 nm MnFe2O4 NPs than that of the MLPNs loaded with 6 nm MnFe2O4 NPs. This can be explained by the larger surface to volume ratio for the 6 nm sized samples.
The magnetic properties of MLPNs and MnFe2O4 NPs were evaluated by field-dependent magnetization M–H measurements at 300 K using a VSM. As shown in Fig.3b, MLPNs 1 and MLPNs 2 show the superparamagnetic behavior similar to that of 6 nm MnFe2O4 NPs despite the large size of 80 nm for MLPNs. The saturation magnetization, Ms (in emu per gram), dropped down from 49 to 11 emu g−1 (for MLPNs 1) and to 5 emu g−1 (for MLPNs 2). Similarly, for 18 nm MLPNs as observed from Fig.4b, Ms dramatically decreases after mini-emulsion and further decreases with fewer magnetic nanoparticles loaded. The decreased Ms (magnetic moment per weight unit) attributes to the decreased effective weight fraction of the magnetic core. The dependence of Ms on the loading ratio is plotted against MnFe2O4 NP loading in Fig. S2.† The results show a linear relationship with an R2 value of 0.99 for both 6 and 18 nm particles. The MLPNs loaded with 18 nm MnFe2O4 NPs also show no hysteresis. The temperature-dependent field cooling (FC) and zero-field cooling (ZFC) magnetization are further measured for all the samples by using a superconducting quantum interference device (SQUID) with the temperature ranging from 5 K to 300 K. The ferromagnetic–superparamagnetic transition temperature, TB, is taken as the point of divergence between the FC and ZFC curves, below which the particles are no longer superparamagnetic. In the ZFC/FC curves in Fig. 3 for 6 nm samples, both MLPN samples (MLPNs 1 and 2) [MnFe2O4 NPs embedded in the polymer matrix] have a blocking temperature of approximately 25 K (TB, ∼25 K). This value corresponds well to a small number of MnFe2O4 NPs (6 nm) with low magnetocrystalline anisotropy. In contrast, the bare MnFe2O4 NPs possessed a much higher blocking temperature of TB = ∼183 K. The possible reason is that the severe agglomeration after drying led to enhancement due to strong particulate interactions. As illustrated in Fig. 4c, the TB values of MnFe2O4 NPs, MLPNs 3 (high-content) and MLPNs 4 (low-content) are determined to be approximately 300 K, 148 K and 95 K, respectively. The high blocking temperature of 300 K of dried magnetic particles also indicated a strong particulate interaction. The depression of TB when the MnFe2O4 NPs are encapsulated into the polymeric nanospheres to form MLPNs provided evidence that the dipole–dipole interaction between the MnFe2O4 NPs is reduced. TB decreased even more when the loading density of MnFe2O4 NPs is reduced. The results suggest that the polymer matrix could be seen here as being effective at isolating magnetic particles, thus reducing the magnetic interactions.
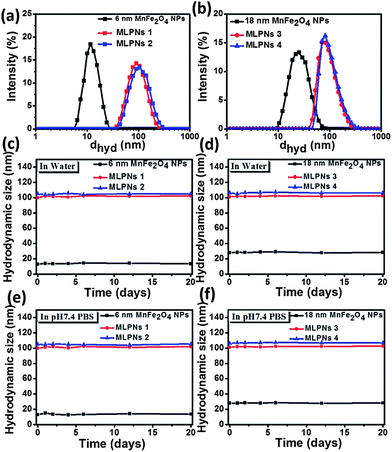
Since the dispersibility and colloidal stability of magnetic samples play an important role in magnetic hyperthermia treatment, the stability of MLPNs was examined using DLS. Fig. 5a and b show the hydrodynamic size of 6 nm and 18 nm samples dispersed in water, respectively. The average sizes of the samples are summarized in Table 1. The measured hydrodynamic size in aqueous solution is larger than that of TEM observations. Such a difference obtained by DLS and TEM is commonly observed.36 The larger colloidal particle size in the aqueous dispersion than in the dry state or in the non-polar organic dispersion is essentially due to the highly hydrated ligand and surface molecule layer on the nanoparticles. All the polar functional groups are capable of forming hydrogen bonds with the solvent water molecules or being solvated by water molecules through polar interaction causing extensive hydration of the nanoparticles. Thus, the average diameters of the samples obtained by the DLS measurements are higher than those obtained by the TEM measurements. DLS results show that MLPNs are homogeneously dispersed. The hydrodynamic sizes of 6 nm and 18 nm MnFe2O4 NPs are 13 nm and 28 nm, respectively. For all the MLPNs, the hydrodynamic size is close to 100 nm and no obvious difference despite the varied loaded content and size. The colloidal stability of MLPNs is further tested in PBS solution. No observable aggregation and change in size in PBS is observed. The results from stability studies indicate that all the MLPNs exhibit excellent colloidal stability in both water and PBS (Fig. 5c–f) after 20 days of incubation at 37 °C. Such excellent stability of MLPN dispersions makes them suitable for biomedical applications.
Magnetic hyperthermia
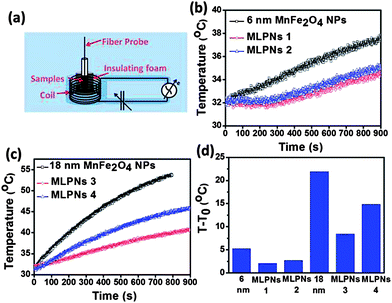
In order to assess the efficacy of MLPNs as hyperthermia mediators, magnetic heating characterization is carried out using an induction heating system. Fig. 6a shows the experimental setup for calorimetric measurements. As shown in Fig. 6b, 6 nm MnFe2O4 NPs or MLPNs reveal a rather slower temperature rising profile. Though 6 nm MnFe2O4 NPs possess the best inductive heating characteristics among the three samples under investigation, within the observed time period of 800 s, only a 5 °C temperature increase is noticed. However, larger MnFe2O4 NPs may have a better inductive heating property than the smaller ones. As demonstrated in Fig.6c, 18 nm MnFe2O4 NPs, whether free or loaded within MLPNs, may induce a more remarkable temperature increase under the same AMF parameters. As shown in Fig.6d, the raised temperature within the hyperthermia time period of 800 s is approximately 23 °C for 18 nm MnFe2O4 NPs, 7 °C for MLPNs 3 (high-content (18 nm)) and 15 °C for MLPNs 4 (low-content (18 nm)). We can conclude that bare MnFe2O4 NPs have better inductive heating property than those when formulated in MLPNs. It is also worth noting that MLPNs with low-content have better heating property than the high-content ones.In the finite-size nanoparticle system, the heat generated by magnetic fluids under an AMF is mainly attributed to two contributions: hystersis loss and Néel–Brownian relaxation losses.37 Because the magnetic field is relatively low, there is no remanence of these samples. Herein we will just consider the contribution of Néel and Brownian relaxation on heat. Heat generation through Néel relaxation is due to rapidly occurring changes in the direction of magnetic moments relative to the crystal lattice (internal dynamics). This is hindered by anisotropy energy that tends to orient the magnetic domain in a given direction relative to the crystal lattice. Brownian relaxation is attributed to physical rotation of particles within a medium in which they are placed (external dynamics) and is hindered by the viscosity that tends to counter the movement of particles in the medium. Their characteristic relaxation times are given below:
 | (2) |
 | (3) |
 | (4) |
Generally, for a certain magnetic nanoparticle, the measured SAR depends on the parameters of magnetic nanoparticles (size, shape, crystal structure, saturation magnetization, and magnetic susceptibility) as well as field strength (H) and frequency (f) of the AMF, according to eqn (1) (ref. 38)
 | (5) |
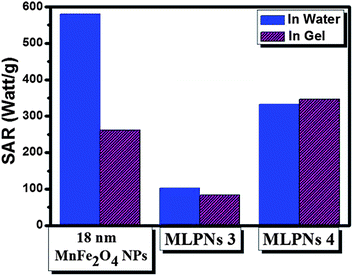
The measured SAR values of samples are summarized in Table 1. As can be seen in Table 1, the 18 nm samples consistently exhibit a higher SAR than the 6 nm samples with the highest SAR of 580 W g−1 by 18 nm MnFe2O4 NPs and 332 W g−1 for MLPNs 4 (low-content (18 nm)). In addition, the SAR value for MLPNs 4 is around 2.25-fold higher than that of MLPNs 3 (low-content (18 nm)), although the latter exhibits larger Ms.
From eqn (5), the samples with high Ms will lead to a high SAR at a certain external AMF. As Ms decreases with decreasing size, the 6 nm samples with smaller Ms values are expected to exhibit a lower SAR. This is consistent with our observation that both 6 nm MnFe2O4 NPs and 6 nm MnFe2O4-loaded MLPNs show a smaller SAR as compared to the 18 nm samples. Moreover, for 6 nm MLPNs, the SAR increased with increasing loading ratio, the SAR for MLPNs 1 is 7 W g−1, a little higher than that of MLPNs 2, which may also be due to a higher Ms for MLPNs 1.
An interesting observation has been found about the SAR for 18 nm MnFe2O4-loaded MLPNs. The SAR for MLPNs 4 (low-content (18 nm)) is 330 W g−1 and almost 2.25-fold higher than that of MLPNs 3 (high-content (18 nm)), although the latter exhibits larger Ms. The high SAR of low-content MLPNs may be ascribed to a relatively lower magnetic nanoparticle-interaction due to a large amount of polymer fully isolating the MnFe2O4 NPs, which is confirmed by dsep and TB data. High-content MLPNs possessing stronger magnetic particle-interactions may result in the decrease of contribution of both Néel and Brownian relaxation losses on heat, which leads to a lower SAR.39
To confirm our results, we calculate the theoretical SAR of all samples by using eqn (2)–(5), as presented in Table 1. It can be seen that the trend of SAR for 6 nm MLPNs and 18 nm MLPNs is different, but both are the same as the experimental results. For 6 nm samples, the SAR is proportional to Ms, a higher SAR is attributed to a higher Ms. For 18 nm MLPNs, the calculated theoretical SAR for MLPNs 4 is 11-fold higher than that of MLPNs 3.
To better understand the inductive heating property of the MnFe2O4 NPs and MLPNs in a physiological environment, 18 nm MnFe2O4 NPs and MnFe2O4-loaded MLPNs were dispersed in 5% agarose gel, which is used to simulate the in vivo environment of animal tissue phantoms.27Fig. 7 compares the SAR of 18 nm MnFe2O4 NPs and MLPNs with different loading contents in 5% agarose gel. Previous experimental evidence has shown that the Brownian loss could contribute to ∼53% of total heating capacity for a finite sized magnetite nanoparticle dispersion,40,41 which is similar to our results with 18 nm MnFe2O4 NPs after being dispersed in the agarose gel because the agarose gel fixation prevented any Brown relaxation loss. It is further confirmed by the evidence that the SAR for MLPNs 4 (low-content (18 nm)) does not change after being dispersed in the agarose gel. In other words, the heating capacity of low-content MLPNs will not be influenced by physiological environments. We can think that the magnetic loss of MLPNs may be mainly attributed to Néel loss. When MnFe2O4 NPs are embedded in a polymer matrix with a low loading, the high viscosity of the polymer matrix does not allow Brownian motion of MnFe2O4 NPs inside the polymer matrix. The MLPNs have a much larger hydrodynamic size (over 100 nm, as shown in Table 1). We should not expect fast Brownian relaxation of such big spheres. Therefore, the SAR of MLPNs in the agarose gel is similar to that of MLPNs in water, as the Néel contribution is the dominant mechanism.
Overall, the heating capacity of low-content MnFe2O4-loaded MLPNs will not be influenced substantially by physiological environments. We can think that the magnetic loss of MnFe2O4-loaded MLPNs is mainly attributed to Néel loss. Though further in vivo studies are necessary, currently available results have demonstrated that the low-content MnFe2O4 (18 nm)-loaded MLPN dispersion could exhibit better heating capacity in physiological environments.
In vitro cell cytotoxicity assay
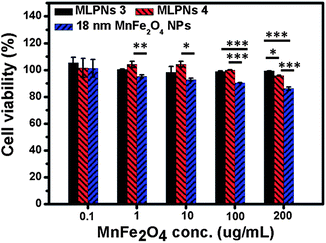
Since the hyperthermia agents would eventually be applied in vivo or in clinical, it is very important to evaluate the biocompatibility for the potential hyperthermia agents. The cell viabilities are determined after a 24 h co-incubation with fibroblast NIH3T3 cells. From Fig. 8, we can see that18 nm MnFe2O4 NPs induce a cytotoxic effect in NIH3T3 cells at a concentration of 200 μg mL−1 MnFe2O4. It can also be seen that MLPNs do not induce a notable cytotoxic effect within a concentration of 0.1 μg mL−1 to 200 μg mL−1 MnFe2O4. This means that MLPNs clearly exhibit higher biocompatibility than bare MnFe2O4 NPs, especially at high concentration. These results suggest that the MLPNs are excellent candidates for various biomedical applications such as hyperthermia treatment.Conclusions
In summary, the uniform MLPNs with a controlled loading ratio and loaded MnFe2O4 NPs of different sizes were synthesized. The effects of MLPNs with varied loading ratios and sizes on the SAR have been studied under an AMF (4 kA m−1; 435 kHz). The results indicate that MLPNs loaded with large sized MnFe2O4 NPs have a better inductive heating property than the ones with small sized MnFe2O4 NPs because of the increased magnetic core size and larger Ms. Moreover, the loading ratios of MLPNs play an important role in the obtained SAR. The effect of loading content on the SAR is different between small-size and large-size MnFe2O4 nanoparticles loaded. For 6 nm loaded MLPNs, the SAR is increased as Ms increased. But for 18 nm loaded MLPNs, low-content MLPNs show a higher SAR than the high-content MLPNs. In particular, the SAR for low-content (18 nm) MLPNs is almost 2.25-fold higher than that of the high-content one, although the latter has an Ms 2-fold larger than its low-content counterpart. This is quite different from the design of MLPNs for MRI contrast agents while large Ms is favoured to high T2 relaxivity. This high SAR may be ascribed to a relatively lower magnetic nanoparticle-interaction in low-content MLPNs due to a large amount of polymer fully isolating the larger MnFe2O4 NPs. This is confirmed from dsep and TB data, which suggest that the polymer matrix could be seen as being effective at isolating magnetic particles and reducing the magnetic interactions. The theoretical calculation indicates that the trend of SAR is the same as the experimental results. In addition, the SAR of low-content (18 nm) MLPNs in the agarose gel is the highest among the samples and does not change substantially in physiological environments, which is crucial for medical translation from bench to bed. In vitro cytotoxicity tests further demonstrate the good biocompatibility of the obtained MLPNs. The findings obtained in this work provide a profound and meaningful understanding of the use of MLPNs for magnetic hyperthermia treatment and pave the way for using such kind of MLPNs for future clinical applications.Acknowledgements
This work was financially supported by the National Natural Science Foundation of China (Grant no. 21006079 and 21376192), the Research Fund for the Doctoral Program of Higher Education China (Grant no. 20126101110017), MOE AcRF Tier 2-MOE2011-T2-1-043 and A-Star SERC 1321202068. Authors thank Dr Jia-Bao Yi (School of Materials Science and Engineering, University of New South Wales, Kensington, NSW, 2052, Australia) for discussion and manuscript revision.Notes and references
- L. A. Thomas, L. Dekker, M. Kallumadil, P. Southern, M. Wilson, S. P. Nair, Q. A. Pankhurst and I. P. Parkin, J. Mater. Chem., 2009, 19, 6529–6535 RSC.
- E. Natividad, M. Castro, G. Goglio, I. Andreu, R. Epherre, E. Duguet and A. Mediano, Nanoscale, 2012, 4, 3954–3962 RSC.
- J. H. Lee, J. T. Jang, J. S. Choi, S. H. Moon, S. H. Noh, J. W. Kim, J. G. Kim and J. Cheon, Nat. Nanotechnol., 2011, 6, 418–422 CrossRef CAS PubMed.
- H. M. Fan, M. Olivo, B. Shuter, J. B. Yi, R. Bhuvaneswari, H. R. Tan, G. C. Xing, C. T. Ng, L. Lei, S. S. Lucky, B. H. Bay and J. Ding, J. Am. Chem. Soc., 2010, 132, 14803–14811 CrossRef CAS PubMed.
- S. D. Kong, W. Z. Zhang, J. H. Lee, K. Brammer, R. Lal, M. Karin and S. Jin, Nano Lett., 2010, 10, 5088–5092 CrossRef CAS PubMed.
- E. Amstad, J. Kohlbrecher, E. Müller, T. Schweizer, M. Textor and E. Reimhult, Nano Lett., 2011, 11, 1664–1670 CrossRef CAS PubMed.
- Z. H. Lu, M. D. Poruty and Z. H. Gao, Langmuir, 2005, 21, 2042–2050 CrossRef CAS PubMed.
- X. L. Liu, H. M. Fan, J. B. Yi and J. Ding, J. Mater. Chem., 2012, 22, 8235–8244 RSC.
- S. Purushotham and R. V. Ramanujan, J. Appl. Phys., 2010, 107, 114701 CrossRef.
- S. Purushotham, P. E. J. Chang, S. Purushotham, H. Rumpel, I. H. C. Kee, R. T. H. Ng, P. K. H. Chow, C. K. Tan and R. V. Ramanujan, Nanotechnology, 2009, 20, 305101 CrossRef CAS PubMed.
- R. Hergt, R. Hiergeist and M. Zeisberger, et al. , J. Magn. Magn. Mater., 2004, 280, 358 CrossRef CAS PubMed.
- A. P. Khandhar, R. M. Ferguson and K. M. Krishnan, J. Appl. Phys., 2011, 109, 07B310 CrossRef PubMed.
- M. Ma, Y. Wu, J. Zhou, Y. K. Sun and Y. Zhang, J. Magn. Magn. Mater., 2004, 268, 33–39 CrossRef CAS.
- L. A. Thomas, L. Dekker, M. Kallumadil, P. Southern, M. Wilson, S. P. Nair, Q. Pankhurst and I. P. Parkin, J. Mater. Chem., 2009, 19, 6529–6535 RSC.
- U. Gaur, S. K. Sahoo, T. K. De, P. C. Ghosh, A. Maitra and P. K. Ghosh, Int. J. Pharm., 2000, 202, 1–10 CrossRef CAS.
- S. M. Moghimi, A. H. Hynter and J. C. Murray, Pharmacol. Rev., 2001, 53, 283–318 CAS.
- W. L. Monsky, D. Fukumura, T. Gohongi, M. Ancukiewcz, H. A. Weich and V. P. Torchilin, Cancer Res., 1999, 59, 4129–4135 CAS.
- M. S. Muthu and S. Singh, Nanomedicine, 2009, 4, 105–118 CrossRef CAS PubMed.
- K. Y. Win and S. S. Feng, Biomaterials, 2005, 26, 2713–2722 CrossRef CAS PubMed.
- G. Béalle, R. D. Corato and J. Kolosnjaj-Tabi, et al. , Langmuir, 2012, 28(32), 11834–11842 CrossRef PubMed.
- E. S. G. Choo, X. S. Tang, Y. Sheng and J. M. Xue, J. Mater. Chem., 2011, 21, 2310–2319 RSC.
- E. S. G. Choo, E. Peng, R. Rajendran, P. Chandrasekharan, C. T. Yang, J. Ding, K. H. Chuang and J. M. Xue, Adv. Funct. Mater., 2012, 23(4), 496–505 CrossRef.
- K. H. Bae, M. Park, M. J. Do, N. Lee, J. H. Ryu, G. W. Kim and T. Hyeon, ACS Nano, 2012, 6, 5266–5273 CrossRef CAS PubMed.
- A. Jordan, R. Scholz and P. Wust, et al. , J. Magn. Magn. Mater., 1999, 194, 185–196 CrossRef CAS.
- C. C. Berry and A. S. G. Curtis, J. Phys. D: Appl. Phys., 2003, 36, R198–R206 CrossRef CAS.
- J. P. Fortin, F. Gazeau and C. Wilhelm, Eur. Biophys. J., 2008, 37(2), 223–228 CrossRef CAS PubMed.
- M. Salloum, R. H. Ma, D. Weeks and L. Zhu, Int. J. Hyperthermia, 2008, 24(4), 337–345 CrossRef CAS PubMed.
- C. A. J. Lin, R. A. Sperling, J. K. Li, T. Y. Yang, P. Y. Li, M. Zanella, W. H. Chang and W. J. Parak, Small, 2008, 3, 334 CrossRef PubMed.
- T. Pellegrino, L. Manna and S. Kudera, et al. , Nano Lett., 2004, 4(4), 703–707 CrossRef CAS.
- L. Li, Y. Yang, J. Ding and J. M. Xue, Chem. Mater., 2010, 22, 3183 CrossRef CAS.
- H. W. Yang and S. Gunasekaran, J. Food Eng., 2004, 64(4), 445–453 CrossRef PubMed.
- O. Kaman, P. Veverka and Z. Jirák, et al. , J. Nanopart. Res., 2011, 13(3), 1237–1252 CrossRef CAS.
- E. Natividad, M. Castro and A. Mediano, J. Magn. Magn. Mater., 2009, 321(10), 1497–1500 CrossRef CAS PubMed.
- E. Natividad, M. Castro and A. Mediano, Appl. Phys. Lett., 2011, 98(24), 243119 CrossRef.
- J. H. Lee, Y. M. Huh and Y. Jun, et al. , Nat. Med., 2006, 13(1), 95–99 CrossRef PubMed.
- A. Bootz, V. Vogel, D. Schubert and J. Kreuter, Eur. J. Pharm. Biopharm., 2004, 57, 369–375 CrossRef CAS.
- H. Mamiya and B. Jeyadevan, Sci. Rep., 2011 DOI:10.1038/srep00157.
- R. E. Rosensweig, J. Magn. Magn. Mater., 2002, 252, 370–374 CrossRef CAS.
- H. E. Horng and S. Y. Yang, J. Korean Phys. Soc., 2006, 48, 999–1003 CAS.
- S. Chen, C. L. Chiang and S. C. Hsieh, J. Magn. Magn. Mater., 2010, 322, 247–252 CrossRef CAS PubMed.
- J. P. Fortin, C. Wilhelm and J. Servais, et al. , J. Am. Chem. Soc., 2007, 129(9), 2628–2635 CrossRef CAS PubMed.
Footnote |
| † Electronic supplementary information (ESI) available: Calculation of the intra-particle distance between MnFe2O4 nanoparticles loaded in the polymer; a plot of saturation magnetization against loading for MLPNs. See DOI: 10.1039/c3tb21146k |
| This journal is © The Royal Society of Chemistry 2014 |

