Quantitative serine protease assays based on formation of copper(II)–oligopeptide complexes†
Xiaokang
Ding
and
Kun-Lin
Yang
*
Department of Chemical and Biomolecular Engineering, National University of Singapore, 4 Engineering Drive 4, Singapore 117585, Singapore. E-mail: cheyk@nus.edu.sg; Tel: +65 6516 6614
First published on 30th October 2014
Abstract
A quantitative protease assay based on the formation of a copper–oligopeptide complex is developed. In this assay, when a tripeptide GGH fragment is cleaved from an oligopeptide chain by serine proteases, the tripeptide quickly forms a pink GGH/Cu2+ complex whose concentration can be determined quantitatively by using UV-Vis spectroscopy. Therefore, activities of serine proteases can be determined from the formation rate of the GGH/Cu2+ complex. This principle can be used to detect the presence of serine protease in a real-time manner, or measure proteolytic activities of serine protease cleaving different oligopeptide substrates. For example, by using this assay, we demonstrate that trypsin, a model serine protease, is able to cleave two oligopeptides GGGGKGGH (P1) and GGGGRGGH (P2). However, the specificity constant (kcat/Km) for P2 is higher than that of P1 (6.4 × 10³ mM−1 min−1vs. 1.3 × 10³ mM−1 min−1). This result shows that trypsin is more specific toward arginine (R) than lysine (K) in the oligopeptide sequence.
Introduction
Proteases are enzymes which can hydrolyze peptide bonds in proteins or peptides. They are very important in many biological processes such as food digestion, blood coagulation, and cell apoptosis.1–4 Past studies have shown that dysfunction of proteases may cause cardiovascular disease,5,6 metastatic cancer7–10 or Alzheimer disease.11 Despite their importance, it is often difficult to detect protease activity in a real-time and quantitative manner. This is because cleavage of proteins or peptides only leads to shorter oligopeptide fragments, and these fragments can only be differentiated based on their molecular weight or mobility. In the past, HPLC,12 gel electrophoresis13,14 or mass spectrometry15–18 was often employed in protease assays to detect oligopeptide fragments. However, these assays are only suitable for measurements of average protease activity because sampling of reaction mixtures cannot be done in real time.Alternatively, real-time protease assays can be achieved by using oligopeptide substrates labeled with a pair of fluorophore and quencher.19 After the cleavage of a labeled oligopeptide molecule, the fluorophore/quencher pair is separated from each other and the fluorescence intensity increases. However, this method requires labeling of the oligopeptide substrates, and the activity of the protease may be affected by the fluorophore or quencher. To avoid labeling of oligopeptide substrates, Li et al. developed a label-free fluorescent protease assay by using hemoglobin as a protease substrate. After protease cleavage of hemoglobin, a heme molecule is released to quench the fluorescence, and the protease activity can be correlated with the fluorescence intensity. Recently, gold nanoparticles (AuNPs) and their aggregates are also exploited for the development of protease assays.20–23 For example, Guarise et al.20 developed a serine protease assay by using cysteine-modified oligopeptides which cross-linked AuNPs. Once the oligopeptides were pretreated with a protease solution, the oligopeptides were cleaved into fragments. As a result, oligopeptides could not cross-link AuNPs and no color change was observed. However, this approach requires a two-stage exposure of oligopeptides to proteases and AuNPs separately. To address this problem, Laromaine et al.21 modified the oligopeptide with N-(fluorenyl-9-methoxycarbonyl) (Fmoc) to promote aggregation of AuNPs through π–π interactions. After the addition of a protease solution, Fmoc groups were removed and the aggregates of AuNPs broke apart due to electrostatic repulsion. However, it is difficult to quantify the degree of aggregation of AuNPs. Besides, AuNPs are susceptible to matrix proteins (such as human serum protein) which can induce or prevent AuNPs from forming aggregates.
In the past, binding of oligopeptides to metal ions have been exploited for the detection of metal ions because the binding of oligopeptides to metal ions is very specific. For example, Wu and Liu24 developed a fluorescent chemosensor by using a fluorescent-labeled tetrapeptide Fluor-HGGG to detect Cu2+ in aqueous solutions. However, to the best of our knowledge, the formation of an oligopeptide–metal ion complex has not been used in protease assays before. In this study, we used Cu2+ and a GGH-containing oligopeptide to develop a serine protease assay for measuring protease activity in real time. The detection principle is based on the formation of a pink GGH/Cu2+ complex during the cleavage of the oligopeptide. When the tripeptide GGH is cleaved from the oligopeptide substrate, it forms a pink complex with Cu2+ in the solution immediately. This metal complex absorbs visible light at 525 nm and its concentration can be determined quantitatively. Thus, the protease activity can be calculated by using the formation rate of the GGH/Cu2+ complex.
Experimental section
Materials
Oligopeptides GGGGKGGH (P1), GGGGRGGH (P2), GGGGFGGH (P3), GGGGWGGH (P4), and RKRIRRMMPRPS (P5) (purity >95%) were synthesized by GenicBio (China). Tripeptide glycyl-glycyl-histidine (GGH) was purchased from Bachem (Switzerland). Trypsin (from bovine pancreas, type II, activity, 14![[thin space (1/6-em)]](https://www.rsc.org/images/entities/char_2009.gif) 408 U mg−1), chymotrypsin (from bovine pancreas, type II, activity: 40 U mg−1), human serum (from human male AB plasma, U.S.A. origin), sodium carbonate anhydrous (99.5%), sodium sulfide nonahydrate (98%), benzamidine hydrochloride hydrate (99%), and copper(II) sulfate anhydrous (99.9%) were purchased from Sigma-Aldrich (U.S.A). Sodium chloride (99.8%) was purchased from GCE Laboratory Chemicals (Singapore). Calcium chloride dihydrate (99%) was purchased from Merck (Singapore). Tris buffer (1 M, pH 8.0) was purchased from 1st Base (Singapore) and used as received. Ultrapure water was obtained by using a water purification system from Millipore (U.S.A).
408 U mg−1), chymotrypsin (from bovine pancreas, type II, activity: 40 U mg−1), human serum (from human male AB plasma, U.S.A. origin), sodium carbonate anhydrous (99.5%), sodium sulfide nonahydrate (98%), benzamidine hydrochloride hydrate (99%), and copper(II) sulfate anhydrous (99.9%) were purchased from Sigma-Aldrich (U.S.A). Sodium chloride (99.8%) was purchased from GCE Laboratory Chemicals (Singapore). Calcium chloride dihydrate (99%) was purchased from Merck (Singapore). Tris buffer (1 M, pH 8.0) was purchased from 1st Base (Singapore) and used as received. Ultrapure water was obtained by using a water purification system from Millipore (U.S.A).
Protease assay
Trypsin was added to 400 μL of Tris buffer (50 mM, pH 8.0) containing 1.0 mM of copper(II) sulfate and 1.0 mM of P1. The final concentrations of trypsin were between 0 and 400 nM. These solutions were incubated at 37 °C in a thermo-mixer (Eppendorf, Germany). After 2 h, visible spectra of the solutions were recorded by using a UV-Vis spectrometer (Cary 50, Varian) equipped with a temperature controlling system. To measure protease activities, buffer solutions containing 160 nM of trypsin (or 4 μM of chymotrypsin), 1.0 mM of copper(II) sulfate, and different concentrations of oligopeptides were prepared. Subsequently, visible absorption spectra were recorded every 5 min at 37 °C. The reaction rate (v) was determined by using the slope of the GGH concentration versus the reaction time. The Michaelis constant (Km) and maximum reaction rate (vmax) were determined by using a Lineweaver–Burk plot, and the turnover number (kcat) was determined by using kcat = vmax/[E]0, where [E]0 is the protease concentration. For protease assay in serum solution, 1 mL of human serum was added into 20 mL of Tris buffer (50 mM, pH 8.0) as a serum solution. Then, 400 μL of the serum solution was spiked with 1.0 mM of copper(II) sulfate, 1.0 mM of P1 and different concentrations of trypsin (0, 200, 400, and 600 nM). After incubation at 37 °C for 2 h, images were taken by using a digital camera.Inhibition assay
Tris buffer (50 mM, pH 8.0) containing 480 nM of trypsin was mixed with different amounts of benzamidine hydrochloride (BH). After incubation at 4 °C for 30 min, 120 μL of the above solution was mixed with 120 μL of copper(II) sulfate solution (3.0 mM) and 120 μL of P1 solution (3.0 mM). The final concentrations of copper(II) sulfate, P1, and trypsin were 1.0 mM, 1.0 mM, and 160 nM, respectively. The mixed solution was incubated at 37 °C for 2 h. The inhibition efficiency (IE) of BH was determined by using the following equation: | (1) |
![[thin space (1/6-em)]](https://www.rsc.org/images/entities/char_2009.gif) :
:![[thin space (1/6-em)]](https://www.rsc.org/images/entities/char_2009.gif) 1.
1.
Results and discussion
Principle of the protease assay
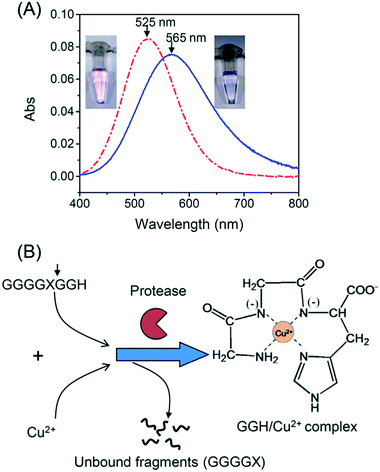
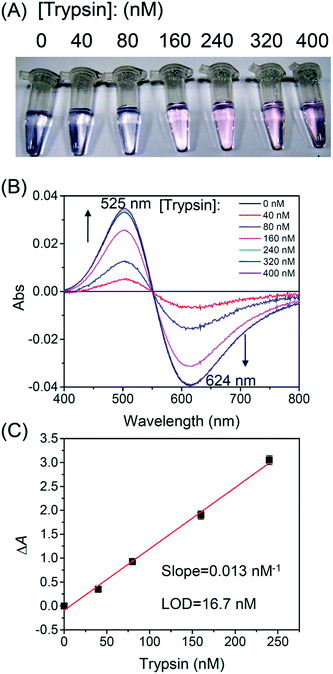
Serine proteases such as trypsin and chymotrypsin were used as model proteases because their activities are not inhibited by Cu2+.25 To detect the activity of trypsin, we designed an oligopeptide substrate GGGGKGGH (P1), which consists of a potential trypsin cleavage site at lysine (K) and a terminal tripeptide residue of GGH. In Tris buffer (pH 8.0), P1 is able to form a weak complex with Cu2+ through imidazole nitrogen and peptide bonds,26 as is evident by a strong absorption peak around 565 nm (Fig. 1A). In this case, the color of the solution is blue. Subsequently, trypsin was added to cleave the oligopeptide. According to the literature,27 this protease is able to cleave oligopeptides at the carboxyl terminal of lysine (K) or arginine (R). When 240 nM of trypsin was added to the solution, the color of the solution gradually turned to pink over 2 h. The color change was accompanied by a blue shift in the absorption spectra from 565 nm to 525 nm (Fig. 1A). The pink color indicates that when trypsin cleaves P1 at the carboxyl terminal of K, a tripeptide GGH is released. This tripeptide is able to form a highly stable complex with Cu2+ (pKa = 8.05) through a free amino group, an imidazole nitrogen and two deprotonated nitrogen atoms (Fig. 1B).28 Our titration experiment also shows that GGH/Cu2+ is more stable than the P1/Cu2+ complex (see ESI†).Fig. 2A shows effects of trypsin concentration on the colors of the reaction mixtures after 2 h of reaction. Only when the trypsin concentration was higher than 160 nM, the color of the solution changed from blue to pink after 2 h. Fig. 2B shows normalized spectra (against a spectrum without trypsin) of the reaction mixtures. With an increasing trypsin concentration, the absorbance peak at 525 nm gradually increased and the absorbance peak at 624 nm decreased. However, this trend stopped at 240 nM probably because the oligopeptide substrates had been cleaved completely by 240 nM of trypsin. Fig. 2C shows a linear relationship between the normalized absorbance ΔA (A525/A624 − A0525/A0624) and trypsin concentration. In our experiments, A525/A624 was measured in the presence of trypsin, and A0525/A0624 was measured in the absence of trypsin. From Fig. 2C, the limit of detection (LOD) was determined to be 16.7 nM (LOD = 3.3 SD/sensitivity, where SD is the standard deviation of 10 measurements of a blank sample). In Table 1, we compared LODs of several protease assays. The LOD of our protease assay is still higher compared to other assays due to a relatively small extinction coefficient of GGH/Cu2+. Further research is needed to lower the LOD of the protease assay reported herein.
Specificity of the protease assay
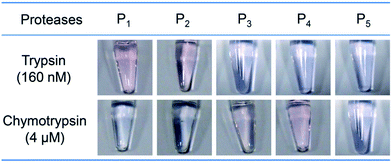
To test the specificity of the protease assay, another four oligopeptides, GGGGRGGH (P2), GGGGFGGH (P3), GGGGWGGH (P4), and RKRIRRMMPRPS (P5) were synthesized. Among these oligopeptides, P2 has a potential trypsin cleavage site R, while P3 and P4 have potential chymotrypsin cleavage sites phenylalanine (F) and tryptophan (W). P5 is a scrambled oligopeptide with trypsin cleavage sites R and K, but it does not contain any GGH in its sequence. Then, 1.0 mM of oligopeptides P1 to P5 were mixed with 1.0 mM of copper(II) sulfate and 160 nM of trypsin (or 4 μM of chymotrypsin). Higher chymotrypsin was used because the activity of chymotrypsin (40 U mg−1) is much smaller than that of trypsin (14![[thin space (1/6-em)]](https://www.rsc.org/images/entities/char_2009.gif) 408 U mg−1). Fig. 3 shows that only the solutions of P1 and P2 changed from blue to pink in the presence of trypsin. This is because P1 and P2 can be cleaved at the carboxyl terminal of K or R by trypsin. As a result, the GGH fragment was released from the oligopeptide and formed a color complex with Cu2+. Similarly, in the presence of chymotrypsin, only the solutions of P3 and P4 changed color, suggesting that only P3 and P4 can be cleaved. When a scrambled oligopeptide P5 was used, the color of the solution did not change due to the lack of GGH to form a complex with Cu2+. Collectively, no cross-response was observed for trypsin and chymotrypsin, suggesting that this assay has good specificity.
408 U mg−1). Fig. 3 shows that only the solutions of P1 and P2 changed from blue to pink in the presence of trypsin. This is because P1 and P2 can be cleaved at the carboxyl terminal of K or R by trypsin. As a result, the GGH fragment was released from the oligopeptide and formed a color complex with Cu2+. Similarly, in the presence of chymotrypsin, only the solutions of P3 and P4 changed color, suggesting that only P3 and P4 can be cleaved. When a scrambled oligopeptide P5 was used, the color of the solution did not change due to the lack of GGH to form a complex with Cu2+. Collectively, no cross-response was observed for trypsin and chymotrypsin, suggesting that this assay has good specificity.
Kinetics of protease reaction
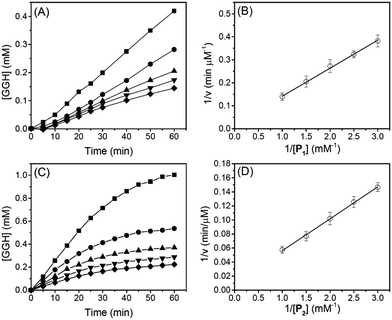
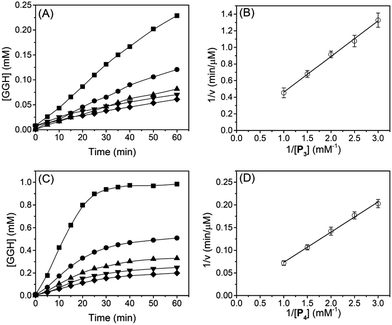
To determine reaction rates of serine proteases, we monitored normalized absorbance (A525/A624) of different reaction mixtures with different oligopeptide concentrations. Subsequently, the time-dependent GGH concentration was calculated from the normalized absorbance (A525/A624) and a calibration curve (see ESI†). Fig. 4A shows that when the concentration of P1 was between 0.33 and 1.0 mM, the concentration of GGH increased linearly in 60 min. From Fig. 4A, the reaction rate of trypsin was determined, and the Lineweaver–Burk plot (Fig. 4B) and rate constants (Table 2) were also obtained. It can be seen that Michaelis constant (Km) for P1 is 0.24 mM, and the maximum reaction rate (vmax) is 49.6 μM min−1. This value is close to the protease activity provided by the manufacturer (57.6 μM min−1 for a substrate p-toluenesulfonyl-L-arginine methyl ester). This consistency shows that the Cu2+-based protease assay is reliable.| Subs.a | v max (μM min−1) | K m (mM) | k cat (min−1) | k cat/Km (mM−1 min−1) |
|---|---|---|---|---|
| a The oligopeptide substrates of P1 and P2 were cleaved by 160 nM of trypsin, and the substrates of P3 and P4 were cleaved by 4 μM of chymotrypsin, respectively. | ||||
| P1 | 49.6 | 0.24 | 3.1 × 10² | 1.3 × 10³ |
| P2 | 93.5 | 0.09 | 5.8 × 10² | 6.4 × 10³ |
| P3 | 31.7 | 0.07 | 4.0 | 57 |
| P4 | 125.2 | 0.12 | 16 | 133 |
Similarly, Fig. 4C shows the reaction rate of trypsin when P2 was used as a substrate. In Fig. 4C, the concentration of GGH increased linearly in the first 25 min before reaching a plateau. This is because the reaction rate of trypsin is faster when P2 was used as a substrate. Subsequently, we used the initial reaction rates (between 0 and 25 min) to obtain a Lineweaver–Burk plot (Fig. 4D) and kinetic constants (Table 2). When P2 was used as a substrate, Km is 0.09 mM, indicating that P2 has a higher binding affinity for trypsin. We also notice that when P2 was used as a substrate, the turn-over number (kcat) of trypsin is 187% higher than that when P1 was used. The specificity constant (kcat/Km) of trypsin to P2 is about 4.9-fold higher than P1, showing that trypsin is more favorable to hydrolyze the R residue rather than K. This is consistent with a previous report showing that trypsin cleaves arginine-vasopressin several times faster than lysine-vasopressin.32
The reaction rates and Lineweaver–Burk plots of chymotrypsin are shown in Fig. 5, and the kinetic data are shown in Table 2. For chymotrypsin, when P4 was used as a substrate, the kcat of chymotrypsin is 4-fold higher than that when P3 was used. This is probably because chymotrypsin prefers the W residue than F during the hydrolysis of P3 and P4. Although the binding affinity (1/Km) of chymotrypsin for P4 is 1.7-fold smaller than P3, kcat/Km of chymotrypsin for P4 is 2.3-fold higher than that for P3. This is slightly different from the previous report in which kcat/Km of chymotrypsin for W is 1.2-fold higher than that for F.33 More experiments will be needed to verify the discrepancy.
Protease assays in serum solution
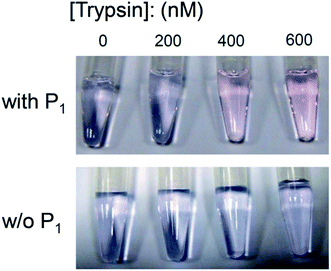
Detection of protease activity in complex media is challenging. To understand the performance of this protease assay in complex media, serum solutions containing 1.0 mM of copper(II) sulfate, 1.0 mM of P1, and different concentrations of trypsin (0, 200, 400, and 600 nM) were prepared. Fig. 6 shows that the solution color still changed from blue to pink when the trypsin concentration was 400 nM or higher, indicating that P1 was cleaved by trypsin even in the serum solution. To rule out the possibility that the color change was caused by the digestion of serum proteins, a control experiment without P1 was conducted. Fig. 6 shows that the color of the serum solution without P1 did not change. These results, when combined, show that this protease assay still functions properly in serum solutions, but the LOD becomes higher. This is probably because some trypsin cleaved serum proteins instead of P1 when the solution contained serum proteins.Inhibition of protease
Finally, we evaluated inhibitory potency of a trypsin inhibitor benzamidine hydrochloride (BH) by using this protease assay. It has been demonstrated in the literature that BH is a potent trypsin inhibitor.34Fig. 7A shows that when the BH concentration was 1.6 mM or higher, the color of the solution remained blue. This result shows that the activity of trypsin was inhibited by BH. Fig. 7B shows that the inhibition efficiency (IE) increases with the increasing concentration of BH. From Fig. 7B, the IC50 value of benzamidine hydrochloride for trypsin is 0.4 mM, which is similar to the previously reported value.34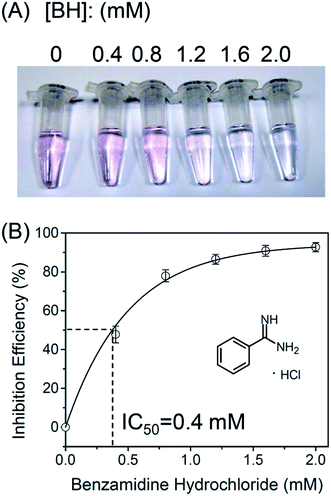 | ||
| Fig. 7 (A) Inhibition of trypsin activity by using different concentrations of benzamidine hydrochloride. (B) Inhibition efficiency as a function of benzamidine hydrochloride concentration. | ||
Conclusions
A quantitative serine protease assay was successfully developed. Substrates used in this assay were synthetic oligopeptides with a cleavable residue X (X= K, R, F, and W) followed by another 3 residues GGH at their C-terminal ends. The tripeptide GGH can be released and formed a pink complex with Cu2+ after the oligopeptides were cleaved by trypsin or chymotrypsin. This assay shows good specificity for different oligopeptides and serine protease as no cross-response was observed. This assay offers many advantages including simplicity, free of labels, and possibility for naked-eye detection. However, the requirement for Cu2+ may limit its applications for proteases whose activities are inhibited by metal ions.Acknowledgements
This work was supported by the National Research Foundation (NRF) in Singapore under grant (NRF 2009 NRF-CRP 001-039).References
- H. B. Wang, Q. Zhang, X. Chu, T. T. Chen, J. Ge and R. Q. Yu, Angew. Chem., Int. Ed., 2011, 50, 7065–7069 CrossRef CAS PubMed.
- L. R. Zhang, Q. X. Xu, D. Xing, C. J. Gao and H. W. Xiong, Plant Physiol., 2009, 150, 1773–1783 CrossRef CAS PubMed.
- Y. L. Pan, M. L. Guo, Z. Nie, Y. Huang, Y. Peng, A. F. Liu, M. Qing and S. Z. Yao, Chem. Commun., 2012, 48, 997–999 RSC.
- C. J. Vickers, G. E. Gonzalez-Paez and D. W. Wolan, ACS Chem. Biol., 2013, 8, 1558–1566 CrossRef CAS PubMed.
- F. H. Messerli, Eur. Heart J., 2004, 25, 1475–1476 CrossRef PubMed.
- A. Papazafiropoulou and N. Tentolouris, Hippokratia, 2009, 13, 76–82 CAS.
- P. Chen, R. Selegard, D. Aili and B. Liedberg, Nanoscale, 2013, 5, 8973–8976 RSC.
- T. J. Harris, G. von Maltzahn, A. M. Derfus, E. Ruoslahti and S. N. Bhatia, Angew. Chem., Int. Ed., 2006, 45, 3161–3165 CrossRef CAS PubMed.
- G. von Maltzahn, T. J. Harris, J. H. Park, D. H. Min, A. J. Schmidt, M. J. Sailor and S. N. Bhatia, J. Am. Chem. Soc., 2007, 129, 6064–6065 CrossRef CAS PubMed.
- W. Cheng, Y. L. Chen, F. Yan, L. Ding, S. J. Ding, H. X. Ju and Y. B. Yin, Chem. Commun., 2011, 47, 2877–2879 RSC.
- S. Krizkova, O. Zitka, M. Masarik, V. Adam, M. Stiborova, T. Eckschlager, G. J. Chavis and R. Kizek, TrAC, Trends Anal. Chem., 2011, 30, 1819–1832 CrossRef CAS PubMed.
- C. Q. Zhang, L. Zheng, J. Nurnberg, B. M. Vacari, J. Z. Zhou and Y. Wang, Anal. Biochem., 2014, 445, 14–19 CrossRef CAS PubMed.
- W. T. Zhao, C. L. Yao, X. T. Luo, L. Lin and I. M. Hsing, Electrophoresis, 2012, 33, 1288–1291 CrossRef CAS PubMed.
- D. M. Krizek and M. E. Rick, Electrophoresis, 2001, 22, 946–949 CrossRef CAS.
- S. D. Lamore, S. X. Qiao, D. Horn and G. T. Wondrak, Photochem. Photobiol., 2010, 86, 1307–1317 CrossRef CAS PubMed.
- Y. P. Kim, B. S. Lee, E. Kim, I. S. Choi, D. W. Moon, T. G. Lee and H. S. Kim, Anal. Chem., 2008, 80, 5094–5102 CrossRef CAS PubMed.
- Y. R. Na, S. Y. Kim, J. T. Gaublomme, A. K. Shalek, M. Jorgolli, H. Park and E. G. Yang, Nano Lett., 2013, 13, 153–158 CrossRef CAS PubMed.
- O. Vosyka, K. R. Vinothkumar, E. V. Wolf, A. J. Brouwer, R. M. J. Liskamp and S. H. L. Verhelst, Proc. Natl. Acad. Sci. U. S. A., 2013, 110, 2472–2477 CrossRef CAS PubMed.
- T. Zauner, R. Berger-Hoffmann, K. Muller, R. Hoffmann and T. Zuchner, Anal. Chem., 2011, 83, 7356–7363 CrossRef CAS PubMed.
- C. Guarise, L. Pasquato, V. De Filippis and P. Scrimin, Proc. Natl. Acad. Sci. U. S. A., 2006, 103, 3978–3982 CrossRef CAS PubMed.
- A. Laromaine, L. L. Koh, M. Murugesan, R. V. Ulijn and M. M. Stevens, J. Am. Chem. Soc., 2007, 129, 4156–4157 CrossRef CAS PubMed.
- G. B. Kim, K. H. Kim, Y. H. Park, S. Ko and Y. P. Kim, Biosens. Bioelectron., 2013, 41, 833–839 CrossRef CAS PubMed.
- X. Ding, D. Ge and K.-L. Yang, Sens. Actuators, B, 2014, 201, 234–239 CrossRef CAS PubMed.
- S. P. Wu and S. R. Liu, Sens. Actuators, B, 2009, 141, 187–191 CrossRef CAS PubMed.
- H. Steinhart, R. Wieninger-Rustemeyer and M. Kirchgessner, Arch. Tierernaehr., 1981, 31, 119–125 CrossRef CAS.
- G. F. Bryce and F. R. N. Gurd, J. Biol. Chem., 1966, 241, 122–129 CAS.
- M. J. Page and E. Di Cera, Cell. Mol. Life Sci., 2008, 65, 1220–1236 CrossRef CAS PubMed.
- P. Mlynarz, D. Valensin, K. Kociolek, J. Zabrocki, J. Olejnik and H. Kozlowski, New J. Chem., 2002, 26, 264–268 RSC.
- G. C. Chen, Y. S. Xie, H. T. Zhang, P. Wang, H. Y. Cheung, M. S. Yang and H. Y. Sun, RSC Adv., 2014, 4, 6560–6563 RSC.
- W. X. Xue, G. X. Zhang and D. Q. Zhang, Analyst, 2011, 136, 3136–3141 RSC.
- Y. Y. Wang, Y. Zhang and B. Liu, Anal. Chem., 2010, 82, 8604–8610 CrossRef CAS PubMed.
- H. Keilova, Physiol. Chem. Phys., 1969, 1, 100 CAS.
- P. Hudaky, G. Kaslik, I. Venekei and L. Graf, Eur. J. Biochem., 1999, 259, 528–533 CrossRef CAS.
- W. Y. Li, J. Chen, H. P. Jiao, Q. F. Zhang, H. P. Zhou and C. Yu, Chem. Commun., 2012, 48, 10123–10125 RSC.
Footnote |
| † Electronic supplementary information (ESI) available. See DOI: 10.1039/c4an01731e |
| This journal is © The Royal Society of Chemistry 2015 |

