Single step derivatization with CF3 enone of thiophene at ambient temperature to determine propellant grade hydrazines: a study by GC and GC-MS†
Selvakumar
Subramanian
*ab,
Somanathan
Narayanasastri
*b and
Audisesha Reddy
Kami Reddy
a
aChemical Testing Lab, Solid Propellant Space Booster Plant, SDSC-SHAR Centre, Indian Space Research Organization (ISRO), Sriharikota 524124, Andhra Pradesh, India. E-mail: selvakumar.s@shar.gov.in; kumarreka@hotmail.com; Fax: +91-8623-225154; Tel: +91-8623-223013
bPolymer Division, Central Leather Research Institute (CLRI), Council of Scientific and Industrial Research (CSIR), Adyar, Chennai 600020, Tamil Nadu, India. E-mail: nsomanathan@rediffmail.com; Tel: +91-44-24437189
First published on 10th November 2014
Abstract
A simple, highly selective and rapid gas chromatography method (packed column with flame ionization detection) has been developed to determine hydrazine and monomethylhydrazine individually and for selective determination of hydrazine in the UH 25 mixture in organic medium. This method is based on the derivatization of hydrazine (at ambient temperature) with 1,1,1-trifluoro-4-(3-thienyl) (CF3 enone) in the absence of catalyst/buffer which leads to the formation of corresponding pyrazolidine/pyrazoline/pyrazole. The organic derivatives thus formed are then detected and their presence is confirmed by GC-MS. The GC method provides good resolution between CF3 enone and its derivatives with a total analysis time of 20 min. The concentration of CF3 enone and derivatization time are optimized to determine hydrazines in the concentration range of 0.4 mM to 0.2 M. The calibration curves based on peak areas of CF3 enone and its derivatives showed good linearity with r2 ≈ 0.999 for the working range and the precision was found to be less than 1% for hydrazine, MMH and hydrazine in UH25. The recovery was found by the standard addition method. Under the established conditions, limits of detection were 20 μM for hydrazine, 10 μM for MMH and 20 μM for hydrazine in UH25. The tolerance limit for interfering amines was also found. The advantage of this method is the selective detection and determination of hydrazine in the UH25 mixture as 1,1-dimethylhydrazine present in UH25 cannot be derivatized with CF3 enone.
1 Introduction
Hydrazine its derivatives such as monomethyl hydrazine (MMH) and unsymmetrical dimethylhydrazine (UDMH) are important both individually and in mixtures (UH-25 – a fuel blend by weight of unsymmetrical dimethyl hydrazine and hydrazine hydrate in the ratio of 75![[thin space (1/6-em)]](https://www.rsc.org/images/entities/char_2009.gif) :
:![[thin space (1/6-em)]](https://www.rsc.org/images/entities/char_2009.gif) 25) as rocket fuels due to their strong reducing nature. As they are highly reactive, they are widely used in chemical syntheses of explosives, military fuel cells and as chain extenders in the polymerization of urethanes. Though hydrazines are extremely useful chemicals for industrial and propellant applications, they are extremely hazardous. In space industries, large volumes of these hydrazines are shipped or transported every year as there is enormous increase in the frequency of launches worldwide. The routine handling of these fuels occasionally results in accidental spillage. The major problems observed with these hydrazines are that they can be absorbed through skin, affect blood production, cause liver and kidney damage. Due to their basic nature, they can cause dermatitis and severe burns if spilled on the skin. Exposure to high concentrations causes convulsions and possibly leads to death. They are known for their carcinogenic nature and can have a heavy impact on human beings who are being exposed to these toxic compounds. Adverse health effects on people living near hazardous waste sites caused by hydrazines have been described by many researchers.1–6 Hydrazine has a cancer risk level of 10−6 with an air concentration of 0.2 ng L−1 and with a drinking water concentration of 10 ng L−1. Monomethyl hydrazine is a known mutagen and a suspected human carcinogen. The National Institute of Occupational Safety and Health (NIOSH) has a permitted exposure limit (PEL) of 0.08 mg m−3 ceiling and OSHA has a PEL of 0.35 mg m−3 ceiling (skin) for MMH. Both hydrazines were listed by NIOSH as compounds immediately dangerous to life or health (IDLH).
25) as rocket fuels due to their strong reducing nature. As they are highly reactive, they are widely used in chemical syntheses of explosives, military fuel cells and as chain extenders in the polymerization of urethanes. Though hydrazines are extremely useful chemicals for industrial and propellant applications, they are extremely hazardous. In space industries, large volumes of these hydrazines are shipped or transported every year as there is enormous increase in the frequency of launches worldwide. The routine handling of these fuels occasionally results in accidental spillage. The major problems observed with these hydrazines are that they can be absorbed through skin, affect blood production, cause liver and kidney damage. Due to their basic nature, they can cause dermatitis and severe burns if spilled on the skin. Exposure to high concentrations causes convulsions and possibly leads to death. They are known for their carcinogenic nature and can have a heavy impact on human beings who are being exposed to these toxic compounds. Adverse health effects on people living near hazardous waste sites caused by hydrazines have been described by many researchers.1–6 Hydrazine has a cancer risk level of 10−6 with an air concentration of 0.2 ng L−1 and with a drinking water concentration of 10 ng L−1. Monomethyl hydrazine is a known mutagen and a suspected human carcinogen. The National Institute of Occupational Safety and Health (NIOSH) has a permitted exposure limit (PEL) of 0.08 mg m−3 ceiling and OSHA has a PEL of 0.35 mg m−3 ceiling (skin) for MMH. Both hydrazines were listed by NIOSH as compounds immediately dangerous to life or health (IDLH).
Because of these considerable toxicological effects and industrial significance, the determination of these hydrazines at micro-levels is of great interest and practical importance. As they are explosive, toxic and carcinogenic in nature, many methods for detection (followed by determination) of these hydrazines have been proposed by many researchers to protect the personnel working in such a hazardous chemical environment. These include spectrophotometry,7–10 fluorescence,11–18 gas chromatography19–28 and liquid chromatography29–31 methods.
Out of these methods, GC has been widely used for hydrazine analysis because of its inherent advantages of simplicity, high resolving power, high sensitivity, short analysis time and low cost. Though GC of hydrazines is a specific one, it is very difficult to obtain symmetrical hydrazine peaks even with Teflon supports in the columns.19 It is due to their strong polar nature which results in sample adsorption. The detection limit for detection of these toxic compounds by GC has been improved by several orders using flame ionisation detection (FID). However, the FID is blind to hydrazine as it combusts hydrazine to form nitrogen and water. Alkylhydrazines such as monomethyl hydrazine and unsymmetrical hydrazine give only a weak signal because of the presence of low carbon content in them.2
Derivatization is a popular technique for overcoming such types of problems. The main purpose of derivatization is to reduce the polarity of the amino group present in hydrazines and to improve GC properties of derivatives such as volatility, selectivity, sensitivity and separation.32 Hence to improve GC properties for detection of these hydrazines by FID, they are converted to organic derivatives with high carbon (or even some halogen) content. Several derivatization-based GC methods for the determination of hydrazines have been reported in the past. They are mainly based on derivative formation from 2,4-pentanedione,19 1,1,1-trifluoroacetylacetone,20 pentafluoro benzaldehyde,21,22p-nitrobenzaldehyde,23,24 ethylchloro formate,25 acetone,26 and o-phthalaldehyde27 (Table 1). These methods are selective either to hydrazine or MMH or UDMH only. Simultaneous application of derivatizing agents to both hydrazine and its methyl analogue (MMH) with their corresponding end products was not possible in these cases as the reactivity of both hydrazine and MMH is similar.
| Derivatizing agent, extracting solvent & test conditions | Determined substance in medium | Detection | LOD | Ref. |
|---|---|---|---|---|
| 2,4-Pentanedione, water, 5 °C | Hydrazine in water | FID | 0.1 mg L−1 | 19 |
| MMH in water | 0.1 mg L−1 | |||
| 1,1,1-Trifluoroacetylacetone, chloroform; 15 min; 75 °C | Hydrazine in pharmaceuticals | FID | 0.001 mg L−1 | 20 |
| Pentafluoro benzaldehyde, ethyl acetate; 30 min; 25 °C | Hydrazine in urine, plasma, liver | NPD | 5 ng kg−1 | 21 |
| Pentafluoro benzaldehyde, n-hexane; 20 min; 25 °C | Hydrazine in maleic acid hydrazide | ECD | 50 μg kg−1 | 22 |
| 4-Nitrobenzaldehyde, n-hexane; 30 min; 80 °C | UDMH in water | NPD | 0.03 μg L−1 | 23 |
| 4-Nitrobenzaldehyde, n-hexane; 30 min; 37 °C | UDMH in soil | FID | 10 μg kg−1 | 24 |
| Ethyl chloroformate, chloroform; 15 min at 25 °C | Hydrazine in pharmaceuticals | FID | 0.002 μg L−1 | 25 |
| Acetone, dichloromethane; 10 min; 100 °C | Hydrazine in vapour phase analysis | MS | 0.0001 μg L−1 | 26 |
| O-Phthalaldehyde, methylene chloride; 20 min; 70 °C; buffer pH – (initial-2; final-9.5) | Hydrazine in drinking water and surface water | MSD | 0.002 μg L−1 | 27 |
| CF3 enone, no extraction; 10 min; RT | Hydrazine | FID | 0.05 mg L−1 | This work |
| MMH | 0.10 mg L−1 | |||
| Hydrazine (in UH25) (all in organic medium) | 0.05 mg L−1 |
In addition to this, some of these methods are more time consuming21,23,24,33 with poor recovery records obtained from non-universal detectors such as the Electron Capture Detector22 (ECD) and Nitrogen Phosphorous Detector21,23 (NPD). There is a need for catalysts for such types of reactions with pre-concentration step requirement25 and high temperature application20,27 or extraction of derivatives with low boiling solvents is involved. Separation of interference from the main derivative is also a tedious task in these cases. Some other potential problems with such derivatization procedures include the formation of unwanted derivatives, the presence of unchanged derivatization reagents as they affect the analysis and the requirement of non-aqueous reaction conditions.
In addition to the above drawbacks, derivatizing agents such as acetone34 and derivatives of acetone are very much volatile in nature and there is every possibility for their loss during the concentration of the volatile agent and its derivative leading to erratic determination of hydrazines. Moreover, they have minimal retention on the GC column which is a major disadvantage for any GC analysis. Other derivatizing agents often need hydrophobic solvents in which hydrazines are immiscible.
Hence, α,β-unsaturated ketones with a trifluoromethyl group (CF3 enones), organofluorine compounds, were opted to meet the above challenges due to their special features such as solubility in high boiling solvents, high reactivity of their double bond and carbonyl group, the formation of stable fragments CF3C(OH)N– with hydrazines and the stereoselectivity for the addition of nucleophiles (hydrazines). CF3 enones have become valuable synthons for many synthetic purposes. Reactions of these enones are very much uncharacteristic of non-fluorinated unsaturated ketones.
Their extensive utilization for the synthesis of trifluoromethyl containing heterocycles was started only quite recently. But the use of these enones for the application to hydrazines is considered to be unexploited. In the case of hydrazine and MMH, their reaction results in the formation of the corresponding pyrazolidines/pyrazolines/pyrazoles which are different.
The formation of pyrazolidines/pyrazolines/pyrazoles by the room temperature (RT) reactivity of the active carbonyl group and double bond at the 3-position of the thiophene moiety {3-butenone (E)-1,1,1-trifluoro-4-(3-thienyl)}with hydrazines in organic medium is the characteristic one for hydrazines.35–42 This derivatization reaction is quick and quantitative at RT. The spectrophotometric method reported previously by us7 is based on the above principle and found to have a much higher sensitivity and supporting evidence for previous findings. It has been applied successfully to the determination of hydrazine and MMH in acetonitrile medium. But this method works on the principle that identification and hence quantification of compounds is possible only at a particular wavelength that is absorbed by these compounds. As a result, reactivity difference between hydrazine and MMH with CF3 enone could not be determined. GC analysis of these compounds separates complex mixtures of organics and allows individual compounds to be identified and quantified by a detector which is under use. As there is an unequivocal identification requirement, a mass spectrometer (MS) coupled to the GC column was also employed in the present study. In this manuscript, we proposed a GC method which involves a very sensitive single step derivatization technique. This technique can be utilized to determine hydrazine and MMH individually (at trace levels) and for selective determination of hydrazine in the UH25 mixture. In addition to that, we have described the GC-MS technique for qualitative detection of CF3 enone and its derivatives with hydrazine and MMH.
Here, we attempted to make use of such a simple and inexpensive derivatizing reagent for the GC determination of hydrazines which could be of very much analytical interest for quality control. The GC method presented here has desirable analytical properties (sensitivity, precision, selectivity and wide linear range) as well as being widely available for its application in any common labs which use universal detection techniques like FID.
2 Experimental
2.1 Materials and reagents
1,1,1-Trifluoroacetone and thiophene-3-carboxaldehyde (3-thienaldehyde) were sourced from Sigma Aldrich, USA. Hydrazine (purity: 99.7% by GC), MMH (purity: 99.6% by GC), and UH-25 (UDMH-74.2%; hydrazine hydrate-25.4% by GC) are of propellant grade. Other chemicals including acetonitrile used in the synthesis and characterization were sourced from Merck, India.2.2 Characterization
FT-IR spectra of the samples were recorded on an ABB MB 3000 Fourier transform infrared spectrometer by coating the sample on a NaCl disc. NMR spectra were recorded by using a JEOL ECA 500 MHz high resolution liquid state NMR spectrometer. Spectrophotometric measurements were performed using a spectrophotometer (Model – Techcomp-8500) with 1 cm quartz cells. An Agilent 6890 gas chromatograph with a split/split less injector (Agilent Technologies, USA) was used for GC-MS analysis. The analytical column was the BP-1 MS column (100% dimethylpolysiloxane, 60 m, 0.25 mm I.D. × 0.25 μm film thickness). Samples were injected in the split mode at a split ratio of 1![[thin space (1/6-em)]](https://www.rsc.org/images/entities/char_2009.gif) :
:![[thin space (1/6-em)]](https://www.rsc.org/images/entities/char_2009.gif) 100. The carrier gas (helium) was passed through the column in constant pressure mode (44 psi). A temperature program was used to resolve the peaks. The initial temperature was at 120 °C, raised to 250 °C at a rate of 10 °C min−1. All mass spectra were obtained using an Agilent 5973 instrument. The ion source was operated in the electron ionization mode (EI: 70 eV, 230 °C). Full scan mass spectra (m/z 40–400) were recorded for the identification of the analytes at a high concentration of standard solutions. The experiments for determination of hydrazines after derivatization were performed using a Chrompack – CP-9001 GC equipped with FID. The GC column utilized for the above purpose was 10% SE-30 (packed column-2 m × 1/8′′) on chromosorb-WHP, mesh range – 60/80 (Make – Chromatopak, Mumbai). Maitre software (version 2.5) was used to control the instrument. It was also used to collect and process the experimental data. All the data (inclusive of calibration data) were obtained from the plots using the program Microcal Origin 7.0.
100. The carrier gas (helium) was passed through the column in constant pressure mode (44 psi). A temperature program was used to resolve the peaks. The initial temperature was at 120 °C, raised to 250 °C at a rate of 10 °C min−1. All mass spectra were obtained using an Agilent 5973 instrument. The ion source was operated in the electron ionization mode (EI: 70 eV, 230 °C). Full scan mass spectra (m/z 40–400) were recorded for the identification of the analytes at a high concentration of standard solutions. The experiments for determination of hydrazines after derivatization were performed using a Chrompack – CP-9001 GC equipped with FID. The GC column utilized for the above purpose was 10% SE-30 (packed column-2 m × 1/8′′) on chromosorb-WHP, mesh range – 60/80 (Make – Chromatopak, Mumbai). Maitre software (version 2.5) was used to control the instrument. It was also used to collect and process the experimental data. All the data (inclusive of calibration data) were obtained from the plots using the program Microcal Origin 7.0.
2.3 Preparation of solutions
Solutions of CF3 enone with concentrations of 2.5, 5, 10, 12.5, 20, and 25 mM were prepared in acetonitrile medium. These solutions are stable for minimum ten days if they are kept at 5 °C under closed conditions. Derivative solutions after formation with hydrazine and MMH are stable for only one day.Stock solutions of hydrazine, MMH and UH25 in acetonitrile medium (1 M) were prepared. Solutions with concentrations of 0.1, 0.4, 2, 4, 10, 20, 40 mM, 0.1, and 0.2 M were prepared from each of the stock solutions. The standard ASTM method for hydrazine (D1385-07) was used to standardize its concentration in its pure form and in the UH25 mixture. Here, spectrophotometric measurements were carried out at 458 nm. The same method was utilized to standardize the concentration of MMH. Here, spectrophotometric measurements were carried out at 462 nm.7
2.4 Synthesis and characterization of 3-butenone (E)-1,1,1 tri-fluoro-4-(3-thienyl)
The synthetic procedure adopted previously by our group has been followed with slight modification of the synthesis of CF3 enone. Glacial acetic acid and piperidine were used in catalytic amounts (1![[thin space (1/6-em)]](https://www.rsc.org/images/entities/char_2009.gif) :
:![[thin space (1/6-em)]](https://www.rsc.org/images/entities/char_2009.gif) 1) with a solution of 3-thienaldehyde (0.05 M) in dry benzene under a nitrogen atmosphere. Trifluoroacetone (44.8 g – 0.40 M) in eight parts (instead of 5 parts tried in our previous synthesis)7 to improve the yield (self-condensation of trifluoroacetone reduces the yield) and the mixture was stirred at RT until completion of the reaction. The reaction mixture was quenched with saturated ammonium chloride solution and washed with sodium bisulphite solution to remove unreacted aldehyde followed by water wash to neutral pH. The resultant solution was dried over sodium sulphate and concentrated under vacuum. The pure compound is eluted with n-hexane.
1) with a solution of 3-thienaldehyde (0.05 M) in dry benzene under a nitrogen atmosphere. Trifluoroacetone (44.8 g – 0.40 M) in eight parts (instead of 5 parts tried in our previous synthesis)7 to improve the yield (self-condensation of trifluoroacetone reduces the yield) and the mixture was stirred at RT until completion of the reaction. The reaction mixture was quenched with saturated ammonium chloride solution and washed with sodium bisulphite solution to remove unreacted aldehyde followed by water wash to neutral pH. The resultant solution was dried over sodium sulphate and concentrated under vacuum. The pure compound is eluted with n-hexane.
Yield 65%; 13CNMR (in CDCl3) 180.5, 143.2, 137.1, 132.8, 127.9, 125.2, 116.4; 1H NMR (CDCl3) – 6.8 (d, J = 15.4, 1H); 7.4 (m, 2H-aromatic); 7.8 (m, 1H-aromatic); 7.9 (d, J = 16, 1H).
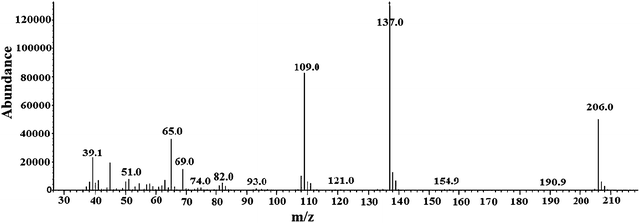
GC-MS data show that CF3 enone elutes at 8.6 min (individual injection of CF3 enone solution – Fig. S4 of the ESI†) with m/z −206 (mass spectra in Fig. 1) for which the fragmentation pattern for CF3 enone is shown in FP-01 of the ESI.†
FT-IR spectra of CF3 enone in acetonitrile taken in a NaCl disc shows five peaks, 1309 (aromatic-CH stretching), 2923 and 2854 (aliphatic-CH stretching), 1712 (![[double bond splayed left]](https://www.rsc.org/images/entities/char_e009.gif) C
C![[double bond, length as m-dash]](https://www.rsc.org/images/entities/char_e001.gif) O stretching), and 1600 cm−1 (olefinic-C
O stretching), and 1600 cm−1 (olefinic-C![[double bond, length as m-dash]](https://www.rsc.org/images/entities/char_e001.gif) C stretching). The peaks identified are consistent with previously published data.7 UV-Vis spectroscopy analysis of CF3 enone in acetonitrile shows three peak maxima (201, 229 and 320 nm). The peaks identified are consistent with previously published data.7 An FTIR study of the derivatives of hydrazine and MMH showed that there is a complete disappearance of carbonyl vibration at 1712 cm−1 and C
C stretching). The peaks identified are consistent with previously published data.7 UV-Vis spectroscopy analysis of CF3 enone in acetonitrile shows three peak maxima (201, 229 and 320 nm). The peaks identified are consistent with previously published data.7 An FTIR study of the derivatives of hydrazine and MMH showed that there is a complete disappearance of carbonyl vibration at 1712 cm−1 and C![[double bond, length as m-dash]](https://www.rsc.org/images/entities/char_e001.gif) C bond vibration at 1600 cm−1 followed by the appearance of C
C bond vibration at 1600 cm−1 followed by the appearance of C![[double bond, length as m-dash]](https://www.rsc.org/images/entities/char_e001.gif) N bond vibration at 1668 cm−1. The changes occurred due to hydrazine and MMH were already explained in our previous study.7 As the changes noticed for the UH25 derivative were similar to those of hydrazine, spectra for the same are not shown here.
N bond vibration at 1668 cm−1. The changes occurred due to hydrazine and MMH were already explained in our previous study.7 As the changes noticed for the UH25 derivative were similar to those of hydrazine, spectra for the same are not shown here.
3 Results and discussion
3.1 Chemical structures and the derivatization mechanism by GC-MS analysis
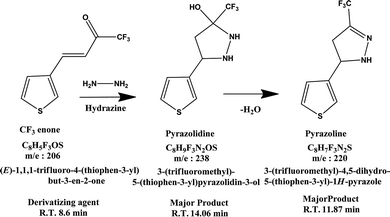
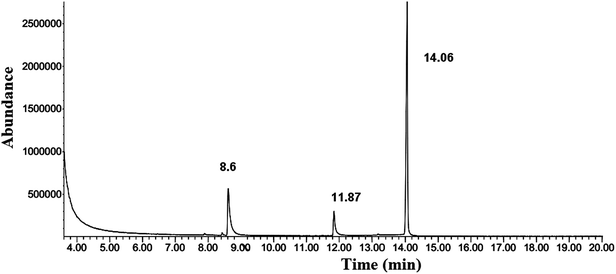
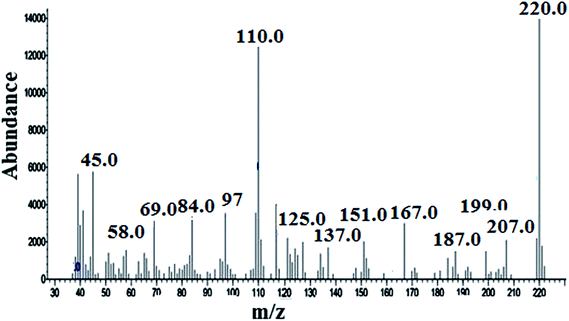
Chemical structures of CF3 enone, hydrazine, MMH and their possible derivatives are given in Schemes 1 and 2. The strong electron accepting nature of the trifluoroacetyl group present in CF3 enone causes its reaction with hydrazines to proceed faster at RT. Here, the possible reaction is heterocyclization, which is proceeded by two routes. The first route is a primary Michael addition of a nucleophile to enone with subsequent cyclization and the second route is a primary addition of a nucleophile at the carbonyl group followed by cyclization. This might be due to the similar nucleophilicity of the two nucleophilic centers of hydrazine.35Scheme 1 depicts probable derivatives of CF3 enone after reaction with hydrazine. As per this scheme, the heterocyclization reaction results in the formation of pyrazolidine (eluting at 14.06 min – Fig. 2, m/z −238 by GC-MS – Fig. S5 of the ESI† for which the fragmentation pattern is given in FP 03 of the ESI†) and pyrazoline (eluting at 11.87 min – Fig. 2, m/z −220 by GC-MS in Fig. 3 for which fragmentation is given in FP 02 of the ESI†). The formation of pyrazoline is due to dehydration of pyrazolidine.7 Change in the peak area of pyrazolidine depends on the change in concentration of hydrazine. When concentration is increased, there is a corresponding increase in the peak area of pyrazolidine also. Here, pyrazoline is formed in small quantities and there is no significant change in its peak area even for the addition of higher concentrations of hydrazine. The results provide strong supporting evidence for our theoretical explanation7 and for the findings of other researchers.35–37
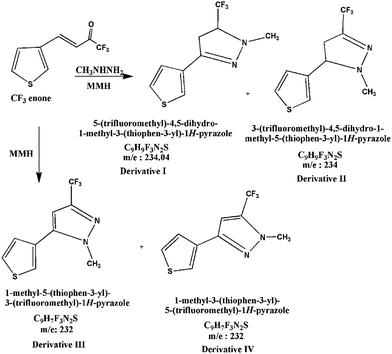
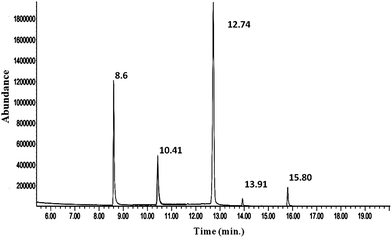
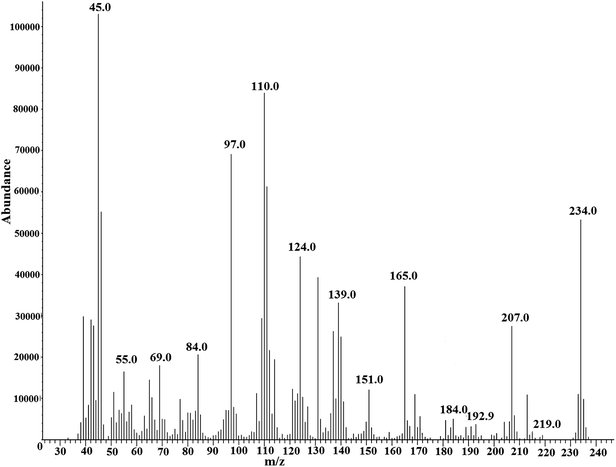
Scheme 2 indicates the reaction of MMH with CF3 enone forming four derivatives. The reaction with MMH leads to the formation of pyrazolines I and II35 (eluting at 10.41 min and 12.74 min – Fig. 4, m/z −234 by GC MS for both derivatives – shown in Fig. S6 (of the ESI†) and 5 respectively for which fragmentation patterns are shown in FP 04 and 05 of the ESI†). These derivatives are regioisomers of pyrazoline (formed in ∼1![[thin space (1/6-em)]](https://www.rsc.org/images/entities/char_2009.gif) :
:![[thin space (1/6-em)]](https://www.rsc.org/images/entities/char_2009.gif) 3 ratio)35 which are the resultant of heterocyclization followed by dehydration. This result also provides supporting evidence for our previous study.7
3 ratio)35 which are the resultant of heterocyclization followed by dehydration. This result also provides supporting evidence for our previous study.7
In addition to pyrazoline isomers, two regioisomers of pyrazoles (eluting at 13.91 min and 15.80 min – Fig. 4, m/z −232 by GC-MS for both derivatives – shown in Fig. S7 and S8† respectively for which fragmentation patterns are shown in FP 06 and 07 of the ESI†) are formed38–40 as a result of heterocyclization which is unexpected and not suggested by us in our previous study.
Regiochemistry observed in both cases of pyrazoline and pyrazole is due to two different nucleophilic centers of methyl hydrazine.35 There is a possibility of attack of one nucleophile (either –NH2 or –NCH3) at both the double bond and the carbonyl group followed by dehydration which results in the formation of pyrazoline/pyrazole isomers. Direct formation of pyrazoline by spontaneous removal of water might be due to a significant increase in the nucleophilicity of MMH by replacement of one hydrogen atom in hydrazine by a methyl group. The vertical comparison of hydrazine and MMH studied by T. A. Nigst et al.43 shows that substituted nitrogen in MMH is activated by a factor of 11 (MMH/hydrazine).8
Formation of pyrazoles40–42 (derivatives III and IV) is not dependent on the concentration of MMH indicating that there will be no significant change in the peak areas of these derivatives. As there are corresponding changes in the formation of derivatives I and II for the change in the addition of MMH, these derivatives are used for calibration purposes. It is to be noted that there was a very small but proportional change in the formation of derivative I. In both GC chromatograms (obtained from reaction mixtures of hydrazine and MMH with CF3 enone), unreacted CF3 enone elutes at 8.6 min.
The UDMH of UH25 does not react with CF3 enone to form pyrazolidine/pyrazoline/pyrazole. Heterocyclization is not favored with UDMH which may be due to totally unbalanced nucleophilic centres of UDMH namely –NH2 and –N(CH3)2. Unsymmetrical replacement of two hydrogen atoms in hydrazine by methyl groups further increases its nucleophilicity43,8 at one side of NH2–NH2 which is not favorable for heterocyclization. Due to this reason, hydrazine present in the UH25 mixture alone forms derivatives. This is confirmed by matching with the retention times of hydrazine derivative peaks. As the conversion pattern of UH25 was similar to that of hydrazine, GC-MS analysis was not carried out for the UH25 derivative.
3.2 Optimization of variables
Scouting experiments were performed for the selection of column under several test conditions (details are given in the ESI†). A SE-30 column is found to be suitable for the present study as it is superior in quality and has silicone which is inert and resistant to the chemical attack by derivatives of hydrazines with good thermal stability.44 The polar –Si–O–Si– bond in the stationary phase material improves the resolution of CF3 enone from its derivatives. Temperature programming was found to be a better option for good resolution and quantification. Experimental conditions thus optimized and standardized are given as follows: carrier gas and flow rate: helium, 40 ml min−1; injection port temperature: 210 °C; detector temperature: 225 °C; oven temperature: 120–200 °C at 8 °C min−1. Injection volume: 2 μL; run time: 15 min.The effect of temperature on the reactivity of CF3 enone with hydrazines and its completion time was determined at 50 °C at different time intervals. Application of temperature results in fast completion of reaction with a similar pattern of peaks obtained for the trials at RT. No major change was observed in the peak areas of derivatives or CF3 enone. Hence, the entire study is planned at RT. A swift decrease in the area of the CF3 enone peak and hence an increase in the area of the CF3 enone derivative peaks were observed for the addition of higher concentrations of hydrazines (as there is correspondingly better reactivity). Lower concentrations of hydrazines (as there is correspondingly less reactivity) caused a comparatively small but similar change in the areas of CF3 enone and its derivatives. Out of the various concentrations of CF3 enone tried (2.5, 5, 10, 12.5, 20 and 25 mM), the concentration of 20 mM was selected for further studies. After fixing the concentration of CF3 enone, concentrations in the range of 0.2 M to 0.4 mM for hydrazine or MMH or UH25 (depending on the study requirement) were tried for derivatization at RT. The ratio fixed for CF3 enone and hydrazine (or MMH or UH25) in acetonitrile was 1![[thin space (1/6-em)]](https://www.rsc.org/images/entities/char_2009.gif) :
:![[thin space (1/6-em)]](https://www.rsc.org/images/entities/char_2009.gif) 1. Though the reaction was completed within 5 min, the derivatization time was tried with 10, 15 and 20 min. As there was no noticeable change in the areas of CF3 enone and its derivatives after 5 min, the derivatization time was fixed as 5 min. The derivatization procedure stated in Section 3.3 was followed for further studies.
1. Though the reaction was completed within 5 min, the derivatization time was tried with 10, 15 and 20 min. As there was no noticeable change in the areas of CF3 enone and its derivatives after 5 min, the derivatization time was fixed as 5 min. The derivatization procedure stated in Section 3.3 was followed for further studies.
3.3 Derivatization procedure
Into a series of 10 mL volumetric flasks were added 1 mL of CF3 enone solution of fixed concentration and 1 mL of hydrazine solution (or MMH or UH25) in the concentration range of 0.2 M to 0.4 mM. The solution was mixed thoroughly and was kept aside for 5 min to ensure the completion of the reaction at RT. This solution (injection volume-2 μL) is injected into a SE-30 column. Duplicate is also performed for the determination of hydrazines.3.4 Analysis of CF3 enone and its hydrazine derivatives by GC-MS
The capillary column used for the detection of CF3 enone and its hydrazine derivatives by GC-MS was the BP-1 MS column. The temperature program was similar to that of a packed column which is explained in Section 3.2. The chromatogram of CF3 enone and its hydrazine derivatives formed after hydrazine addition is shown in Fig. 2. As a similar stationary phase was used for both packed column and capillary column, the peak pattern was found to be similar for the analysis by these columns. When sample solution (obtained after room temperature derivatization with hydrazine) is injected into the column, there is an elution of three peaks. One is due to CF3 enone with retention time (R.T.) – 8.6 min and the other two indicate the derivatives formed after hydrazine addition (R.T. for derivative I: 11.87 min) (R.T. for derivative II: 14.06 min). Mass spectra of CF3 enone and its hydrazine derivatives I and II are shown in Fig. 1, S5 (of the ESI†) and 3 respectively.3.5 Determination of hydrazine by GC based on CF3 enone and its hydrazine derivative
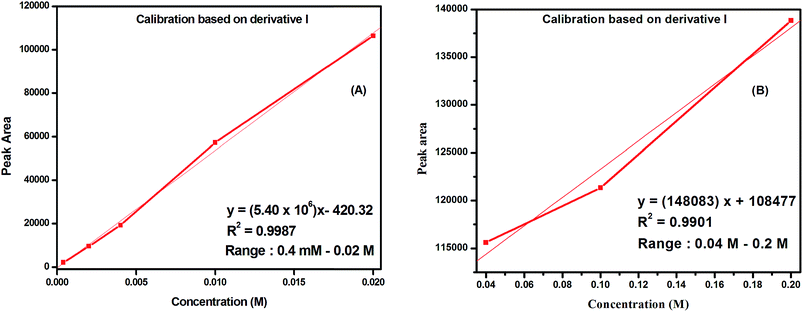
Based on this observation, calibration methods have been established for the determination of trace level hydrazine. Calibration graphs of peak areas of CF3 enone versus concentrations were plotted (in two ranges – shown in Fig. 6A and B). As the change in the area of CF3 enone is in the decreasing order for increase in the concentration of hydrazine, a negative trend is observed for the calibration plot based on CF3 enone. Calibration graphs of peak areas of the CF3 enone derivative (pyrazolidine) versus concentrations were plotted (in two ranges – shown in Fig. S9A and B of the ESI†). Each point on the curve is the mean of two injections.
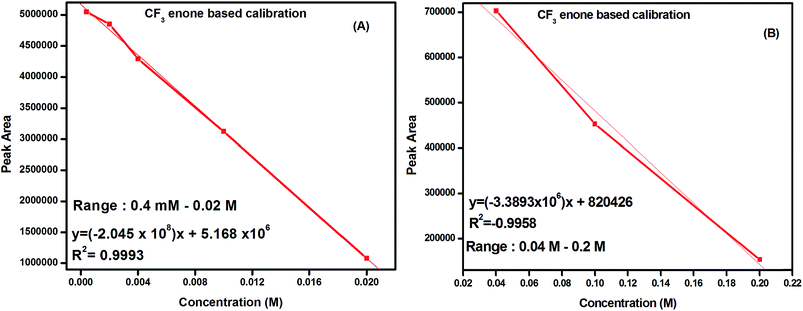 | ||
| Fig. 6 Calibration graphs for the determination of hydrazine based on CF3 enone in the concentration range of 0.4 mM–0.02 M (A) and 0.04 M–0.2 M (B). | ||
The regression equations with correlation coefficients are given in their respective curves which indicate best linearity. The limit of detection (LOD) measured with a signal-to-noise ratio of 3![[thin space (1/6-em)]](https://www.rsc.org/images/entities/char_2009.gif) :
:![[thin space (1/6-em)]](https://www.rsc.org/images/entities/char_2009.gif) 1 was found to be 20 μM. The relative standard deviation (R.S.D) for five replicate determinations of the pyrazolidine derivative obtained from 0.02 M hydrazine using CF3 enone is 0.7%. The same derivative sample was analyzed by three different analysts to see the analyst bias. Intra-day variations (n = 3) in terms of the peak areas and R.T.s were measured for the same and the RSD was found to be 0.5–1.5% for both.
1 was found to be 20 μM. The relative standard deviation (R.S.D) for five replicate determinations of the pyrazolidine derivative obtained from 0.02 M hydrazine using CF3 enone is 0.7%. The same derivative sample was analyzed by three different analysts to see the analyst bias. Intra-day variations (n = 3) in terms of the peak areas and R.T.s were measured for the same and the RSD was found to be 0.5–1.5% for both.
3.6 Determination of MMH by GC based on CF3 enone and its MMH derivatives
3.7 GC MS analysis of CF3 enone and its UH25 derivative
The procedure adopted for the determination of hydrazine was followed by replacing hydrazine with UH25 and the observations were recorded. Addition of UH25 in the concentration range of 0.4 mM to 0.2 M leads to the formation of derivatives similar to hydrazine. When the derivative sample solution is injected into the column, there is an elution of four peaks. One is due to CF3 enone (retention time – 8.6 min) and another two peaks indicate the derivatives formed after UH25 addition. Retention times of these peaks match with those of hydrazine derivatives. This indicates that the derivatives formed from UH25 are mainly due to hydrazine.3.8 Determination of hydrazine (in UH25) by GC based on CF3 enone and its UH25 derivative
Regression equations with correlation coefficients are given in the respective figures. The best linearity was observed similar to hydrazine and MMH trials. The limit of detection (LOD) obtained from practical trials is 20 μM. The R.S.D for five replicate determinations of pyrazolidine obtained from 0.02 M UH25 using CF3 enone is 0.5%. The derivative sample was analysed by three different analysts to see the analyst bias. Intra-day variations (n = 3) in terms of the R.T. and the peak area were measured for the same and the RSD was found to be 0.5–1.2%.
3.9 Application of the method
To evaluate the analytical applicability of the method, the proposed procedure was applied for determination of hydrazines by a standard addition method in acetonitrile medium. As a result, a known amount (in two different trials) of hydrazine, MMH and UH25 was spiked into solution with known concentrations. The results (shown in Table 2) confirm the reliability of the proposed method.| Hydrazine | MMH | Hydrazine in UH25 | ||||||
|---|---|---|---|---|---|---|---|---|
| Takena (mg mL−1) | Addeda (mg mL−1) | Found + RSD% | Takena (mg mL−1) | Addeda (mg mL−1) | Found + RSD% | Takena (mg mL−1) | Addeda (mg mL−1) | Found + RSD% |
| a mg mL−1 of respective hydrazine added to CF3 enone; n = no. of determinations for particular concentrations tried. | ||||||||
| 3.3 | 1.1 | 4.4 ± 0.05 | 2.45 | 0.91 | 3.36 ± 0.05 | 2.2 | 1.1 | 3.3 ± 0.03 |
| 2.2 | 1.2 | 3.4 ± 0.03 | 4.67 | 0.45 | 5.12 ± 0.04 | 1.2 | 3.3 | 4.5 ± 0.05 |
To study the selectivity of the procedure, the effect of different amines such as methyl amine, butyl amine, dibutyl amine, triethyl amine and aniline on the determination of 0.02 M hydrazine and MMH was tested under established conditions. This effect was investigated by adding a known amount of the test species in the concentration range of up to 0.4 mM to the hydrazine and MMH derivative solutions obtained from 0.02 M of respective hydrazine. Tolerance is considered as the interferent concentration that produces an error smaller than 5% in the analyte determination. The tolerance limits for all the above amines is less than 0.01 mM which shows that the method has a good tolerance level for tested amines.
4 Conclusions
An accurate and reliable GC method has been developed to determine the concentration of hydrazines in an organic medium. The method is simple, single step, selective, sensitive, reproducible and rapid in comparison to other derivatization methods. An excellent linear relationship between the concentration of CF3 enone and its derivatives (with hydrazine, MMH and hydrazine in UH25) with respect to the FID response was demonstrated with a minimal detectable concentration of 10 μM. Unlike other GC based derivatization methods, determination of hydrazines by this method can be carried out not only with respect to derivatives but also the derivatizing agent. Moreover, it provides strong supporting evidence for the previous findings. This method has the following other advantages also. (a) There is no catalyst requirement, (b) advantage of room temperature application, (c) less concentration of CF3 enone (20 mM) is sufficient, (d) selective for hydrazine in UH25, (e) if CF3 enone is used as a liquid chemosorbent in chemosorption tubes to determine the concentration of hydrazine in air, there will be no need for time consuming and cumbersome steps such as desorption and derivatization, and (f) incorporation of the CF3 enone functional group into other heterocyclic compounds such as carbazole where there is a possibility of attaching at more than one position or oligomers and conjugated polymers with such functional groups will lead to enhancement of reactivity towards hydrazines. This present manuscript forms the basis for such an improved selective detection of hydrazines.Acknowledgements
One of the authors (Mr S. Selvakumar) wishes to acknowledge the support rendered by Dr T. V. Ramana Reddy, Manager/CTL, Dawn Raju, colleague at CTL, P. Alagesan, Instruments care, Chennai and Senthamizh selvan, IFF, Chennai during this study and acknowledges the constant encouragement from Dr M. Y. S. Prasad, Director, SDSC-SHAR Centre and Prof. Dr Asit Baran Mandal, Director, CSIR-CLRI, Chennai.References
- S. Garrod, M. E. Bollard, A. W. Nicholls, S. C. Connor, J. Connelly, J. K. Nicholson and E. Holmes, Chem. Res. Toxicol., 2005, 18, 115 CrossRef CAS PubMed.
- E. W. Schmidt, Hydrazine and Its Derivatives: Preparation, Properties, Applications, Wiley-Interscience, 2001, vol. 1 Search PubMed.
- H. Yang, J. Wan, H. Shu, X. Liu, R. S. Lakshmanan, R. Guntupalli, W. Howard, J. Hu and B. A. Chin, Sensors Hand book, Mc Graw-Hill Publishing, New York, 2009, vol. 38, p. 761 Search PubMed.
- H. W. Schiessl and I. K. Othmer, Encyclopedia of Chemical Technology, Wiley publishers, New York, 3rd edn, 1980 Search PubMed.
- S. Selvakumar, N. Sridharan and K. Audisesha Reddy, Report on analysis of carbon dioxide in Hydrazine by GC method - ISRO- SHAR-01-R-TR-054-2006 Search PubMed.
- S. Selvakumar, N. Somanathan and K. Audisesha Reddy, Propellants, Explos., Pyrotech., 2013, 38, 176 CrossRef CAS.
- S. Selvakumar, N. Somanathan and K. Audisesha Reddy, Def. Sci. J., 2014, 64, 33 CrossRef.
- S. Selvakumar, N. Somanathan and K. Audisesha Reddy, RSC Adv., 2014, 4, 27404 RSC.
- S. Wang, L. Du, A. Zang and D. Liu, Mikrochim. Acta, 2000, 134, 167 CrossRef CAS.
- V. D. Mitic, S. D. Nikolic and V. P. S. Jovanovic, Cent. Eur. J. Chem., 2010, 8, 559 CrossRef CAS PubMed.
- L. Cui, Z. Peng, C. Ji, J. Huang, D. Huang, J. Ma, S. Zhang, X. Qian and Y. Xu, Chem. Commun., 2014, 50, 1485 RSC.
- M. H. Lee, B. Yoon, J. S. Kim and J. L. Sessler, Chem. Sci., 2013, 4, 4121 RSC.
- J. Li, J. Liu, J. W. Y. Lam and B. Z. Tang, RSC Adv., 2013, 3, 8193 RSC.
- M. Sun, J. Guo, Q. Yang, N. Xiao and Y. Li, J. Mater. Chem. B, 2014, 2, 1846 RSC.
- J. Zhao, Y. Xu, H. Li, A. Lu and S. Sun, New J. Chem., 2013, 37, 3849 RSC.
- D. Y. Qu, J. L. Chen and B. Di, Anal. Methods, 2014, 6, 4705 RSC.
- Z. Zhao, G. Zhang, Y. Gao, X. Yang and Y. Li, Chem. Commun., 2011, 47, 12816 RSC.
- S. Goswami, K. Aich, S. Das, S. B. Roy, B. Pakhira and S. Sarkar, RSC Adv., 2014, 4, 14210 RSC.
- L. A. Dee, Anal. Chem., 1971, 43, 1416 CrossRef CAS.
- M. Y. Khuhawar and L. A. Zardari, J. Food Drug Anal., 2006, 14, 323 CAS.
- S. Forrow, S. Ghatineh, G. J. Langley and J. A. Timbrell, J. Chromatogr., Biomed. Appl., 1992, 573, 227 CrossRef.
- H. Bakker, A. Martijn and R. H. Schreuder, Pestic. Sci., 1983, 14, 470 CrossRef CAS.
- E. E. Sotnikov and A. S. Moskovkin, J. Anal. Chem., 2006, 61(2), 129 CrossRef CAS.
- S. A. Savchuk, E. S. Brodskii and A. A. Formanovskii, J. Anal. Chem., 1998, 53, 668 CAS.
- M. Y. Khuhawar and L. A. Zardari, Anal. Sci., 2008, 24, 1493 CrossRef CAS.
- M. Sun, L. Bai and D. Q. Li, J. Pharm. Biomed. Anal., 2009, 49, 529 CrossRef CAS PubMed.
- J. A. Oh, J. H. Park and H. S. Shin, Anal. Chim. Acta, 2013, 769, 79 CrossRef CAS PubMed.
- D. Smolenkov, Res. Rev.: J. Chem., 2012, 2, 329 CrossRef.
- R. S. Smirnov, A. D. Smolenkov, T. A. Bolotnik and O. A. Shpigun, J. Anal. Chem., 2013, 68, 837 CrossRef CAS.
- D. Smolenkov, A. V. Chernobrovkina, R. S. Smirnov and O. A. Shpigun, J. Anal. Chem., 2012, 67, 360 CrossRef.
- G. Elias and W. F. Bauer, J. Sep. Sci., 2006, 29, 460 CrossRef CAS.
- H. Kataoka, J. Chromatogr. A, 1996, 733, 19 CrossRef CAS.
- N. K. Jagota, A. J. Chetram and J. B. Nair, J. Pharm. Biomed. Anal., 1998, 16, 1083 CrossRef CAS.
- D. T. Fortin and R. Chen, J. Chromatogr. Sci., 2010, 48, 299 CAS.
- V. G. Nenajdenko, A. V. Sanin and E. S. Balenkova, Molecules, 1997, 2, 186 CrossRef CAS PubMed.
- V. G. Nenajdenko, A. V. Sanin and E. S. Balenkova, Zh. Org. Khim., 1995, 31, 786 Search PubMed.
- V. G. Nenajdenko and E. S. Balenkova, ARKIVOC, 2011, 2011, 246 CrossRef.
- A. V. Sanin, V. G. Nenajdenko, V. S. Kuz'min and E. S. Balenkova, Chemistry of heterocyclic compounds, 1998, vol. 34, p. 558, no. 5, 1998 Search PubMed.
- M. V. R. Reddy, V. K. Billa, V. R. Pallela, M. R. Mallireddigari, R. Boominathan, J. L. Gabriel and E. P. Reddy, Bioorg. Med. Chem., 2008, 16, 3907 CrossRef CAS PubMed.
- J. W. Pavlik, T. I. N. Ayudhya and S. Tantaynon, J. Het. Chem., 2002, 39, 1025 CrossRef CAS.
- T. Eicher, S. Hauptmann, A. Speicher, The chemistry of heterocycles, Wiley-VCH GmbH and Co. KGaA, Weinheim, Germany, 2003, p. 186 Search PubMed.
- M. A. P. Martins, G. P. Bastos, A. P. Sinhorin, N. E. K. Zimmermann, A. Rosa, S. Brondani, D. Emmerich, H. G. Bonacorso and N. Zanatta, J. Fluorine Chem., 2003, 123, 249 CrossRef CAS.
- T. A. Nigst, A. Antipova and H. Mayr, J. Org. Chem., 2012, 77, 8142 CrossRef CAS PubMed.
- S. Selvakumar, T. V. Ramana reddy, K. Audisesha Reddy and M. C. Dathan, Determination of isomer ratios of IPDI by GC, Sixth international conference – HEMCE, Chennai, 2007 Search PubMed.
Footnote |
| † Electronic supplementary information (ESI) available: Column selection procedure, fragmentation patterns, graphs showing the effect of concentrations and mass spectra. See DOI: 10.1039/c4an01648c |
| This journal is © The Royal Society of Chemistry 2015 |

