A rapid DNA lateral flow test for the detection of transgenic maize by isothermal amplification of the 35S promoter
Claudia
Kolm
a,
Robert L.
Mach
b,
Rudolf
Krska
c and
Kurt
Brunner
*a
aVienna University of Technology – Institute of Chemical Engineering, IFA-Tulln, Center for Analytical Chemistry, Konrad Lorenz Str. 20, 3430 Tulln, Austria. E-mail: kurt.brunner@tuwien.ac.at
bVienna University of Technology – Institute of Chemical Engineering, Gene Technology Group, Gumpendorfer Str. 1a, 1060 Vienna, Austria
cUniversity of Natural Resources and Life Sciences Vienna – Department IFA-Tulln, Center for Analytical Chemistry, Konrad Lorenz Str. 20, 3430 Tulln, Austria
First published on 28th October 2014
Abstract
The present study describes an isothermal DNA amplification method combined with a rapid visual signal read-out for the detection of the 35S promoter, a regulatory element commonly found in GM plants and often used for screening of genetically modified crops. The amplification of the target sequence is accomplished by helicase-dependent amplification (HDA), which can be entirely performed on a simple heating block, within 60 min reaction time and without costly instrumentation. For visualisation of the amplified products, a nucleic acid lateral flow immunostrip is applied, which enables the detection of the formed products within 5–10 min and simply by naked eye. The specificity and sensitivity of the developed assay were tested and determined by analysing certified reference materials of MON810, Bt11 and NK603. The obtained limit of detection is 0.5% GM content, which fulfils the European demands for mandatory labelling of any food and feed that contains more than 0.9% GM components.
Introduction
Genetically modified (GM) crops have seen rapid and widespread adoption since their commercial introduction. Hence, many countries introduced regulations and thresholds for labelling. In 2003 the European Union implemented a mandatory labelling for any food containing more than 0.9% genetically modified organisms (GMO) and their derivatives.1 This is still one of the most stringent legislation worldwide.So far, the polymerase chain reaction (PCR) technology is the first choice method to fulfil GMO testing demands. In order to cope with the high number of GM events to be tested, PCR screening methods – as the first step of GMO testing – aim to detect commonly used regulatory elements (e.g. promoters and terminators) introduced along with the gene of interest.2–7 In particular, the Cauliflower Mosaic Virus 35S promoter (P35S) is therefore a prominent target due to its high prevalence in transgenic crops.8 Although PCR offers high specificity and sensitivity, it requires expensive instrumentation such as a thermocycler and it is unfit for on-site applications.
Isothermal DNA amplification methods, such as the helicase-dependent amplification (HDA) are a promising alternative to current PCR technology. Originally developed by Vincent et al.,9 HDA is based on the use of a DNA helicase that separates enzymatically complementary DNA template strands along the amplification reaction. Thus forward and reverse primers can hybridize to the target sequence, which is then extended by a DNA polymerase.
We have recently published a successful HDA-based assay for the detection of the 35S promoter in transgenic maize.10 It was shown HDA is able to detect reliably 0.5% MON810, 1% Bt11 and 1% NK603 within 90 min reaction time. However, what limits its on-site application is the visualisation of the generated target copies on an agarose gel. A rapid visual detection by the use of an intercalating dye (SYBR® Green I) to stain amplified products after HDA reaction led to false-positive results since small primer-dimer products were also stained and thus allowed no differentiation between GM and non-GM samples.
To overcome these limitations, other HDA-based assays detecting various pathogenic organisms but also PCR-based assays used different forms of nucleic acid lateral flow immunoassays (NAFLIA).11–15 Beside the simple test procedure and instrument-free detection, formats and set-ups of NAFLIA can perfectly be adapted to the analyte of interest.16
In the present work we aimed to modify and optimize a HDA-based P35S assay for the detection with a nucleic acid lateral flow immunostrip to simplify the determination of amplification products. Our approach relies on the labelling of HDA primers with digoxigenin (DIG) and biotin (BioTEG), respectively, which produces double-stranded DNA amplification products carrying both labels. An antibody testline captures DIG, attached to one end of the amplification product, while biotin on the other end binds to streptavidin-coated gold nanoparticles. A coloured signal is only obtained in the presence of amplified target molecules. Hence, the herein described test procedure enables a faster and more sensitive detection of transgenic maize than the assay previously published.
Experimental
Reagents and apparatus
Certified reference materials of GM maize lines (MON810, Bt11 and NK603) were obtained from the Joint Research Centre, Institute for Reference Materials and Measurements (Geel, Belgium).IsoAmp® II Universal tHDA Kit was purchased from New England Biolabs (Ipswich, MA, USA). All primers, streptavidin-coated gold nanoparticles (20 nm), Tween-80, bovine serum albumin (BSA) and mineral oil were obtained from Sigma-Aldrich (St Louis, MI, USA). Sheep anti-digoxigenin antibody was purchased from Roche Diagnostics (Rothkreuz, Switzerland). Kapa™ SYBR Fast, agarose and loading dye were purchased form Peqlab (Erlangen, Germany). Ultra-low range DNA ladder (0.01–0.3 kb) and SYBR Gold stain were obtained from Invitrogen (Carlsbad, CA, USA). Common buffer components were obtained from Roth (Karlsruhe, Germany).
HDA primers used in this study are listed in Table 1. The target region to be amplified for the specific detection of the 35S promoter was published for the use in PCR17,18 and only recently used for a HDA assay.10 However, for lateral flow immunostrip application the primers were labelled and the forward primer was modified to optimize the annealing. Reference PCR primers for P35S were used as reported and validated previously.4
| Name | Sequence (5′–3′) | 5′ Label | Amplicon | Annotation | |
|---|---|---|---|---|---|
| Original HDA assay – ref. 10 | H35S-F | ATTGATGTGATATCTCCACTGACGT | — | 101 bp | Originate from ref. 17 and 18 – PCR application |
| H35S-R | CCTCTCCAAATGAAATGAACTTCCT | — | |||
| Modified HDA assay for strip test application | H35S-F_m | TGATGTGATATCTCCACTGACGTAAG | DIG | 99 bp | Labelled & developed in this study |
| H35S-R | CCTCTCCAAATGAAATGAACTTCCT | BioTEG | Labelled |
HDA reactions were carried out on an Eppendorf Thermomixer Plus (Eppendorf, Hamburg, Germany). Electrophoresis equiment and Gel Doc Imaging System were purchased from Biorad (Hercules, CA, USA). PCR reactions were performed on a 7500 Fast Real-Time PCR system (Applied Biosystem, Grand Island NY, USA).
DNA extraction
DNA was extracted from certified reference materials with defined contents of GM maize by using an optimized cetyltrimethylammonium bromide protocol.19 NanoVue Plus spectrophotometer (GE Healthcare, Little Chalfont, UK) was used for the control of DNA quality and quantity.HDA reaction
The HDA-based P35S detection assay was performed as previously published by Zahradnik et al.10 with some modifications. In brief, HDA reactions were carried out in a total volume of 25 μL following a two-step protocol. Therefore, 12.5 μL of mix A containing 1× annealing buffer II, 300 nM each primer and 1 μL DNA (concentration 40 ng μL−1) was overlaid with mineral oil (Sigma-Aldrich, St Louis, MI, USA) and heated at 95 °C for 4 min for initial target DNA denaturation. Subsequently, reactions were equilibrated at 65 °C for 3 min followed by addition of mix B, containing 1× annealing buffer II, 8 mM MgSO4, 80 mM NaCl, 3.5 μL IsoAmp® dNTP solution and 3.5 μL IsoAmp® enzyme mix. The reaction mixtures were incubated at 65 °C for 60 min. All reactions were entirely performed on a heating block.Amplification products were verified by transferring 5 μL aliquots on a 2.5% agarose gel stained with SYBR Gold.
Nucleic acid lateral flow immunostrip
Laminated cards (ref. HF000MC100), nitrocellulose membranes (ref. HF09002XSS), glass fibre pads (ref. GFCP103000) and cellulose fibre pads (ref. CFSP173000) used to assemble the test strip were obtained from Millipore (Billerica, MA, USA). A Biojet Sprayer from Bio DOT (Irvine, CA, USA) was used for the immobilization of the antibody testlines.The lateral flow strips (6 mm × 50 mm) consisted of a conjugate pad, a laminated nitrocellulose membrane and an absorbent pad. Prior to assembly, the sheep anti-digoxigenin antibody testline was sprayed (anti-DIG, 200 ng cm−1, i.e. 120 ng per 6 mm strip) on the nitrocellulose membrane and dried over night in a desiccator at room temperature. Conjugate and absorbent pads were assembled with 2 mm overlapping between each component and the assembled master card was cut into 6 mm wide strips. The strips were stored in a desiccator at room temperature.
Before applying the sample on the lateral flow strip, 5 μL of the HDA reaction volume was added to 75 μL running buffer [0.5 M PB, pH 8, 1% (w/v) BSA, 0.1% (v/v) Tween-80] and 20 μL streptavidin-coated gold-nanoparticles in a new tube. From this mixture, 20 μL were then applied to the conjugate pad and the strip was placed into 250 μL of running buffer. Positive results were visualized as red lines with the naked eye within 5–10 min.
Real-time PCR reaction
Real-time PCR reactions were performed to confirm the results obtained from HDA. One microliter of DNA extract (concentration 40 ng μL−1) was added to 14 μL of reaction mix containing Kapa™ SYBR Fast, primers (concentration 0.1 μM each, if not stated otherwise) and water. PCR conditions were as follows: 2 min at 95 °C for initial denaturation, followed by 45 cycles of 15 s at 95 °C and 1 min at 60 °C.Results and discussion
Development of the lateral flow immunostrip test for the detection of HDA products
The focus of this study was to simplify the visual detection of amplification products by adapting a HDA-based P35S detection assay to a nucleic acid lateral flow immunostrip, whose principle is shown in Fig. 1. To our knowledge, it is the first HDA-application to detect the 35S promoter of GM maize in combination with a lateral flow strip test.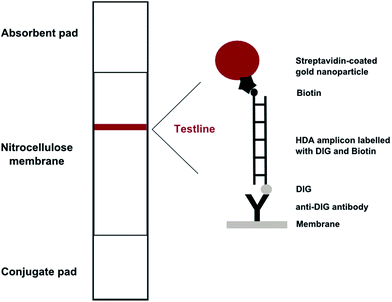 | ||
| Fig. 1 Schematic illustration of the assembly and the principle of the nucleic acid lateral flow immunostrip used in this study for the visual detection of HDA-derived products. | ||
The experimental set-up and results, given in Table 2 revealed no amplification when combining biotinylated forward primer (H35S-F) with DIG-labelled reverse primer (H35S-R) or DIG-labelled H35S-F and biotinylated H35S-R. We observed that labels (either biotin or DIG) on the forward primer (H35-F) affected the amplification whereas labels on the reverse primer (H35-R) left HDA unaffected. This was demonstrated when using only one labelled primer within the HDA reaction, while using the other primer unlabelled.
Attempts with increased and decreased HDA reaction temperatures (63–67 °C) did not improve the amplification (data not shown).
However, in contrast to HDA assays, the conventional PCR reactions with labelled HDA primers showed overall positive amplification of P35S target sequence. Additionally, amplification efficiency did not differ significantly compared to unlabelled primers (data not shown).
Since the negative results were forward primer label-specific we slightly modified the sequence of the primer H35-F. We removed the first two bases (AT) and added three target specific bases at the 3′ end (AAG), to keep the melting temperature close to 65 °C. This modified forward primer (named as H35S-F_m) was then labelled with DIG and tested in HDA, using BioTEG-labelled H35S-R as reverse primer. The modification of the sequence of the forward primer had significant effects on the outcome of the reaction. Experiments performed with H35S-F_m (DIG labelled) and H35-R (BioTEG-labelled) showed superior amplification results, in HDA and PCR reactions.
We assume the labelling of the forward primer affected the enzymes used in HDA, the helicase or the DNA polymerase, as they are essential for the amplification reaction. The following facts may support our assumption: first, failure of the amplification process only occurred in HDA; conventional PCR reactions were entirely unaffected by labelling. Although HDA follows a PCR-like reaction scheme – flanking a target sequence with two primers – it differs significantly in its main components from PCR. HDA uses a thermostable UvrD helicase and a thermostable exonuclease-deficient DNA polymerase, which are provided as “IsoAmp® enzyme mix”. Unlike HDA, the conventional PCR uses thermal cycling to separate target strands and Taq-polymerase to extend the two primers. Second, HDA is more sensitive to defined parameter settings concerning primer design and amplicon selection. Explicitly recommended annealing temperatures, lengths and GC contents for primer and target regions are crucial in order to guarantee optimal amplification.20
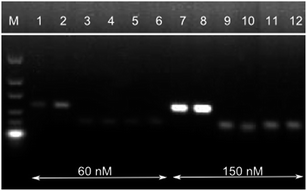
A primer concentration of 150 nM revealed the most efficient product amplification (Fig. 2). Along with the increased amount of P35S-specific HDA product, also an increase in low molecular weight by-products was observed (0% MON810 and no template control). These products are non specific as they are also detected for the negative control and may result from primer-dimers/oligomers that arise due to the isothermal amplification conditions. As in PCR reactions, they are amplified with similar efficiencies as the target sequence once they are formed. Attempts to eliminate these by-products by adjusting the reaction temperature and the MgCl2 concentration were unsuccessful (data not shown). However, we assume these unspecific products to be homo-dimers/oligomers of one particular primer (i.e. carrying uniform labels) since these by-products do not carry both label molecules and therefore give no signal on the lateral flow strip as shown below. Thus the detection of P35S-specific target copies on the lateral flow immunostrip is not affected negatively by these primer by-products.
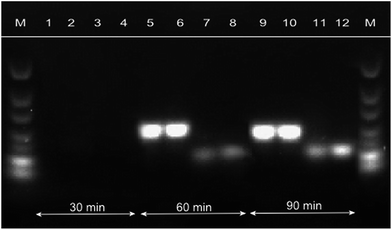
In addition, the reaction time significantly decreased by the increase of the primer concentrations; same was reported by Montré et al.21 As shown in Fig. 3, HDA with primer concentrations of 150 nM can be accomplished in 60 min instead of 90 min, as described by Zahradnik et al.10 Hence, all further experiments were performed with primer concentrations of 150 nM.
The antibody testline concentration and running buffer conditions were mainly derived from a previously reported NAFLIA assay14 and slightly adjusted. Testlines were generated by immobilizing the anti-DIG antibody in a concentration of 120 ng antibody per strip, which was sufficient to obtain intense coloured testlines.
Performance of the lateral flow immunostrip test for the detection of P35S-specific HDA products
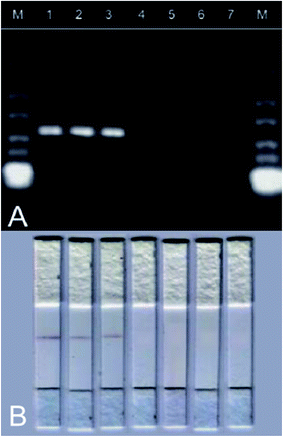
The HDA-strip combination revealed a reliable detection of transgenic maize (5 out of 5 replicates for all tested GM maize lines) and gave no positive result in case of non-GM maize and no-template controls (0 out of 5 replicates). This was equivalent to the results obtained from HDA combined with subsequent gel electrophoresis (Fig. 4). Furthermore, results were confirmed by real-time PCR (data not shown). Thus the HDA-based P35S strip assay is capable to differentiate between GM and non-GM maize.
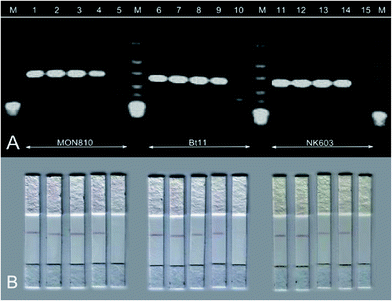
The HDA-strip combination revealed a limit of detection of 0.5% GM content for all tested certified reference materials (5 out of 5 replicates). These results were similar to HDA combined with gel electrophoresis, see Fig. 5. Hence, the HDA-based P35S strip assay is able to detect concentrations below 0.9%, which is the demanded GMO threshold level of the European Union for food labelling.
Conclusion
The proposed combination of HDA with a nucleic acid lateral flow immunostrip offers considerable advantages compared to the previously published format with agarose gel detection of amplified products. It facilitates a user-friendly detection and significantly speeds up the testing procedure (80 min for the agarose gel, in contrast only 5–10 min for the strip test). Additionally, we were able to reduce the reaction time of the P35S-HDA assay itself by optimizing the primer concentrations. This makes it possible to perform the entire assay within 70 min – from the amplification of P35S target copies to visual detection via the strip. Furthermore, it was shown that this method specifically distinguishes GM from non-GM maize and offers sensitive detection of transgenic maize without sophisticated and costly equipment. A summary of enhancements is given in Table 3.| Modified HDA assay with strip detection | Previous HDA assay with gel detection10 | |
|---|---|---|
| Detection limit | ||
| MON810 | 0.5% | 0.5% |
| Bt11 | 0.5% | 1% |
| NK603 | 0.5% | 1% |
| Time to amplify the P35S-target sequence | 60 min | 90 min |
| Time to detect/visualize the amplified products | 5–10 min | 80 min |
| Required laboratory equipment | Heating block; strip | Heating block; electrophoresis station, UV transilluminator, photosytem |
| On-site applicability | Yes | No |
We like to emphasize the described HDA-based P35S strip assay is a model to demonstrate the potential of an isothermal DNA amplification method in terms of its on-site applicability to detect the 35S promoter of transgenic maize. However, for prototyping and future commercial application as a rapid GMO screening method, internal amplification controls need to be included as a control line on the strip to verify the results (herein accomplished by agarose gel). Therefore, co-amplification of an endogenous maize gene (e.g. zein8) may be favourable.
Acknowledgements
This work was supported by the state of Lower Austria in cooperation with the European Regional Development Fund.References
- Regulation (EC) no. 1829/2003, Off J. Eur. Union, 2013, L 268/1.
- E. Anklam, F. Gadani, P. Heinze, H. Pijnenbur and G. Van den Eede, Eur. Food Res. Technol., 2002, 214, 3–26 CrossRef CAS.
- M. Höhne, C. R. Santisi and R. Meyer, Eur. Food Res. Technol., 2002, 215, 59–64 CrossRef PubMed.
- H. Waiblinger, B. Ernst, A. Anderson and K. Pietsch, Eur. Food Res. Technol., 2008, 226, 1221–1228 CrossRef CAS.
- V. T. Forte, A. Di Pinto, C. Martino, G. M. Tantillo, G. Grasso and F. P. Schena, Food Control, 2005, 16, 535–539 CrossRef CAS PubMed.
- E. Barau-Piednoir, A. Lievens, G. Mbongolo-Mbella, N. Roosens, M. Sneyers, A. Leudna-Casi and M. Van den Bulcke, Eur. Food Res. Technol., 2010, 230, 383–393 CrossRef PubMed.
- I. Scholtens, E. Laurensse, B. Molenaar, S. Zaaijer, H. Gaballo, P. Boleij, A. Bak and E. Kok, J. Agric. Food Chem., 2013, 61, 9097–9109 CrossRef CAS PubMed.
- A. Holsten-Jensen, S. Ronning, A. Lovsetz and K. Berdal, Anal. Bioanal. Chem., 2003, 375, 985–993 Search PubMed.
- M. Vincent, Y. Xu and H. Kong, EMBO Rep., 2004, 5, 795–800 CrossRef CAS PubMed.
- C. Zahradnik, C. Kolm, R. Martzy, R. L. Mach, R. Krska, A. H. Farnleitner and K. Brunner, Anal. Bioanal. Chem., 2014, 406, 6835–6842 CrossRef CAS PubMed.
- W. H. Chow, C. McCloskey, Y. Tong, L. Hu, Q. You, C. P. Kelly, H. Kong, Y. W. Tang and W. Tang, J. Mol. Diagn., 2008, 10, 452–458 CrossRef CAS PubMed.
- H. J. Kim, Y. Tong, W. Tang, L. Quimson, V. A. Cope, X. Pan, A. Motre, R. Kong, J. Hong, D. Kohn, N. S. Miller, M. D. Poulter, H. Kong, Y. W. Tang and B. Yen-Lieberman, J. Clin. Virol., 2011, 50, 26–30 CrossRef CAS PubMed.
- J. Goldmeyer, H. Li, M. McCormac, S. Cook, C. Stratton, B. Lemieux, H. Kong, W. Tang and Y. W. Tang, J. Clin. Microbiol., 2008, 46, 1534–1536 CrossRef CAS PubMed.
- M. Blazkova, M. Koets, P. Rauch and A. van Amerongen, Eur. Food Res. Technol., 2009, 229, 867–874 CrossRef CAS.
- P. C. Soo, Y. T. Horng, P. R. Hsueh, B. J. Shen, J. Y. Wang, H. H. Tu, J. R. Wei, S. C. Hsieh, C. C. Huang and H. C. Lai, J. Microbiol. Methods, 2006, 66, 440–448 CrossRef CAS PubMed.
- G. A. Posthuma-Trumie, J. Korf and A. van Amerongen, Anal. Bioanal. Chem., 2009, 393, 569–582 CrossRef PubMed.
- T. Matsouka, H. Kuribara, K. Takubo, H. Akiyama, H. Miura, Y. Goda, Y. Kusakabe, K. Isshiki, M. Toyoda and A. Hino, J. Agric. Food Chem., 2002, 50, 2100–2109 CrossRef PubMed.
- H. Kuribara, H. Shindo, T. Matsuoka, K. Takubo, S. Futo, N. Aoki, T. Hirao, H. Akiyama, Y. Goda and M. Toyoda, J. AOAC Int., 2002, 85, 1077–1089 CAS.
- Joint Research Centre, http://gmo-crl.jrc.ec.europa.eu/summaries/3272_DNAExtrReport.pdf, accessed April 2007.
- Biohelix, http://www.biohelix.com/pdf/H0110S_full_version_BH_NG_eDatacard.pdf, accessed October 2013.
- A. Montré, R. Kong and Y. Li, J. Microbiol. Methods, 2011, 84, 343–345 CrossRef PubMed.
- L. M. Liz-Marzon, Langmuir, 2006, 22, 32–41 CrossRef PubMed.
- S. Wang, Y. Quan, N. Lee and R. Kennedy, J. Agric. Food Chem., 2006, 54, 2491–2495 CrossRef CAS PubMed.
- R. Verheijen, P. Stouten, G. Cazemier and W. Haarnot, Analyst, 1998, 123, 2437–2441 RSC.
- B. S. Demulle, S. M. D. G. DeSaeger, L. Sibanda, I. Barna-Vetro and C. H. van Peteghem, J. Agric. Food Chem., 2005, 53, 3364–3368 CrossRef PubMed.
| This journal is © The Royal Society of Chemistry 2015 |

