Double carboxyl silicane modified graphene oxide coated silica composite as sorbent for solid-phase extraction of quarternary alkaloids
Houmei
Liu
ab,
Yong
Guo
a,
Xusheng
Wang
a,
Yikun
Li
c,
Xiaojing
Liang
*a and
Xia
Liu
*a
aKey Laboratory of Chemistry of Northwestern Plant Resources and Key Laboratory for Natural Medicine of Gansu Province, Lanzhou Institute of Chemical Physics, Chinese Academy of Sciences, Lanzhou 730000, China. E-mail: gsliuxia@lzb.ac.cn; xjliang@licp.cas.cn; Fax: +86 931 8277088; Tel: +86 931 4968203
bUniversity of Chinese Academy of Sciences, Chinese Academy of Sciences, Beijing 100049, China
cKey Laboratory of Oil & Gas Production, China National Petroleum Corporation (CNPC), Research Institute of Petroleum Exploration and Development (RIPED), Beijing, 100083, China
First published on 24th October 2014
Abstract
In this paper, a novel sorbent, double carboxyl silicane modified graphene oxide coated silica has been prepared and used as sorbent for solid-phase extraction of quarternary alkaloids. The synthesized sorbent material was characterized by elemental analysis and field emission scanning electron microscopy. The extraction properties of the developed sorbent were evaluated by four quarternary alkaloids: coptisine chloride, sanguinarine, berberine chloride and chelerythrine. Multiple interactions, i.e., electrostatic, hydrogen bonding and dipole–dipole interactions, take place during the extraction. After the optimization of conditions, several parameters, such as volume of sample loading, pH of sample, pH of eluent and sample loading velocity, were set up. Under the optimal conditions, good linearities with R2 ranging from 0.9990 to 0.9995 were obtained for the four compounds. The LODs were found to be in the range of 1–2 μg L−1, and the LOQs were found to be in the range of 2–5 μg L−1. The recoveries of the four quarternary alkaloids spiked with 5 μg L−1 in human urine samples ranged from 89.1% to 110.6% with RSDs in the range of 2.6–10.4%. The results showed that the new sorbent has excellent extraction capacity for the tested quarternary alkaloids.
1. Introduction
Quarternary alkaloids (QAs), the important plant metabolites, have excellent therapeutic effects, such as alleviation of pains and promotion of blood circulation, and they are also antibacterial and anticancer drugs.1–4 QAs have gained increasing popularity in drug development and pharmacological research.5,6 Generally, the contents of QAs in human body are pretty low. Therefore, it is urgent to find a method for the extraction and enrichment of QAs.Solid-phase extraction (SPE) is a powerful sample preparation technique widely used because of its high enrichment factor, low consumption of reagents, rapid separation, and low cost.7–10 The sorbent material is the core of SPE, which determines the enrichment, recovery, selectivity and sensitivity.11 To date, many sorbents, such as silica C18,12 polymeric sorbents,13 and polyurethane foam,14 have been developed. However, the most commonly used sorbent, silica C18, can only be successfully applied to several analytes, which can not satisfactorily extract strongly hydrophilic or charged species such as QAs.15,16 The residual silanol of silica-based stationary phase has strong interaction with alkaline compounds and even produces irreversible adsorption.17,18 Thus, it is meaningful to develop a new SPE adsorbent aiming at the extraction of QAs from real samples.
Graphene, (G) as a novel carbon material, has attracted increasing interest due to its outstanding properties. Firstly, G has a large specific surface area with a theoretical value of 2630 m2 g−1.19 Secondly, the large delocalized π-electron system of G can form a strong π-stacking interaction with compounds containing benzene ring.20,21 Thirdly, the G sheets are relatively soft and flexible so they can easily be attached onto a support.22 Because of these exceptional properties, G is a superior candidate as a sorbent in SPE.5,23–27
Graphene oxide (GO) is an oxidized derivative of G. Besides the excellent properties of G mentioned above, GO also has other attracting features. Due to the presence of various oxygen-containing groups, GO is strongly hydrophilic and water soluble28 and can be easily modified with reactive groups.29 Consequently, we attempt to wrap silica with GO, removing the affecting of residual silanol. Thus, for the extraction of strongly hydrophilic and polar QAs, GO is more suitable than G. Because QAs are positively charged, bare GO can not achieve good enrichment effect. Consequently, proper chemical modification is needed to increase the enrichment effect of QAs.
3-(Triethoxy silicon) propyl succinic anhydride (TSPSA) is a unique silicane possessing two carboxyl groups after a simple hydrolysis.30 Based on the fact that QAs are positively charged, introducing double carboxyl silicane onto GO can further enhance the selectivity of SPE. Double carboxyl silicane not only increases the hydrophilicity and polarity of the sorbent but also enhances the ion-exchange and dipole–dipole interactions. It is possible to attach TSPSA to GO through the reaction between hydroxy group of GO and ethyoxyl of TSPSA, because the direct use of modified GO as SPE sorbent will block the SPE cartridge and make the column bed uneven. Therefore, immobilization of GO onto silica can address the problem.22,31,32
In this study, a novel TSPSA modified GO coated silica composite (TSPSA@GO@SiO2) was prepared and then was hydrolyzed to make a double carboxyl silicane modified graphene oxide coated silica composite (TSPSAcide@GO@SiO2), which was used as the SPE sorbent. At the same time, TSPSAcide modified silica composite was also prepared (TSPSAcide@SiO2). Coptisine chloride (CopC), sanguinarine (Sang), berberine chloride (BerbC) and chelerythrine (Chel) were selected as the model analytes to evaluate the adsorption capacities of the two resulting sorbents. The main parameters, such as type of eluent, pH of sample, pH of eluent, volume of sample loading, volume of eluent, etc., were investigated in detail. Under the optimal conditions, the proposed method for TSPSA@GO@SiO2 was set up and employed for the analysis of human urine samples.
2. Experimental
2.1 Chemicals and materials
3-Aminopropyltriethoxysilane (APTES), TSPSA, N,N-dimethylformamide (DMF) and N,N-dicyclohexylcarbodiimide (DCC) were purchased from the Aladdin Chemical Reagent Co. (Shanghai, China). GO was purchased from Nanoon Co. (Beijing, China). Porous silica particles were synthesized using the polymerization-induced colloid aggregation method in our laboratory with an average diameter of 15 μm, a pore size of 16 nm and a surface area of 150 m2 g−1. SPE cartridges (3 mL) and polyethylene frits (5 μm pore size) were purchased from Shenzhen Biocomma Biotech Corp. (Shenzhen, China). Welchrom® C18 SPE cartridges (200 mg, 3 mL) were purchased from Welch Materials, Inc. (Tianjin, China).All other reagents were of analytical-grade. The analytes (CopC, Sang, BerbC and Chel) selected to evaluate the sorbent were purchased from the Aladdin Chemical Reagent Co. (Shanghai, China). The structures of the four analytes are shown in Fig. 1.
2.2 Instruments
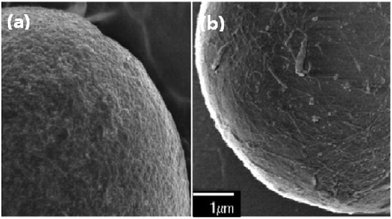
The elemental analysis of aminopropylated silica, GO@SiO2, TSPSAcide@GO@SiO2, TSPSA@GO@SiO2 and TSPSAcide@GO@SiO2 were performed on a Vario EL (Elementar, Germany). The surface morphologies of SiO2 and GO@SiO2 were examined on a TF20 scanning electron microscope (SEM) (FEI, U.S.A). All chromatographic tests were performed on an Agilent 1100 Series modular HPLC system with a UV-Vis detector (Agilent Technologies, U.S.A). The SPE procedure was performed on a HGC-8 numerical control solid phase extraction system (Hegong Scientific Instrument Corp., Shanghai, China).2.3 Preparation of TSPSAcide@SiO2 and TSPSAcide@GO@SiO2 sorbents
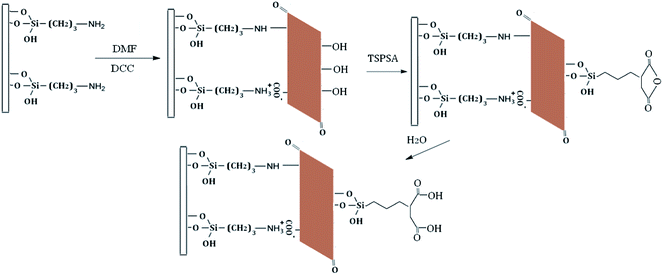
Silica particles were first activated in concentrated hydrochloric acid for 24 h and then repeatedly rinsed with deionized water until the water was neutral. The activated silicas (10.0 g) and an excess of TSPSA (10.0 mL) were suspended in 150 mL of dry toluene. The suspension was mechanically stirred and refluxed for 24 h at 120 °C. The TSPSA modified silica was washed with toluene, ethanol and methanol in turn. Subsequently, the prepared TSPSA@SiO2 was added into 100 mL of mixed solution (20 mL H2O + 80 mL ethanol) for hydrolysis at 60 °C for 2 h. After the reaction, TSPSAcide@SiO2 was washed with deionized water and dried under vacuum for 12 h at 60 °C.The activated silicas (10.0 g) and an excess of APTES (10.0 mL) were suspended in 150 mL of dry toluene. The suspension was mechanically stirred and refluxed for 24 h at 120 °C. Subsequently, the aminopropylated modified silica was washed with toluene, ethanol and methanol in turn. After that, GO (0.10 g) was added to 100 mL of DMF under 2 hours ultrasonic treatment. When GO was well dispersed, 10.0 g of dried aminopropylated silica particles and 0.08 g of DCC were added. Then the mixture was stirred at 30 °C for 24 h for the bonding of GO. Next, GO@SiO2 particles (10 g) and TSPSA (8 g) were added to 150 mL of dry toluene and was continuously stirred for 24 h at 120 °C. Subsequently, the prepared TSPSA@GO@SiO2 was added into 100 mL of mixed solution (20 mL H2O + 80 mL ethanol) for hydrolysis at 60 °C for 2 h. After the reaction, TSPSAcide@GO@SiO2 was washed with deionized water and dried under vacuum for 12 h at 60 °C. A schematic diagram of the synthesis approach for the preparation of TSPSAcide@GO@SiO2 is outlined in Fig. 2.
2.4 Preparation of sample solutions
The stock solutions of QAs were prepared in methanol at a concentration of 1 mg mL−1 for Sang, BerbC and Chel and 0.2 mg mL−1 for CopC and stored at 4 °C. For the optimization of extraction parameters, working solutions were prepared by diluting the stock solutions with deionized water.2.5 Chromatographic conditions
The analytical ODS column (150 mm × 4.6 mm I.D., 5 μm) was packed using the commercial octadecyl-silylated silica purchased from FuShi Corp. (Japan). Mobile phase was composed of 1% triethylamine (TEA) buffer (adjusted to pH 3 by H3PO4) (A) and ACN (B). The mobile phase employed the gradient elution: 0–6 min 25–32% B; 6–9 min 32% B. The flow rate was 1.0 mL min−1 and the column temperature was maintained at 25 °C. The UV-Vis detector wavelength was 345 nm. The injection volume was 20 μL.2.6 Solid-phase extraction procedure
50 mg of the dried TSPSAcide@GO@SiO2 sorbents were packed into empty 3 mL SPE cartridges between two 5 μm polyethylene frits. The sorbents were first conditioned with 5 mL of methanol and 5 mL of water. Then, 70 mL of working solution adjusted to pH 6.0 by HCl was loaded onto the sorbent at a flow rate of 1.6 mL min−1. Then, air was used to dry the sorbent for 5 minutes. The retained analytes were eluted with 1 mL of methanol at pH 2.6 adjusted by formic acid. The desorption solution was collected for the HPLC analysis. In this work, the study was repeated three times and the final data were all average values.At the assessment process of TSPSAcide@SiO2 sorbent, the packing quality is 100 mg, and sample loading velocity is 1.0 mL min−1. Other parameters, such as pH of sample, type of eluent, pH of eluent, volume of eluent and eluent velocity, are the same as those for TSPSAcide@GO@SiO2 sorbent.
2.7 Analysis of human urine sample
The urine sample was collected from a healthy volunteer (25 year old girl). The urine sample was filtered through a 0.45 μm nylon membrane before the SPE procedure and stored at 4 °C. Institutional Review Board approvals were obtained from Lanzhou Institute of Chemical Physics for the analysis of urine samples.3. Results and discussion
3.1 Characterization of the double carboxyl silicane modified graphene oxide coated silica sorbent
| Different particles | Elemental analysis data | ||
|---|---|---|---|
| C (%) | N (%) | H (%) | |
| Aminopropylated silica | 2.98 | 1.35 | 1.19 |
| GO@SiO2 | 4.12 | 0.96 | 0.97 |
| TSPSAcide@SiO2 | 4.01 | — | 1.04 |
| TSPSA@GO@SiO2 | 6.73 | 0.74 | 1.34 |
| TSPSAcide@GO@SiO2 | 6.64 | 0.77 | 1.42 |
3.2. Optimization of SPE parameters of TSPSAcide@GO@SiO2
Owing to the carboxylic acid groups functionalized on the surface of TSPSAcide@GO@SiO2, the surface charge of this sorbent is pH-dependent and affects the extraction efficiencies. As shown in Fig. 5, the recoveries of all these alkaloids dramatically decreased at low and high pH. The possible reason is that, when pH is low, the net negative charge of the sorbent decreased; when pH is high, more alkaloids are in the neutral form. The two main reasons mentioned above will weaken the ion exchange interaction, resulting in the low recoveries at low and high pH. As seen in Fig. 5, the plateaus are pH 5.0–8.5 for CopC and BerbC and pH 4.0–6.0 for Sang and Chel. Overall, pH 6.0 was used in the subsequent study.
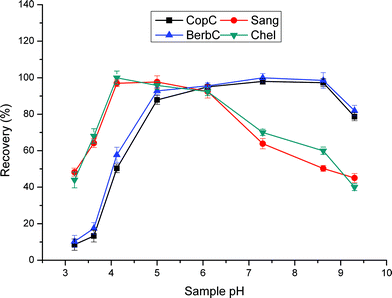 | ||
| Fig. 5 Effect of sample loading pH on extraction efficiency. Sample loading volume is 70 mL. Other parameters are the same as in Fig. 4. | ||
Sample loading velocity is another important factor affecting the adsorption performance. To investigate the effect of sample loading velocity, different velocities: 0.5 mL min−1, 1.0 mL min−1, 1.6 mL min−1, 2.0 mL min−1, 3.5 mL min−1, were used, respectively. As shown in Fig. 6, when the sample loading velocity was less than 1.6 mL min−1, the recoveries differed slightly. As the sample loading velocity increased from 1.6 to 2.0 mL min−1, the recovery decreased dramatically. From these results, we may conclude that when the velocity of sample loading is too fast, the analytes can not make full contact with the sorbents, leading to poor extractions. So, 1.6 mL min−1 was chosen as the optimal sample loading velocity.
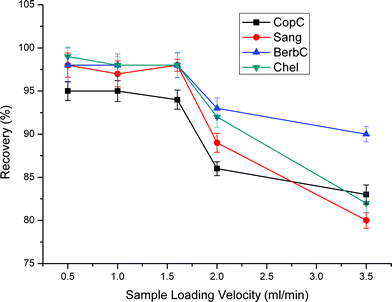 | ||
| Fig. 6 Effect of sample loading velocity on extraction efficiency. Sample loading volume is 70 mL. Other parameters are the same as in Fig. 4. | ||
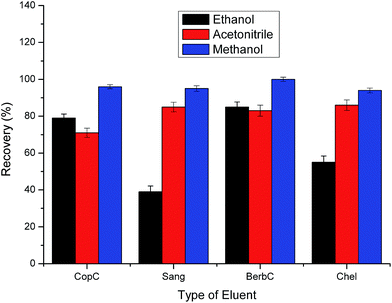 | ||
| Fig. 7 Effect of eluent type on extraction efficiency. Sample loading volume is 70 mL. Other parameters are the same as in Fig. 4. | ||
The recoveries exhibited obvious differences with variation of pH. As seen in Fig. 8, when pH was higher than 2.6, the recoveries for CopC and BerbC began to decrease rapidly, and the changing point for Sang and Chel is pH 3.5. It can be ascribed to the ion exchange interactions. With the increase of the pH of eluent, the ion exchange interactions become weaker, which leads to the low recoveries. In the range of pH 2.0–2.6, the recoveries for the four alkaloids are satisfactory. Strong acidic conditions will prompt the hydrolysis of SiO2, so pH 2.6 was adopted in the following experiments.
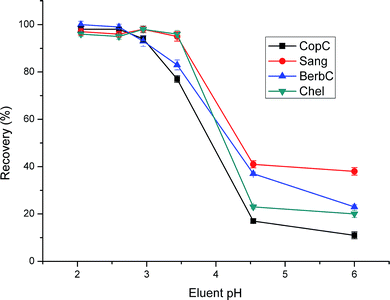 | ||
| Fig. 8 Effect of eluent pH on extraction efficiency. Sample loading volume is 70 mL. Other parameters are the same as in Fig. 4. | ||
The volume of eluent should be sufficient enough to elute all the analytes from the sorbent and it should be as small as possible to increase the enrichment factor. Different elution volumes were investigated as shown in Fig. 9. The results suggest that a further increase of eluent volume from 1.0 to 2.0 mL hardly increase the recoveries. Thus, an elution volume of 1.0 mL is enough to achieve satisfactory recoveries.
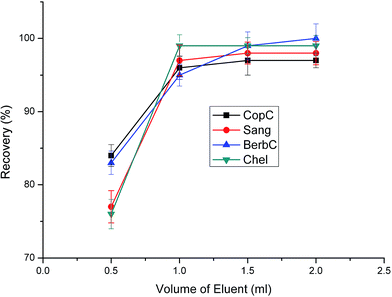 | ||
| Fig. 9 Effect of eluent volume on extraction efficiency. Sample loading volume is 70 mL. Other parameters are the same as in Fig. 4. | ||
As for eluent velocity, an appropriate velocity can exert the best desorption ability. In general, when investigating the effect of eluent velocity on extraction efficiency, the elutive power of eluent is mainly determined by solubility and flush force. The establishment of solubility equilibrium between the eluent and analytes is inversely proportional to the eluent velocity. The flush force of the eluent is proportional to the eluent velocity. Thus, when the eluent velocity is too slow, the flush force is weak. Similarly, when the eluent velocity is too fast, the solubility equilibrium is not well established. From Fig. 10, we can observe that 1.0 mL min−1 is the best among the other three eluent velocities. Finally, 1.0 mL min−1 was chosen as the optimal eluent velocity.
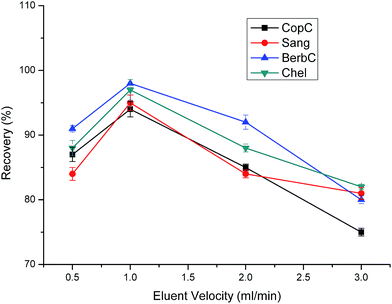 | ||
| Fig. 10 Effect of eluent velocity on extraction efficiency. Sample loading volume is 70 mL. Other parameters are the same as in Fig. 4. | ||
3.3 SPE performance of TSPSAcide@SiO2
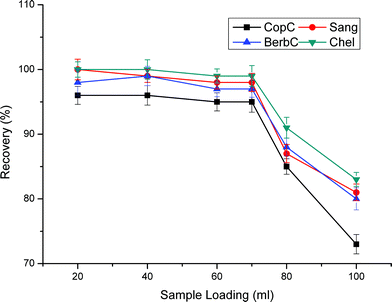
The optimal SPE parameters of TSPSAcide@SiO2 are much the same with TSPSAcide@GO@SiO2. Thus, we conduct the control experiments under the same conditions except that the sample loading velocity is 1.0 mL min−1 in the section. From Fig. 11, it clearly shows that 1.0 mL of eluent is not enough to achieve thorough elution, especially for Sang and Chel. The low recoveries are ascribed to the nonspecific adsorption of the QAs to the sorbent. Although there are bonded TSPSAcides on the surface of SiO2, lots of residual Si–OH still exist, which severely affect the recoveries of QAs. The maximum loading volume for 100 mg of TSPSAcide@SiO2 sorbent is merely 40 mL. Compared with TSPSAcide@GO@SiO2 sorbent, TSPSAcide@SiO2 sorbent has not only low recoveries but also weak extraction capacity.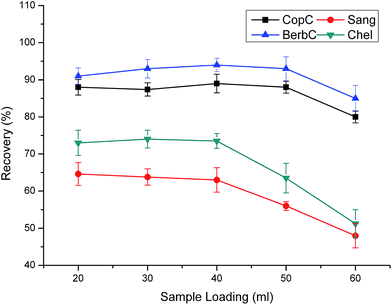 | ||
| Fig. 11 Effect of sample loading volume on extraction efficiency. Sample loading velocity is 1.0 mL min−1. Other parameters are the same as in Fig. 4. | ||
3.4 Comparison with commercial C18 sorbents
The extraction efficiency of Welchrom® C18 and TSPSAcide@GO@SiO2 was compared at concentrations of 10, 50 and 100 μg L−1. The results are shown in Table 2 with mean percentage recoveries and RSD values. From the results, we inferred that the commercial C18 SPE sorbent was not suitable for the extraction of the four QAs. Low recoveries (25.1–75.0%) were observed with Welchrom® C18 at the three concentrations, whereas the recoveries of TSPSAcide@GO@SiO2 were all higher than 95.4%.| Analytes | Welchrom® C18 | TSPSAcide@GO@SiO2 | ||||
|---|---|---|---|---|---|---|
| Spiking (μg L−1) | Spiking (μg L−1) | |||||
| 10 | 50 | 100 | 10 | 50 | 100 | |
| CopC | 67.2 (2.1) | 48.3 (3.6) | 25.1 (2.4) | 95.4 (4.6) | 96.2 (3.5) | 96.3 (5.2) |
| Sang | 73.4 (3.3) | 70.3 (4.4) | 59.4 (3.2) | 101.3 (4.3) | 99.2 (4.1) | 96.5 (4.6) |
| BerbC | 75.0 (3.6) | 74.7 (4.8) | 44.3 (4.5) | 96.7 (3.9) | 99.1 (5.8) | 100.8 (4.9) |
| Chel | 69.1 (5.2) | 65.2 (3.7) | 61.6 (3.8) | 105.1 (5.7) | 103.7 (4.5) | 97.5 (4.3) |
3.5 Method validation for TSPSAcide@GO@SiO2
Method validation, such as linearity, correlation coefficients, LODs and LOQs, were investigated, which were done for water matrix. The results in Table 3 show that good linearities are obtained in the range of 2–100 μg L−1 for CopC and BerbC and 5–100 μg L−1 for Sang and Chel with correlation coefficients better than 0.999. LODs (S/N = 3) are 1 μg L−1 for CopC and BerbC, and 2 μg L−1 for Sang and Chel. LOQs (S/N = 10) were 2 μg L−1 for CopC and BerbC, and 5 μg L−1 for Sang and Chel.| QAs | Linear range (μg L−1) | R 2 | LOD (μg L−1) | LOQ (μg L−1) |
|---|---|---|---|---|
| CopC | 2–100 | 0.9992 | 1 | 2 |
| Sang | 5–100 | 0.9990 | 2 | 5 |
| BerbC | 2–100 | 0.9995 | 1 | 2 |
| Chel | 5–100 | 0.9991 | 2 | 5 |
3.6 Application to real samples
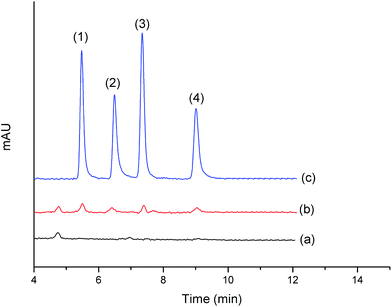
To assess the applicability of the proposed method for the quantitative analysis of the four QAs in real samples, the proposed technique was employed for human urine samples. Chromatograms shown in Fig. 12 were obtained from the real human urine sample (a), real human urine sample spiked at 5 μg L−1 (b), and standard solution (c). As shown in Table 4, the recoveries of the four QAs range from 81.3% to 110.6% for spiked 5 μg L−1 standard solution with RSDs in the range of 2.6–10.4%. The results of our study demonstrated the suitability of the proposed method for the determination of the four QAs in human urine samples.| QAs | Recovery for 5 μg L−1 standard addition | RSDs (n = 3, %) |
|---|---|---|
| CopC | 89.1 | 8.5 |
| Sang | 110.6 | 3.6 |
| BerbC | 81.3 | 10.4 |
| Chel | 101.2 | 2.6 |
4. Conclusions
A novel double carboxyl silicane modified graphene oxide coated silica material has been prepared and applied as the sorbent for solid phase extraction of four QAs. The newly developed sorbent shows excellent capability for the extraction of QAs (enrichment factor = 70), which is attributed to the multiple interactions between the sorbent and analytes, such as electrostatic, hydrogen-bond and dipole–dipole interactions. As for the type of eluent, pH of sample, pH of eluent, volume of sample loading and volume of eluent, etc., all these parameters have great impact on the extraction ability. Through a series of condition optimization studies, every optimal condition was set up. From the control experiments of TSPSAcide@SiO2, it powerfully illustrates that the application of GO not only effectively eliminates the residual silanol impact, but also improves the extraction capacity of TSPSAcide@GO@SiO2 sorbent. Under optimal conditions, the sorbent was successfully applied to the determination of QAs in human urine samples and obtained satisfactory results. Because of its excellent selectivity, high adsorption capacity and high reproducibility, the developed sorbent material has potential to be applied to other specific applications.Acknowledgements
Financial supports from the National Natural Science Foundation of China (21105107, 21175143, 21475143) and the National Science & Technology Major Project of China (nos 2011ZX05010-003 and 2011ZX05011) are gratefully acknowledged.References
- F. Y. Tang and A. G. Nie, J. Clin. Exp. Med., 2006, 5, 185–186 Search PubMed.
- W. C. Lenung and H. Zheng, Prog. Neuro-Psychopharmacol. Biol. Psychiatry, 2003, 27, 775–779 CrossRef.
- A. R. Mcutcheon, S. M. Ellis, R. E. Hancock and G. H. Towers, J. Ethnopharmacol., 1994, 44, 157–169 CrossRef.
- V. Misik, L. Bezakova, L. Malekova and D. Kostalova, Planta Med., 1995, 61, 372–373 CrossRef CAS PubMed.
- J. Ulrichova, Z. Dvorak, J. Vicar, J. Lata, J. Smrzova, A. Sedo and V. Simanek, Toxicol. Lett., 2001, 125, 125–132 CrossRef CAS.
- D. T. Youssef and A. A. Khalifa, Pharmazie, 2001, 56, 818–822 CAS.
- M. Behbahani, A. Bagheri, M. Taghizadeh, M. Salarian, O. Sadeghi, L. Adlnasab and K. Jalali, Food Chem., 2013, 138, 2050–2056 CrossRef CAS PubMed.
- E. Tahmasebi and Y. Yamini, Anal. Chim. Acta, 2012, 756, 13–22 CrossRef CAS PubMed.
- L. Vidal, J. Parshintsev, K. Hartonen, A. Canals and M. L. Riekkola, J. Chromatogr. A, 2012, 1226, 2–10 CrossRef CAS PubMed.
- F. Guo, Q. Liu, G. B. Qu, S. J. Song, J. T. Sun, J. B. Shi and G. B. Jiang, J. Chromatogr. A, 2013, 1281, 9–18 CrossRef CAS PubMed.
- Y. Wang, S. Gao, X. Zang, J. Li and J. Ma, Anal. Chim. Acta, 2012, 716, 112–118 CrossRef CAS PubMed.
- P. K. Jak, S. Patel and B. K. Mishra, Talanta, 2004, 62, 1005–1028 CrossRef PubMed.
- T. P. Rao, R. S. Praven and S. Daniel, Crit. Rev. Anal. Chem., 2004, 34, 177–193 CrossRef CAS.
- V. A. Lemos, M. S. Santos, E. S. Santos, M. J. S. Santos, W. N. L. dos Santos, A. S. Souza, D. S. de Jesus, C. F. das Virges, M. S. Carvalho, N. Oleszczuk, M. G. R. Vale, B. Welz and S. L. C. Ferreira, Spectrochim. Acta, Part B, 2007, 62, 4–12 CrossRef PubMed.
- S. Yu, X. Y. Pang, Y. X. Deng, L. Liu, Y. Liang, X. D. Liu, L. Xie, G. J. Wang and X. T. Wang, Int. J. Mass Spectrom., 2007, 268, 30–37 CrossRef CAS PubMed.
- Z. H. Peng, J. Z. Song, F. M. Han, H. X. Chen, M. M. Zhu and Y. Chen, Int. J. Mass Spectrom., 2007, 266, 114–121 CrossRef CAS PubMed.
- J. Naworcki, J. Chromatogr. A, 1997, 779, 29–71 CrossRef.
- P. Wang, J. D. Wang, R. Z. Cong and B. T. Dong, Chin. J. Chromatogr., 1997, 15, 189–191 CAS.
- M. D. Stoller, S. J. Park, Y. W. Zhu, J. H. An and R. S. Ruoff, Nano Lett., 2008, 8, 3498–3502 CrossRef CAS PubMed.
- M. J. Allen, V. C. Tung and R. B. Kaner, Chem. Rev., 2010, 110, 132–145 CrossRef CAS PubMed.
- D. R. Dreyer, S. Park, C. W. Bielawski and R. S. Ruoff, Chem. Soc. Rev., 2010, 39, 228–240 RSC.
- J. W. Liu, Q. Zhang, X. W. Chen and J. H. Wang, Chem.–Eur. J., 2011, 17, 4864–4870 CrossRef CAS PubMed.
- Y. B. Luo, G. T. Zhu, X. S. Li, B. F. Yuan and Y. Q. Feng, J. Chromatogr. A, 2013, 1299, 10–17 CrossRef CAS PubMed.
- Q. Liu, J. B. Shi, L. X. Zeng, T. Wang, Y. Q. Cai and G. B. Jiang, J. Chromatogr. A, 2011, 1218, 197–204 CrossRef CAS PubMed.
- Y. Q. Feng and Y. B. Luo, Chin. J. Chromatogr. A, 2013, 1299, 10–17 CrossRef PubMed.
- Q. Liu, J. B. Shi, J. T. Sun, T. Wang, L. X. Zeng and G. B. Jiang, Angew. Chem., Int. Ed., 2011, 50, 5913–5917 CrossRef CAS PubMed.
- K. J. Huang, Q. S. Jing, C. Y. Wei and Y. Y. Wu, Spectrochim. Acta, Part A, 2011, 79, 1860–1865 CrossRef CAS PubMed.
- G. I. Titelman, V. Gelman, S. Bron, R. L. Khalfin, Y. Cohen and H. B. Peled, Carbon, 2005, 43, 641–649 CrossRef CAS PubMed.
- S. Park and R. S. Ruoff, Nat. Nanotechnol., 2009, 4, 217–224 CrossRef CAS PubMed.
- A. I. Barabanova, T. A. Pryakhina, E. S. Afanas'ev, B. G. Zavin, Ya. S. Vygodskii, A. A. Askadskii, O. E. Philippova and A. R. Khokhlov, Appl. Surf. Sci., 2012, 258, 3168–3172 CrossRef CAS PubMed.
- S. Watcharotone, D. A. Dikin, S. Stankovich, R. Piner, I. Jung, G. H. B. Dommett, G. Evmenenko, S. E. Wu, S. F. Chen, C. P. Liu, S. T. Nguyen and R. S. Ruoff, Nano Lett., 2007, 7, 1888–1892 CrossRef CAS PubMed.
- H. F. Yang, F. H. Li, C. S. Shan, D. X. Han, Q. X. Zhang, L. Niu and A. Ivaska, J. Mater. Chem., 2009, 19, 4632–4638 RSC.
| This journal is © The Royal Society of Chemistry 2015 |


