Photochemical reactivity of a lamellar lanthanum MOF†
Adonis
Michaelides
*,
Maria
Aravia
,
Michael G.
Siskos
* and
Stavroula
Skoulika
*
Department of Chemistry, University of Ioannina, Ioannina, Greece. E-mail: vskoul@uoi.gr; amihail@uoi.gr; msiskos@cc.uoi.gr; Fax: +302651008798; Tel: +302651008446
First published on 3rd November 2014
Abstract
A 2D lanthanum-dicarboxylate MOF of the formula [La2(hex)3(H2O)6]·9H2O (H2hex = trans,trans-hexadiendioic acid or trans,trans-muconic acid) has been synthesized by the silica gel technique. The structure consists of metal–organic layers separated by a 2D network of water molecules. The metal–organic layers are made up of La3+ arrays linked by the muconate ligands. Within a layer there is an infinite chain of short contacts between olefinic bonds allowing formation, upon UV irradiation, of three photoproducts. One of them was completely unexpected and its formation is explained by complex molecular movements in the solid state. The thermal instability of the MOF allowed isolation of five photochemically active lower hydrates. The rate constants of all hydrates were determined and show significant variations between them, attributable to structural rearrangements within the metal–organic layer brought about upon dehydration.
Introduction
The extensive study of solid-state [2 + 2] photocycloaddition reactions in organic molecular crystals allowed Schmidt to state that the reaction takes place if the distance between neighboring parallel –C![[double bond, length as m-dash]](https://www.rsc.org/images/entities/char_e001.gif) C– moieties does not exceed 4.20 Å.1 A recent database analysis of crystal structures retrieved from the Cambridge Data Bank showed that, at least for C⋯C contacts up to 4.08 Å, the [2 + 2] cycloaddition occurs even if the planes of the neighboring olefinic bonds are not parallel.2 However, a large amount of work carried out over the past 40 years showed that apart from geometric criteria, the crystal environment should also be taken into account in order to interpret some “anomalous” results such as absence of photoreactivity for distances less than 4.20 Å or photoreactivity above 4.80 Å.3 Thus, the necessity of a minimum amount of atomic movement for the reaction to occur led to the concept of “reaction cavity”.4 Anisotropic movement along crystal cleavage planes or voids was also invoked to explain photoreactivity or its absence in organic crystals.3,5 Also, strong hydrogen bonding has been put forward to account for the absence of photoreactivity of caffeic acid, despite a favorable distance of 4.01 Å between parallel neighboring > C
C– moieties does not exceed 4.20 Å.1 A recent database analysis of crystal structures retrieved from the Cambridge Data Bank showed that, at least for C⋯C contacts up to 4.08 Å, the [2 + 2] cycloaddition occurs even if the planes of the neighboring olefinic bonds are not parallel.2 However, a large amount of work carried out over the past 40 years showed that apart from geometric criteria, the crystal environment should also be taken into account in order to interpret some “anomalous” results such as absence of photoreactivity for distances less than 4.20 Å or photoreactivity above 4.80 Å.3 Thus, the necessity of a minimum amount of atomic movement for the reaction to occur led to the concept of “reaction cavity”.4 Anisotropic movement along crystal cleavage planes or voids was also invoked to explain photoreactivity or its absence in organic crystals.3,5 Also, strong hydrogen bonding has been put forward to account for the absence of photoreactivity of caffeic acid, despite a favorable distance of 4.01 Å between parallel neighboring > C![[double bond, length as m-dash]](https://www.rsc.org/images/entities/char_e001.gif) C < bonds.6 Recently, investigation of the photoreactivity of different polymorphs or solvates of the same organic molecule has showed that, for distances up to 4.02 Å, “a decreasing trend of the photochemical yield corresponds well with the increasing bond separation”.7
C < bonds.6 Recently, investigation of the photoreactivity of different polymorphs or solvates of the same organic molecule has showed that, for distances up to 4.02 Å, “a decreasing trend of the photochemical yield corresponds well with the increasing bond separation”.7
Another way of comparing the photoreactivity of the same molecule in various crystal environments is to construct metal–organic frameworks (MOFs) using potentially photoreactive organic molecules as ligands.8,9 Moreover, in the case of isomorphous MOFs, this approach allows comparison of the photoreactivity of a molecule in almost identical crystal environments, the only difference being small variations in the geometry of neighboring olefinic bonds. By comparing the reaction rates of isomorphous MOFs of trans,trans-muconic acid we showed that the nature of the metal also affects the reaction rate probably via ligand-to-metal energy transfer.
In the present work, we synthesized a photochemically active layered lanthanum MOF of trans,trans-muconic acid [La2(hex)3(H2O)6]·9H2O, 1 (hex = trans,trans-hexadiendioic acid or trans,trans-muconic acid), whose partial dehydration leads to various lower hydrates. We show that the photoreaction rate constants of the different hydrates differ significantly between them. Also, the nature of the products obtained depends on the structure of the irradiated hydrate.
Results and discussion
Crystal structure of 1
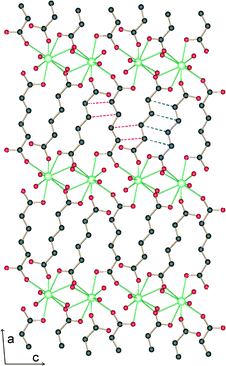
The crystal and structure refinement data are presented in Table 1. Each cation is 10-coordinated by five ligands and three water molecules. One type of ligand is centrosymmetric and binds in chelating–bridging mode. The other type which is not centrosymmetric binds in monodentate mode with one carboxylate group and in chelating–bridging mode with the other (Fig. 1 and S1†). These ligands are assembled as dimers around a center of symmetry with short C⋯C contacts between both olefinic bonds (center-to-center distance 3.804 Å, dihedral angle −5.5°, interplanar angle 8.4°). Interestingly, there is another short contact between one of the double bonds of the centrosymmetric ligand and one double bond of the nearest non-centrosymmetric ligand. In this case, the center-to-center distance is 4.064 Å with dihedral and interplanar angles of −13.5 and 9.7°, respectively. This geometry should be less favorable for photochemical reactions than that found in the case of pairs of non-centrosymmetric ligands.| Empirical formula | LaC9H20.4O13.2 |
| Formula weight | 478.76 |
| Crystal system | Monoclinic |
| Wavelength (Å) | 0.71073 |
| Temperature (K) | 293(2) |
| Space group | P2/c |
| a/(Å) | 11.082(2) |
| b/(Å) | 9.182(1) |
| c/(Å) | 16.959(2) |
| β (deg) | 92.36(1) |
| Volume (Å3) | 1724.2(4) |
| Z | 4 |
| Calculated density (g cm−3) | 1.844 |
| F(000) | 948 |
| Total reflections | 3610 |
| Unique reflections | 3015/Rint = 0.0494 |
| Completeness to 2θ | 99.4% |
| Goodness of fit | 1.035 |
| R 1 [I > 2σ(I)] | 0.0407 |
| wR2 [I > 2σ(I)] | 0.0996 |
| R 1 [all data] | 0.0540 |
| wR2 [all data] | 0.1077 |
The structure is lamellar and consists of metal–organic layers separated by relatively thick hydrogen-bonded water layers (Fig. 2).10 A single metal–organic layer is composed of arrays of La3+ cations running along the c axis, “clamped” by muconate ligands elongated along a (Fig. 1). The metal–organic layers are separated by a relatively thick layer made up of H-bonded coordinated and lattice water molecules (Fig. 3). Two lattice water molecules (O7w and O8w) exhibit disorder (see the experimental section). Also, hydrogen atoms between symmetry-related oxygen atoms (O2w, O3w and O5w) should be disordered over two sites. However, these atoms were successfully located. The hydrogen bonding geometry is shown in Table 2. Overall, the water network may be described as composed of edge-sharing hexagons and pentagons. A characteristic feature of this topology is the existence of chains of edge-sharing hexagons, of alternating chair and twist-boat conformation, running along c. We would like to emphasize, however, that this topology should be seen as a snapshot of the interlayer geometry. The precise geometry of the interlayer water network is complex and the hydrogen bonds seem to be in a continuous state of flux. This is also observed in many typical cases of inorganic layered materials11 and is in line with modern views of the structure of liquid water as being composed of rings of water molecules destroyed and reformed in a perpetual way.12
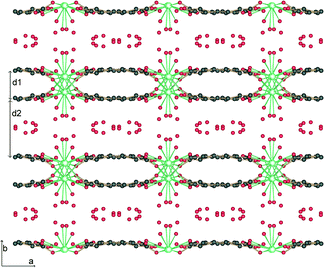 | ||
| Fig. 2 Projection along c of the crystal structure of 1. The metal organic layers with thickness d1 = 3.3 Å are separated by water layers with thickness d2 = 5.9 Å. | ||
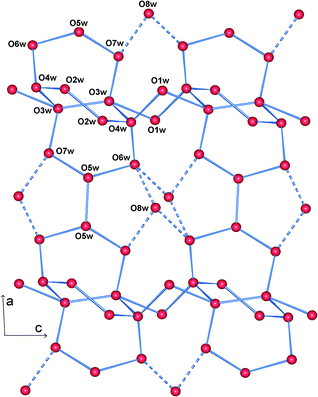 | ||
| Fig. 3 View of a water layer. Blue lines represent possible hydrogen bonds. Dashed lines connect the highly disordered O8w with other water oxygens. | ||
| D–H⋯A | D⋯A (Å) | H⋯A (Å) | D–H⋯A (°) |
|---|---|---|---|
| a The corresponding hydrogen atoms are refined with an occupancy factor of 0.5. | |||
| O1w–H1a⋯O3 | 2.816 | 1.998 | 169.83 |
| O1w–H1b⋯O6w | 3.236 | 2.597 | 133.92 |
| O1w–H1b⋯O4w | 3282 | 2.603 | 139.06 |
| O2w–H2a⋯O4 | 2.672 | 1.848 | 166.29 |
| O2w–H2b⋯ O2wa | 2.771 | 1.974 | 160.61 |
| O3w–H3a⋯O4wa | 2.756 | 1.983 | 153.83 |
| O3w–H3b⋯O7w | 2.750 | 1.949 | 162.35 |
| O3w–H3c⋯O3wa | 2.908 | 2.097 | 160.61 |
| O4w–H4a⋯O3wa | 2.756 | 1.979 | 153.63 |
| O4w–H4b⋯O2w | 2.826 | 2.016 | 164.90 |
| O5w–H5a⋯O4 | 2.796 | 1.966 | 171.64 |
| O5w–H5b⋯O5wa | 2.775 | 2.074 | 141.66 |
| O5w–H5c⋯O6wa | 2.907 | 2.090 | 168.00 |
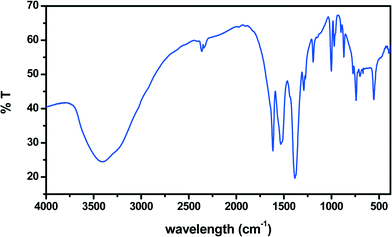
The IR spectrum (Fig. 4) is fully compatible with crystallographic results. The large strong peak centered around 3450 cm−1 confirms the “liquid-like” nature of the interlayer water network.13 The large peak centered at 1615 cm−1 corresponds to the region of dienic νC![[double bond, length as m-dash]](https://www.rsc.org/images/entities/char_e001.gif) C vibration and to the bending mode of water. Indeed, we observe significant changes in its intensity during photochemical experiments (see below). The large peak between 1500 and 1600 cm−1, exhibiting two absorption minima at 1570 and 1529 cm−1, is attributed to the overlapping of various carboxylate stretching modes observed in the crystal structure.14 It is worth noting that at 1573 and 1620 cm−1 are also bands due to the water pentagons grown on the copper (110) face.15 The next large peak centered at 1379 cm−1 is due, according to our ab initio calculations on muconic acid, to the δC–C–O mode and its intensity significantly decreased upon UV irradiation (see below). The strong peak at 997 cm−1 is also involved in photochemistry and, according to our calculation, is due to the νC–C of the diene.
C vibration and to the bending mode of water. Indeed, we observe significant changes in its intensity during photochemical experiments (see below). The large peak between 1500 and 1600 cm−1, exhibiting two absorption minima at 1570 and 1529 cm−1, is attributed to the overlapping of various carboxylate stretching modes observed in the crystal structure.14 It is worth noting that at 1573 and 1620 cm−1 are also bands due to the water pentagons grown on the copper (110) face.15 The next large peak centered at 1379 cm−1 is due, according to our ab initio calculations on muconic acid, to the δC–C–O mode and its intensity significantly decreased upon UV irradiation (see below). The strong peak at 997 cm−1 is also involved in photochemistry and, according to our calculation, is due to the νC–C of the diene.
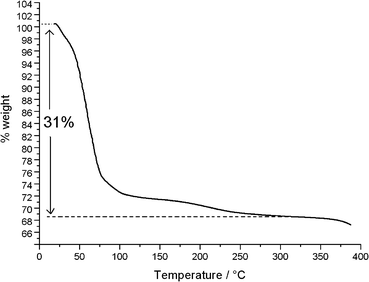
The TG/DTG/DSC diagrams are shown in Fig. 5 and S2.† Globally, there is a water loss (31%) between 30 °C and 325 °C, corresponding to 15 water molecules, in agreement with the results of X-ray crystallography. Most of the water content (23%) is evacuated between 30 °C and 75 °C, corresponding to 9 lattice and about 2 coordinated water molecules. A further loss of 2 coordinated water molecules (4%), taking place at a significantly decreased rate, is observed between 75 °C and 105 °C. The remaining two coordinated waters (4%) are slowly evacuated between 105 °C and 325 °C. The existence of many sub-minima on the main peak (35–75 °C) of the DTG curve (Fig. S2†) suggests that, actually, this fast evacuation process is taking place in several consecutive steps.
The thermal instability of 1 was also observed during attempts to follow the progress of the photochemical reaction using Raman microprobe spectroscopy. In all spectra, at the beginning, there was always a fluorescence background, especially in the region 2000–4000 cm−1. However, upon hitting the sample with the laser beam (green line) of the spectrometer for some seconds and re-recording the spectrum, a drastic decrease (quenching) in the fluorescence was observed. This was attributed to the departure of water molecules upon heating of the sample by the laser beam.16 Fluorescence spectra of 1 recorded separately showed two weak peaks around 550 nm due probably to the ligand because the lanthanum is not fluorescent. These peaks disappear in all other hydrates (described below).
Photochemical reactivity
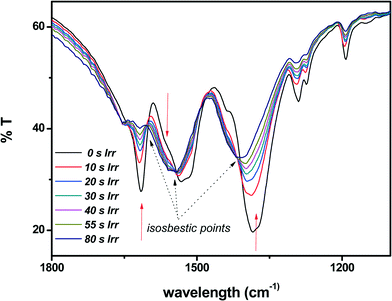
The photochemical reactivity of 1 was first investigated by IR spectroscopy (Fig. 6, S3†). We may remark that the water and carboxylate stretching modes (at 3450 and 1529 cm−1, respectively) are unaffected by the irradiation. The kinetics is first order and the reaction rates were determined in the spectral regions 1630–1603 cm−1 and 1025–980 cm−1, located between isosbestic points. The rate constants obtained from these curves were 5.4 × 10⁻² s−1 for the region 1630–1603 cm−1 and 4.3 × 10⁻² s−1 for the region 1025–980 cm−1. Considering that the error associated with this methodology does not exceed 15%,8 the two values are practically equal.The study of the photochemical reactivity of 1 was completed by 1H NMR experiments in order to investigate the nature of the products formed during irradiation of a powdered sample of 1. The 1H NMR spectra of the photoproducts obtained upon irradiation of 1 for 30 min and 1 h were recorded in alkaline D2O solutions (Fig. 7 and S4†), so all organic molecules were in the carboxylate form.8 As an aid in interpreting the complex spectra obtained we calculated the chemical shifts using DFT methods (see the experimental section). The conformations, as obtained from the DFT calculations, are shown in Fig. S5.† Generally, there is a very good agreement between calculated and experimental chemical shifts. The most pronounced differences between δcalc and δexp were observed for the [3]-ladderane molecule (compound c in Fig. 7 and S5†) for which the calculations were performed for the equilibrium structure obtained by DFT (C–C distances around 1.57 Å). However, the experimental shifts are in the region usually found for ladderanes.17 Moreover, the presence of the Cope rearrangement product (compound b in Fig. 7 and S5†) obtained without heating the liquid mixture18 is attributed to the presence of the ladderane.8 The photodimer d of rttc topology appears also when a ladderane is formed. However, in this particular case this dimer may also be formed directly (reaction between bonds connected by red dashed lines in Fig. 1). The presence of photodimer e of rtct topology, which is the main product of the photoreaction of 1, was completely unexpected. One way to explain its formation is to consider that the two ligands forming the centrosymmetric pair (Fig. 1) rotate by opposite angles, around an axis passing through the center of symmetry between them and being perpendicular to the plane of the ligands. At the end of this movement the double bonds are no more parallel. Then, in the second step, one of the ligands undergoes pedal motion19 thus rendering the double bonds approximately parallel. In this case, reaction between the parallel bonds leads to dimer e. This dimer was also obtained before (termed A in ref. 8) through movement in the solid state. A possible reason for triggering the movement of ligands is the departure of water molecules during irradiation of the solid. Indeed, the TG curve of the irradiated solid (Fig. S6†) showed that only 5.5 water molecules remained upon irradiation for 1 h. As the metal centers are in close proximity, occupation of the vacant coordination sites by neighboring carboxylate groups may trigger the ligand movements described above. The term “carboxylate shift” has been used in the past to describe transition from one complexing mode to the other in neighboring metal sites.20
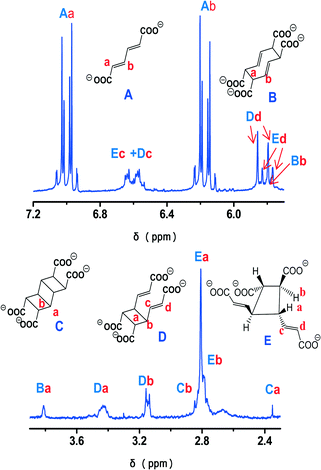 | ||
| Fig. 7 1H NMR spectrum of the photoreaction products of 1 (1 h of irradiation) in alkaline D2O solution. Estimated reaction yields: B 3%, C 1.5%, D 22%, E 24.5%. | ||
In an attempt to further understand the reactivity of 1 we also studied the photochemistry of the lower hydrates obtained from 1 (see the experimental section). The water content was determined by thermal analysis (Fig. S7†). However, there is no clear distinction between lattice and coordinated water molecules, so only the total water content is given in the stoichiometric formulae. In all cases (including 1 before and after irradiation), collapsing of the framework occurs around 350 °C.
The rate constants of the photochemical reaction for all hydrates were determined by IR spectroscopy (Fig. S8†) and are summarized in Table 3. Kinetics of photochemical reactions in molecular solids using IR spectroscopy was also described by Almond et al.21 We observe that the rehydrated compounds 2r and 3r have higher rate constants than their corresponding lower hydrates 2 and 3. However, this does not mean that the rate constant is proportional to the total amount of water because the comparison between hydrates 1 and 4 shows the contrary. It is clear that the structural role of water in the organization of the organic ligand within a metal–organic layer is the key factor determining the photochemical reaction rate. The IR spectra of compounds 2, 2r, 3, and 3r (Fig. S8†) are practically identical, with only some differences in the region of the water stretching (3200–3500 cm−1). However, the spectra of this group do have some differences compared with those of hydrates 1 and 4. The spectra of the two latter hydrates are quite similar between them, their main difference being the splitting of the bands of 1 at 1001, 866 and 741 cm−1 into two distinct bands in 4, probably due to small symmetry changes. The main differences between the two groups of hydrates 1, 4 and 2–3r are the appearance of five new bands in the latter group at 850, 790, 750, 732 and 680 cm−1, whereas the band at 740 cm−1 in 1 disappears in the lower hydrates, indicating modifications in the framework structure. Finally, we also recorded the 1H NMR spectrum of 3r irradiated for 6 hours (Fig. S9).† In this case, compound e (Fig. S5†), i.e. the main product formed upon irradiation of 1, is not found at all. The spectrum shows the presence of ladderane (compound b in Fig. S5†), the Cope photoproduct (compound c in Fig. S5†) and dimer d (Fig. S5†). As we have showed recently,8,22 compounds c and d are formed during dissolution of the ladderane.
| Compound | Rate constant (s−1) | |
|---|---|---|
| 1645–1595 cm–1 | 1025–980 cm−1 | |
| [La2(hex)3(H2O)6]·9H2O (1) | 5.4 × 10⁻² | 4.3 × 10⁻² |
| La2(hex)3·7H2O (4) | 16.1 × 10⁻² | 12.2 × 10⁻² |
| La2(hex)3·5H2O (2) | 1.6 × 10⁻² | |
| La2(hex)3·6.2H2O (2r) | 3.2 × 10⁻² | 2.5 × 10⁻² |
| La2(hex)3·3H2O (3) | 7.5 × 10⁻³ | 7.3 × 10⁻² |
| La2(hex)3·5.5H2O (3r) | 2.1 × 10⁻² | 1.6 × 10⁻² |
Comparison of the PXRD patterns (Fig. 8) shows that hydrates 1 and 4 are very similar, confirming the IR spectroscopy results. In particular, we may observe that the reflections in the low 2θ region (8°–10°) are still present in hydrate 4, although its water content is significantly reduced compared to that of 1. The survival of the peak at 8° (7.98°), which in the structure of 1 corresponds to the d100 distance (i.e. the distance between metal layers connected by the ligand), ensures that the structure within the layer remains essentially the same. The appearance of a new peak around 8.5° corresponding to a d-spacing of 10.42 Å is compatible with small structural rearrangements within the layer as the result of partial dehydration. The presence of a peak at 9.9° corresponds to a distance of 9.17 Å, i.e. the length of the b axis However, the loss of more than 50% of the water content should bring about a drastic reduction of the d010 distance. The presence of this reflection upon partial dehydration suggests that the water molecules are not uniformly evacuated, with some domains of the crystalline solid remaining intact. This behavior was described in detail in the case of the partially loaded metal silicate hydrate magadiite.23 The (110) reflection (2θ = 12.5°, d = 7.07 Å) which corresponds to the distance between parallel metal arrays belonging to neighboring layers is clearly present in the lower hydrates 2, 2r and 4. The examination of the packing of 1 (Fig. 1) showed that the d110 distance may be conserved upon dehydration provided that the layers slide on each other and remain essentially parallel between them. From the above results it is concluded that upon dehydration and rehydration the structure within the layers is not dramatically changed. What is essentially modified are the geometric relations and the interactions between the layers. In each case, the new structure adopted by the solid depends on the experimental conditions, i.e. on the “history” of its synthesis. This is also true for the crystallinity of the solid. For example, the crystallinity of 3r, obtained at near-equilibrium conditions, is improved compared to that of 3, obtained by heating at 80 °C. It is also obvious that only a limited amount of water can be reintroduced into the lattice. This indicates strong interaction between the layers of the partly hydrated compounds, implying that 1 is a high-energy kinetic product.
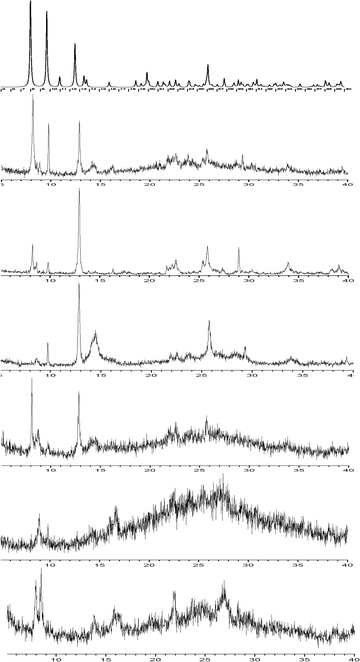 | ||
| Fig. 8 PXRD patterns of the compounds studied. From the top: as-simulated pattern of 1, experimental patterns of 1, 4, 2, 2r, 3, and 3r. | ||
Lamellar MOFs have also been obtained with Ce3+, Pr3+ and Nd3+. Only in the case of Ce3+ were obtained single crystals at low temperature. The cell geometry24 shows isostructurality to the lanthanum compound.
Experimental
Syntheses
Single-crystal X-ray crystallography
The X-ray diffraction intensities for compound 1 were collected at room temperature on a Bruker P4 diffractometer employing graphite monochromated MoKα radiation. The data were corrected for Lorentz and polarization effects. The structure was solved by direct methods and refined by full-matrix least-squares technique using the SHELXL-97 package.25 All non-hydrogen atoms except oxygen atoms O7w and O8w were refined anisotropically. The hydrogen atoms of the organic moieties have been placed on calculated positions and refined by using the riding model. O7w was refined isotropically over three positions with occupancy factors of 0.2, 0.2 and 0.5, while O8w was refined isotropically with an occupancy factor of 0.3. The hydrogen atoms of O1w–O5w were placed by difference Fourier maps and refined isotropically with a fixed thermal parameter. Some of these hydrogens (H2b, H3a, H3c, H4a, H5b, H5c) participate in disordered hydrogen bonds and were refined with an occupancy factor of 0.5. All O–H distances and most H–O–H angles were restrained to theoretical values. Due to the above-mentioned disorder the hydrogen atoms bonded to O6w, O7w and O8w were not located. Crystal and structure refinement data are found in Table 1.Physical measurements
FT-IR spectra were recorded on a Perkin-Elmer SPECTRUM BX spectrophotometer using the KBr technique. 1H NMR spectra were recorded on a Bruker AMX-250 MHz spectrometer as described elsewhere.8 TG/DTG/DSC analysis was carried out in air at a scan speed of 10 °C min−1 using a NETZSCH STA 449C apparatus. X-ray powder diffraction (PXRD) data were collected on a BRUKER D8 Advanced System diffractometer. Irradiation experiments were carried out with an OSRAM 400 W high-pressure Hg lamp by focusing its light through a quartz lens.8Computational details
All the quantum mechanical calculations were performed using the GAUSSIAN 03 program.26 Minimum energy geometries and harmonic vibrational frequencies of the corresponding anions were performed at the DFT theoretical level by using the B3LYP hybrid functional with the 6-31+G(d) basis set. After the optimization, the 1H chemical shifts were calculated with the gauge-invariant atomic orbital (GIAO) method27 at the DFT/B3LYP/6-311+G(2d,p) level using as reference the corresponding tetramethylsilane (TMS) shielding calculated at the same theoretical level. The solvent effect on the theoretical NMR parameters was included using the polarized continuum model CPCM (water).28Conclusions
A heavily hydrated clay-like lanthanide MOF was synthesized and its solid-state reactivity was investigated by IR and 1H NMR spectroscopy. The close proximity of many olefinic bonds within a metal–organic layer allowed formation of three photoproducts. One of them was completely unexpected and its formation could only be explained by considering complex movements in the solid state. The thermal instability of the lanthanide MOF allowed isolation of five photoreactive lower hydrates. The comparison of the photoreaction rate constants between all these hydrates showed considerable variations attributable to structural rearrangements within the metal–organic layers brought about upon dehydration. The variation of rate constants could not be correlated with the water content of the hydrate. Instead, the organization of the water molecules within the hydrates seems to be at the origin of these variations, for it can strongly influence the ligand–ligand distance and geometry within the layers.Notes and references
- G. M. Schmidt, Pure Appl. Chem., 1971, 27, 647 CrossRef CAS
.
- F. H. Allen, M. F. Mahon, P. R. Raithby, G. P. Schields and H. A. Sparkes, New J. Chem., 2005, 29, 182 RSC
.
-
(a) G. Kaupp, Curr. Opin. Solid State Mater. Sci., 2002, 6, 131 CrossRef CAS
; (b) M. Nagarathinam and J. J. Vittal, Macromol. Rapid Commun., 2006, 27, 1091 CrossRef CAS
; (c) M. F. Mahon, P. R. Raitby and H. A. Sparkes, CrystEngComm, 2008, 10, 573 RSC
; (d) J. A. K. Howard, M. F. Mahon, P. R. Raithby and H. A. Sparkes, Acta Crystallogr., Sect. B: Struct. Sci., 2009, 65, 230 CAS
; (e) D.-K. Cao, T. V. Sreevidya, M. Botoshansky, G. Golden, J. B. Benedict and M. Kaftory, J. Phys. Chem. A, 2010, 114, 7377 CrossRef CAS PubMed
; (f) J. M. Thomas, Pure Appl. Chem., 1979, 51, 1065 CrossRef CAS
.
-
(a) M. D. Cohen, Angew. Chem., Int. Ed. Engl., 1975, 14, 386 CrossRef
; (b) T. Luty and C. J. Eckhardt, J. Am. Chem. Soc., 1995, 117, 2441 CrossRef CAS
; (c) E. V. Boldyreva, Solid State Ionics, 1997, 101–103, 843 CrossRef CAS
.
- M. Nagarathinam and J. J. Vittal, Angew. Chem., Int. Ed., 2006, 45, 4337 CrossRef CAS PubMed
.
- S. Garcia-Granda, G. Beurskens, P. T. Beurskens, T. S. R. Krishna and G. Desiraju, Acta Crystallogr., Sect. C: Cryst. Struct. Commun., 1987, 43, 683 CrossRef
.
- S.-Y. Yang, P. Naumov and S. Fukuzumi, J. Am. Chem. Soc., 2009, 131, 7247 CrossRef CAS PubMed
.
- A. Michaelides, S. Skoulika and M. G. Siskos, Chem. Commun., 2013, 49, 1008 RSC
.
- For extensive Reviews on Photochemically active MOFs see:
(a)
Metal-Organic Frameworks, ed. L. R. MacGillivray, Wiley, 2010 Search PubMed
; (b) R. Medishetty and J. J. Vittal, Struct. Bonding, 2014, 157, 105 CrossRef
.
-
(a) For a 2D MOF containing 2D water layers see: X. Zhu, Y.-F. Feng, M. Li, B.-L. Li and Y. Zhang, CrystEngComm, 2012, 14, 79 RSC
; (b) For a 2D MOF containing 1D water clusters see: P. Mahata, K. V. Ramya and S. Natarajan, Inorg. Chem., 2009, 48, 4942 CrossRef CAS PubMed
; (c) For a 2D H-bonded MOF containing water molecules see: C.-L. Chen and A. M. Beattie, J. Am. Chem. Soc., 2008, 130, 17222 CrossRef CAS PubMed
.
-
(a) E. S. Boek, P. V. Coveney and N. T. Skipper, J. Am. Chem. Soc., 1995, 117, 12608 CrossRef CAS
; (b) Handbook of Layered Materials, ed. S. M. Auerbach, K. A. Carrado and P. K. Dutta, Marcel Dekker, 2004 Search PubMed
; (c) Layered Double Hydroxides, Structure and Bonding, ed. X. Duan and D. G. Evans, Series ed. D. M. P. Mingos, 2005, p. 119 Search PubMed
.
-
(a) G. N. I. Clark, C. D. Kappa, J. D. Smith, R. J. Saykally and T. Head-Gordon, Mol. Phys., 2010, 108, 1415 CrossRef CAS
; (b) P. Wernet, D. Nordland, U. Bergmann, M. Vavalleri, M. Odelius, H. Ogasawara, L. A. Näslund, T. K. Hirsch, L. Ojamäe, P. Glatzel, L. G. M. Pettersson and A. Nilsson, Science, 2004, 304, 995 CrossRef CAS PubMed
.
-
(a)
Y. Maréchal, The Hydrogen Bond and the Water Molecule, Elsevier, 2007 Search PubMed
; (b) S. E. Lappi, B. Smith and S. Franzen, Spectrochim. Acta, Part A, 2004, 2611 CAS
; (c) G.-G. Luo, H.-B. Xiong and J.-C. Dai, Cryst. Growth Des., 2011, 11, 507 CrossRef CAS
.
- S. Skoulika, P. Dallas, M. G. Siskos, Y. Deligiannakis and A. Michaelides, Chem. Mater., 2003, 15, 4576 CrossRef CAS
.
- J. Carrasco, A. Michaelides, M. Forster, S. Haq, R. Raval and A. Hodgson, Nat. Mater., 2009, 8, 427 CrossRef CAS PubMed
.
- J.-P. Ma, Y. Yu and Y.-B. Dong, CrystEngComm, 2012, 14, 7157 RSC
.
-
(a) J. S. S. Damste, M. Strous, W. I. C. Rijposta, E. C. Hopmans, J. A. J. Geenevasen, A. C. T. Van Duln, L. A. Van Nittrik and M. S. M. Jetten, Nature, 2002, 419, 708 CrossRef PubMed
; (b) J. C. Santos and P. Fuentealba, Chem. Phys. Lett., 2003, 377, 449 CrossRef CAS
; (c) V. Mascitti and E. J. Corey, J. Am. Chem. Soc., 2006, 128, 3118 CrossRef CAS PubMed
; (d) H. Hopf, H. Greiving, C. Beck, I. Dix, P. G. Jones, J.-P. Desvergne and H. Bouas-Laurent, Eur. J. Org. Chem., 2005, 567 CrossRef CAS
.
- T. Odani, S. O. Kada, C. Kabuto, T. Kimura, S. Shimada, H. Matsuda, H. Oikawa, A. Matsumoto and H. Nakanishi, Cryst. Growth Des., 2009, 9, 3481 CAS
.
-
(a) J. Harada and K. Ogawa, Chem. Soc. Rev., 2009, 38, 2244 RSC
; (b) D. Furukawa, S. Kobatake and A. Matsumoto, Chem. Commun., 2008, 55 RSC
; (c) J. Saltiel, T. S. R. Krishna, S. Laohhasurayotin, K. Fort and R. J. Clark, J. Phys. Chem. A, 2008, 112, 199 CrossRef CAS PubMed
.
-
(a) R. L. Rardin, W. B. Tolman and S. J. Lippard, New J. Chem., 1991, 15, 417 CAS
; (b) E. G. Bakalbassis, M. Korabik, A. Michaelides, J. Mrozinski, C. Rapropoulou, S. Skoulika, A. Terzis and D. Tsaousis, J. Chem. Soc., Dalton Trans., 2001, 850 RSC
.
- S. L. Jenkins, M. J. Almond, S. D. M. Atkinson, M. G. B. Drew, P. Hollins, J. L. Mortimore and M. J. Tobin, J. Mol. Struct., 2006, 786, 220 CrossRef CAS PubMed
.
- A. Michaelides, S. Skoulika and M. G. Siskos, Chem. Commun., 2011, 47, 7140 RSC
.
- U. Brenn, W. Schwieger and K. Wuttig, Colloid Polym. Sci., 1999, 277, 394 CAS
.
- a = 11.057(2) Å, b = 9.172(1) Å, c = 16.903(3) Å, β = 92.45(1)°, V = 1712.5(4) Å3..
- G. M. Sheldrick, Acta Crystallogr., Sect. A: Found. Crystallogr., 2008, 64, 112–122 CrossRef CAS PubMed
.
-
M. J. Frisch, G. W. Trucks, H. B. Schlegel, G. E. Scuseria, M. A. Robb, J. R. Cheese-man, J. A. Montgomery Jr., T. Vreven, K. N. Kudin, J. C. Burant, J. M. Millam, S. S. Iyengar, J. Tomasi, V. Barone, B. Mennucci, M. Cossi, G. Scalmani, N. Rega, G. A. Petersson, H. Nakatsuji, M. Hada, M. Ehara, K. Toyota, R. Fukuda, J. Hasegawa, M. Ishida, T. Nakajima, Y. Honda, O. Kitao, H. Nakai, M. Klene, X. Li, J. E. Knox, H. P. Hratchian, J. B. Cross, V. Bakken, C. Adamo, J. Jaramillo, R. Gomperts, R. E. Strat-mann, O. Yazyev, A. J. Austin, R. Cammi, C. Pomelli, J. W. Ochterski, P. Y. Ayala, K. Morokuma, G. A. Voth, P. Salvador, J. J. Dannenberg, V. G. Zakrzewski, S. Dapprich, A. D. Daniels, M. C. Strain, O. Farkas, D. K. Malick, A. D. Rabuck, K. Raghavachari, J. B. Foresman, J. V. Ortiz, Q. Cui, A. G. Baboul, S. Clifford, J. Cioslowski, B. B. Ste-fanov, G. Liu, A. Liashenko, P. Piskorz, I. Komaromi, R. L. Martin, D. J. Fox, T. Keith, M. A. Al-Laham, C. Y. Peng, A. Nanayakkara, M. Challacombe, P. M. W. Gill, B. Johnson, W. Chen, M. W. Wong, C. Gonzalez and J. A. Pople, Gaussian 03 Revision D.01, Gaussian, Inc., Wallingford, CT, 2004 Search PubMed
.
-
(a) R. Ditchfield, Mol. Phys., 1974, 27, 789 CrossRef CAS
; (b) K. Wolinski, J. F. Hinton and P. Pulay, J. Am. Chem. Soc., 1990, 112, 8251 CrossRef CAS
.
-
(a) V. Barone and M. Cossi, J. Phys. Chem. A, 1998, 102, 1995–2001 CrossRef CAS
; (b) M. Cossi, N. Rega, G. Scalmani and V. Barone, J. Comput. Chem., 2003, 24, 669–681 CrossRef CAS PubMed
.
Footnote |
| † Electronic supplementary information (ESI) available: Fig. S1 ORTEP of the asymmetric unit of 1; Fig. S2 DSC/DTG of 1; Fig. S3 photoreaction kinetics by IR for 1; Fig. S4 detailed 1H-NMR spectrum of the reaction products for 1; Fig. S5 conformation of all photoproducts with experimental and calculated chemical shifts; Fig. S6 TG/DTG/DSC of 1 after irradiation for 1 h; Fig. S7 TG analysis for compounds 2, 2r, 3, 3r, 4; Fig. S8 IR spectra and photochemical kinetics for compounds 2, 2r, 3, 3r, 4; Fig. S9 detailed 1H-NMR spectrum of the reaction products for compound 3r and crystallographic cif file, CCDC 1012099. For ESI and crystallographic data in CIF or other electronic format see DOI: 10.1039/c4ce01396d |
| This journal is © The Royal Society of Chemistry 2015 |

