 Open Access Article
Creative Commons Attribution 3.0 Unported Licence
Stacking disorder in ice I
Tamsin L.
Malkin
a,
Benjamin J.
Murray
*a,
Christoph G.
Salzmann
b,
Valeria
Molinero
c,
Steven J.
Pickering
a and
Thomas F.
Whale
a
aInstitute for Climate and Atmospheric Science, School of Earth and Environment, University of Leeds, Woodhouse Lane, Leeds, LS2 9JT, UK. E-mail: B.J.Murray@Leeds.ac.uk
bDepartment of Chemistry, University College London, 20 Gordon Street, London, WC1H 0AJ, UK
cDepartment of Chemistry, The University of Utah, 315 South 1400 East, Salt Lake City, UT 84112-0850, USA
First published on 20th October 2014
Abstract
Traditionally, ice I was considered to exist in two well-defined crystalline forms at ambient pressure: stable hexagonal ice (ice Ih) and metastable cubic ice (ice Ic). However, it is becoming increasingly evident that what has been called cubic ice in the past does not have a structure consistent with the cubic crystal system. Instead, it is a stacking-disordered material containing cubic sequences interlaced with hexagonal sequences, which is termed stacking-disordered ice (ice Isd). In this article, we summarise previous work on ice with stacking disorder including ice that was called cubic ice in the past. We also present new experimental data which shows that ice which crystallises after heterogeneous nucleation in water droplets containing solid inclusions also contains stacking disorder even at freezing temperatures of around −15 °C. This supports the results from molecular simulations, that the structure of ice that crystallises initially from supercooled water is always stacking-disordered and that this metastable ice can transform to the stable hexagonal phase subject to the kinetics of recrystallization. We also show that stacking disorder in ice which forms from water droplets is quantitatively distinct from ice made via other routes. The emerging picture of ice I is that of a very complex material which frequently contains stacking disorder and this stacking disorder can vary in complexity depending on the route of formation and thermal history.
Introduction
In many cases when a crystalline material forms from a liquid, gas or solution, or when an unstable material recrystallizes, the initial phase to form is metastable. This metastable phase may then transform to the thermodynamically stable phase if the kinetics are favourable.1 This is thought to be true for the nucleation and crystallisation of ice I, a material of fundamental importance in a range of sciences and technologies; from cryopreservation2,3 to ice formation in aviation fuel,4,5 and not least the atmosphere where metastable ice may be a dominant phase in our planet's coldest clouds.6–8Metastable forms of ice I can be made through various routes,9 including by re-crystallisation from high-pressure phases;10–14 freezing of confined water in mesopores;15–17 heating of low-density amorphous ice;18–21 heating of glassy aqueous solutions;22,23 deposition of water vapour;9,24 freezing of water and aqueous solutions;6,25–31 freezing of nanometre scaled water clusters;32–34 and by decomposition of gas hydrates.9,35 Despite more than seven decades of research, our understanding of the nature and crystal structure of this commonly encountered metastable ice I is still rapidly evolving.
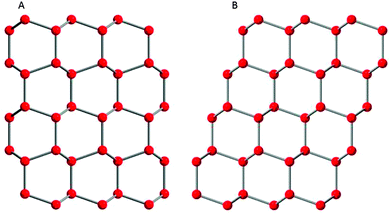
In the past, metastable ice I had been identified as having a cubic crystal structure with space group Fd![[3 with combining macron]](https://www.rsc.org/images/entities/char_0033_0304.gif) m, whereas the stable structure of ice I is hexagonal with space group P63/mmc.36 Both of these forms of ice I are made up of layers composed of six-membered puckered rings of hydrogen-bonded water molecules and only differ in the way the layers are stacked on top of each other (see Fig. 1). In ice Ih, each layer is a mirror image of the previous layer; whereas in ice Ic each successive layer is shifted a distance equal to half the diameter of a six-membered ring.36,37 However, it is becoming increasingly clear that the ice I phase which forms in many experiments does not fit either of these two well-defined crystal structures. Instead, metastable ice I is typically made up of a combination of both cubic and hexagonal stacking sequences which together do not poses cubic nor hexagonal symmetry (Fig. 2) and it has the trigonal space group P3m1.9,12,13,30 In order to emphasise the fact that metastable ice I is neither cubic nor hexagonal, and not a simple mixture of the two, Malkin et al.30 recommended calling this material stacking disordered ice I (ice Isd). We use the term stacking disordered ice I or ice Isd in this paper for metastable ice I which contains stacking disorder and reserve the term cubic ice (ice Ic) for the hypothetical form of ice I with a cubic structure as envisaged by König24 more than 70 years ago.
m, whereas the stable structure of ice I is hexagonal with space group P63/mmc.36 Both of these forms of ice I are made up of layers composed of six-membered puckered rings of hydrogen-bonded water molecules and only differ in the way the layers are stacked on top of each other (see Fig. 1). In ice Ih, each layer is a mirror image of the previous layer; whereas in ice Ic each successive layer is shifted a distance equal to half the diameter of a six-membered ring.36,37 However, it is becoming increasingly clear that the ice I phase which forms in many experiments does not fit either of these two well-defined crystal structures. Instead, metastable ice I is typically made up of a combination of both cubic and hexagonal stacking sequences which together do not poses cubic nor hexagonal symmetry (Fig. 2) and it has the trigonal space group P3m1.9,12,13,30 In order to emphasise the fact that metastable ice I is neither cubic nor hexagonal, and not a simple mixture of the two, Malkin et al.30 recommended calling this material stacking disordered ice I (ice Isd). We use the term stacking disordered ice I or ice Isd in this paper for metastable ice I which contains stacking disorder and reserve the term cubic ice (ice Ic) for the hypothetical form of ice I with a cubic structure as envisaged by König24 more than 70 years ago.
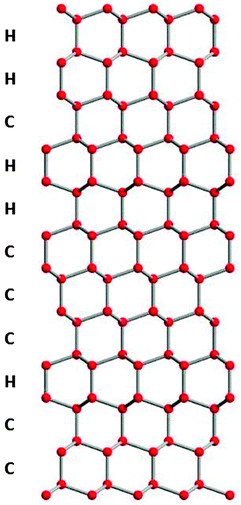 | ||
| Fig. 2 Possible stacking sequence in stacking disordered ice (ice Isd). Only oxygen atoms are shown which are connected by hydrogen bonds. | ||
In the mid 1980s Kuhs et al.14 were the first to appreciate that their samples of ice I, which they referred to as ice Ic, contained appreciable amounts of stacking faults. Specifically, they suggested that features in their neutron diffraction patterns were due to a small probability of finding hexagonal sequences in a structure dominated by cubic sequences. These hexagonal sequences were thought of as stacking faults in a cubic structure, but this early study lacked any quantitative analysis of the density of these stacking faults. At the time, Elarby-Aouizerat et al.38 suggested that while stacking faults could account for some non-cubic features, they could not account for the all the non-cubic features in the diffraction patterns. With the development of a detailed stacking fault model of ice, Hansen et al.12,13 were able to quantitatively show that all the non-cubic features in ice I formed from ice V and ice IX could be accounted for with stacking disorder. They also showed that correlations between stacking faults was different dependent on the route of formation. Morishige and Uematsu16 also showed through modelling diffraction patterns that ice in mesopores contained significant stacking disorder. After posing the question of ‘is it cubic?’, Moore and Molinero39 arrived at the conclusion that metastable ice I contains comparable fractions of cubic and hexagonal layers. Subsequently, Malkin et al.30 showed that ice resulting from the homogeneous freezing of water droplets at around −40 °C was made up of a fully randomised mixture of 50% cubic and hexagonal sequences. More recently, Kuhs, et al.9 showed that ices generated in multiple ways, including through vapour deposition and recrystallization of gas hydrates, all contains stacking disorder to varying degrees and possesses a trigonal, rather than cubic, space group. In summary, there is compelling evidence that ice I has a propensity to be stacking disordered.
In this perspectives article we initially review the diffraction data in the literature, which shows that the non-cubic features of the diffraction patterns associated with stacking disorder are ubiquitous to all metastable ice I that we are aware of. The data also suggests that there are strong differences in the nature of the stacking disorder observed depending on method of generation. We discuss computational studies of formation of stacking disorder during the nucleation and growth of ice, including recent results on stacking disorder in ice nucleated heterogeneously.30,39–58 We present new experimental data for ice formed from water droplets in which freezing was initiated heterogeneously. In order to do this we built on our knowledge of heterogeneous ice nucleation,59–63 in order to select materials which nucleate ice over a range of temperatures between 237 and 263 K. These results are unique in that they allow us to systematically probe the evolution of ice structure as a function of ice nucleation temperature. In addition we also present new data for ice Isd formed via the recrystallization of ice II. We then model this diffraction data to quantify the number density and nature of cubic and hexagonal stacking sequences, and summarise this information on a so-called “stackogram”. This new type of plot helps to visualise the differences in the nature of stacking disorder in ice Isd made through different routes.
The ubiquity of stacking disorder: evidence from diffraction patterns
Diffraction patterns provide information on long range order (and disorder) in crystal structures. A diffraction pattern of a well-defined crystalline material contains sharp Bragg peaks, the position of which can be related to distance between adjacent planes in a crystal structure known as d-spacings. The Bragg condition is met in an ordered crystal where the long range order leads to constructive interference satisfying Bragg's law and giving rise to sharp diffraction peaks. If for some reason, such as the introduction of stacking disorder, the long range order in a crystal is interrupted this influences the resulting diffraction pattern.The calculated diffraction patterns of well-defined ice Ih and ice Ic are shown in Fig. 3 for both neutron and X-ray diffraction. Together with these patterns we also plot literature diffraction patterns for ice I which was formed in a variety of ways. Table 1 summarises the experimental conditions and routes through which this ice was formed. These patterns clearly do not correspond to hexagonal ice and in the past it has been generally concluded that this ice is therefore cubic. However, comparison with the perfect cubic pattern also reveals a poor match. The literature patterns clearly contain a peak at a d-spacing of 3.86 Å which is in the same position as the most intense peak in the hexagonal ice pattern. These experimental patterns of metastable ice I also have a region of raised intensity between 3.43 and 3.86 Å d-spacing and in addition the relative ratio of the peak intensities does not match the calculated patterns. Inspection of high resolution patterns also reveals other less obvious inconsistencies.12,30 To varying degrees the experimental patterns in Fig. 3 all contain features inconsistent with the cubic crystal system and to the best of our knowledge there is no diffraction pattern of ice which is a good match to that expected for well-defined cubic ice. Instead, metastable ice I always contains features associated with stacking disorder.
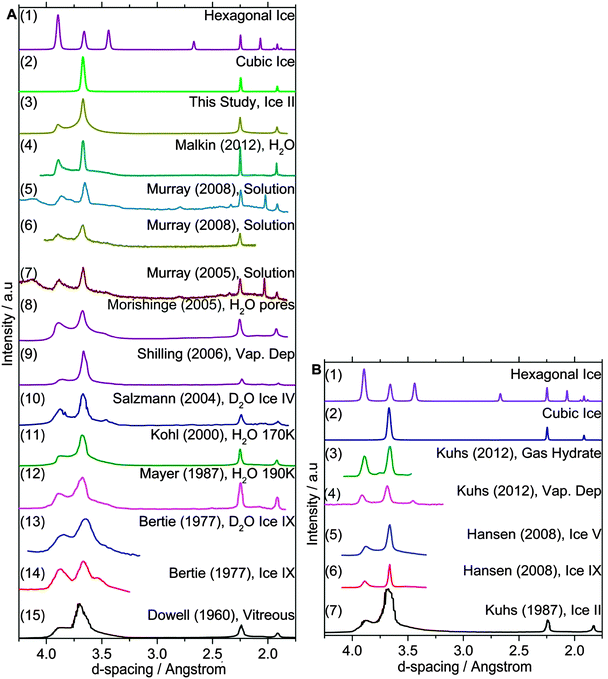 | ||
| Fig. 3 A selection of (A) X-ray and (B) neutron diffraction patterns of metastable ice I from the literature. Many of these patterns were digitised from the printed plots in the respective papers, and the quality of some of the older reproductions is relatively poor. Nevertheless, signatures of stacking disorder are apparent in all of these patterns, many of which were presented as ice Ic. The most obvious signatures of stacking disorder are the region between ∼4 and 3.25 Å and the peak at ∼3.8 Å. See details of each experiment and references in Table 1. | ||
| Plot | Ref. | |
|---|---|---|
| A1 | Hexagonal ice | Numerically simulated |
| A2 | Cubic ice | Numerically simulated |
| A3 | Ice II. Annealed from 100–165 K at 0.1 K min−1 | This study |
| A4 | Pure water droplets dvm ≈ 1 μm; Tf = 231.7 K | Malkin et al.30 |
| A5 | 32.4 wt% citric acid solution droplets; Tf = 219 K | Murray26 |
| A6 | 36.2 wt%, (NH4)3H(SO4)2 droplets; Tf = 178 K | Murray and Bertram31 |
| A7 | 43 wt% (NH4)3H(SO4)2 solution droplets; Tf = 188 K | Murray et al.6 |
| A8 | Formed in a 19 nm mesopores of silica at 220 K | Morishige and Uematsu16 |
| A9 | Deposition at 90 K. Annealed to 180 K at 5 K min−1 | Shilling et al.18 |
| A10 | D2O ice IV. Annealed from 90–151 K at 5 K min−1 | Salzmann et al.11 |
| A11 | H2O droplets quenched at 170 K. Measured at 113 K | Kohl et al.20 |
| A12 | Water droplets quenched at 190 K | Mayer and Hallbrucker25 |
| A13 | Recrystallized from D2O ice IX at 160 K | Bertie and Jacobs145 |
| A14 | Recrystallized from ice IX held at 160 K | Bertie and Jacobs145 |
| A15 | Vitreous (condensed H2O vapour <133 K) to ice I | Dowell and Rinfret19 |
| B1 | Hexagonal ice | Numerically simulated |
| B2 | Cubic ice | Numerically simulated |
| B3 | Decomposed deuterated CO2 hydrates at 175 K | Kuhs et al.9 |
| B4 | Condensed D2O vapour at 175 K | Kuhs et al.9 |
| B5 | Recrystallized from ice V at 175 K | Hansen et al.12,13 |
| B6 | Recrystallized from ice IX at 175 K | Hansen et al.12,13 |
| B7 | Recrystallized from ice II at 78 K | Kuhs et al.14 |
Stacking disorder in ice from a computational perspective
The propensity of ice I to grow with stacking-disorder has been observed in a large number of molecular dynamics and Monte Carlo simulations.30,39–42,44–58,64–66 Molecular simulations explore spatial and temporal regimes complementary to those accessible through experiments, providing microscopic insights on the evolution of cubic and hexagonal ice sequences in the ice embryos,39–46,48,50,52,58 the development and evolution of stacking disorder as the ice crystallites grow and consolidate,30,39,44,47 as well as on the extent and mechanisms of formation of stacking faults upon growth of well-defined faces of ice Ih and ice Ic at various degrees of supercooling.51,53,55–57The study of the structure of ice during nucleation and growth through molecular simulations faces three main challenges. First, the accuracy of the water models in describing the ice-liquid equilibrium temperature for ice I, and the relative stability of the cubic and hexagonal ice polymorphs. Of the most popular fully atomistic models of water, only those in the TIP4P family (TIP4P,67 TIP4P-Ew,68 TIP4P/2005,69 TIP4P/ice70) predict that ice I is the most stable crystal at ambient pressure.70,71 Of these, only TIP4P/ice predicts a melting temperature for ice Ih close to the experimental value, 272.2 vs. 273.15 K; the others underestimate Tm by at least 20 K.69–71 To our knowledge, the relative stability of hexagonal (Ih) and cubic (Ic) ice I polymorphs has not been established for any of these models. A significant issue related to the use of fully atomistic models is their computational cost, which limits the sampling time and size of simulation systems that can be modelled. The coarse-grained monatomic water model mW was developed to alleviate the costs of simulations of liquid water and ice, while keeping an accurate description of the structures and phase transitions between them.72 mW models water as a single particle that interacts through short-range two-body and three-body interactions; the latter encourage tetrahedral configurations that mimics the effect of hydrogen bonds at less than 1% of the computational cost of atomistic models.72 Hexagonal ice is the most stable crystal phase of mW water at ambient pressures, with a melting temperature of 274 K.72 Cubic ice is marginally less stable than hexagonal ice for the mW model.40,65,72 The second significant challenge arises from the rare nature of ice nucleation events, which calls for very long simulation trajectories or the use of advanced simulation methods. Ice nucleation by long brute force simulations has been achieved for mW water under a broad range of supercooled conditions40,49,52,73–82 and for TIP4P water supercooled at negative pressures.83 Among the advanced methods to sample rare events, umbrella sampling,84,85 metadynamics86–88 and forward flux sampling89–92 have been successfully used to nucleate ice at various degrees of supercooling and with several water models.50,93–103 The ice polymorphs obtained using different sampling methods are not always identical, even when the model and simulation conditions are the same.94,95 Differences in outcomes may have two origins: first, some are equilibrium sampling methods (e.g. umbrella sampling and metadynamics), while others are intrinsically non-equilibrium (e.g. forward flux sampling); second these methods have been implemented with different order parameters used to bias or identify the formation of ice. This leads to the third challenge for the study of the structure of ice formed in molecular simulations: the need for methods to identify water molecules as liquid, cubic ice and hexagonal ice. Several algorithms have been proposed for this purpose. Brukhno and co-workers introduced the first set of order parameters that distinguished cubic and hexagonal ice, however these were not rotationally invariant hence they cannot be used to identify arbitrarily oriented crystallites.50 Moore and co-workers then introduced CHILL,40 a rotationally invariant algorithm based on the correlation of bond-order parameters,104,105 which distinguishes cubic ice, hexagonal ice and liquid water from the number of staggered and eclipsed O⋯O bonds.40 Variants of the latter approach using bond-order parameters were also introduced by Li et al.,96 and Sanz et al.106
Unbiased simulations of homogeneous ice nucleation with the coarse-grained mW water model52,107,108 reveal that the ice embryos already have cubic and hexagonal ice sequences.39,40,42–45 The same was found in the nucleation of ice using the atomistic TIP4P/2005 and TIP4P water models combined with advanced sampling methods that do not bias the structure of the embryo.30,46,50 Ice embryos need to have at least ∼200 water molecules for stacking to be discernible, but they contain mixed cubic and hexagonal ice sequences from their inception (Fig. 4).39 The fraction of cubic stacking sequences (cubicity) of the crystallites nucleated from deeply supercooled water increases with their size, plateauing at about 60%.39,43 The ratio of cubic to hexagonal sequences is similar for ice nucleated from bulk water, solutions with salt, and water confined in nanopores and in nanoparticles.39,40,42–44,47,49 The stacks of cubic and hexagonal sequences in the ice nucleated and grown from deeply supercooled water are very short and their order seems to be random.30,39,50 These stacks reorganize as the crystallites consolidate in the process of growth.39 The evolution of the stacking disordered structures into hexagonal ice is outside of the time scale accessible to brute-force molecular simulations.
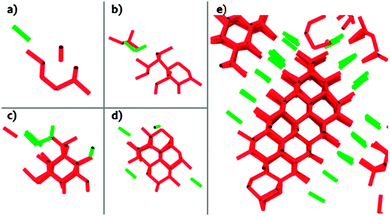 | ||
| Fig. 4 Development of stacking disorder within an ice embryo in mW water crystallized at 180 K. Adapted from ref. 39. Panels (a) to (e) display the evolution of the cubic (red) and hexagonal (green) ice features within a growing embryo. The lines connect pairs of molecules with cubic or hexagonal order, which only differ by a small displacement of the molecules with respect to the underlying layer, see Fig. 1. Pairs of molecules with cubic and hexagonal ice order are distinguished by the number of eclipsed and staggered intermolecular bonds within the pair, identified with the CHILL algorithm:40 molecules in hexagonal ice have three staggered and one eclipsed bond, and molecules in cubic ice have four staggered bonds. Well-defined stacks are not observed in embryos with less than ∼200 molecules. | ||
The free energies of the stacking disordered and hexagonal ices have been reported to be within ∼100 J mol−1,18,25,39,40,51,52,107,109–111 and calculations indicate that the free energy barrier for the creation of a critical embryo that is purely cubic or purely hexagonal is lower than for the creation of a stacking-disordered embryo.45 However, unbiased simulations of nucleation and growth of ice result in stacking disordered structures with comparable amount of cubic and hexagonal layers.30,39–44,47,49–51,55–57 It is possible to grow ice Ih from a hexagonal ice seed and ice Ic from a cubic seed using Umbrella Sampling simulations that very slowly bias the size of the embryo, sampling equilibrium configurations for each embryo size.45 These results suggest that stacking disorder has a kinetic origin: it is controlled by the non-equilibrium process of ice growth. A recent study, however, suggests that stacking disorder is thermodynamically favored.65
Hexagonal or cubic ice exposing the basal or [111] planes, respectively, have been reported to grow stacking disordered in simulations, irrespective of the water model used and the degree of supercooling.51,53,55–57 A configuration of a large-scale molecular dynamics simulation of ice grown at 270 K from liquid mW water is shown in Fig. 5. The simulation started with a slab of hexagonal ice exposing the basal planes to the supercooled liquid; 41 of the 81 new layers formed have cubic order. Interestingly, the cubicity of the ice grown at 270 K is lower than for ice grown at higher supercooling.51,57 A recent study of the equilibrium interface between ice and liquid in TIP4P/2005 water shows extensive reconstruction of the interface of the originally hexagonal ice slab, resulting in a stacking disordered ice interface with 60% cubic ice and 40% hexagonal ice in contact with liquid water.66 A systematic study of ice growth at different temperatures and a characterization of the relative stabilities of cubic and hexagonal ice for the water models employed would be needed to assess the temperature dependence of the cubicity of ice grown in simulations.
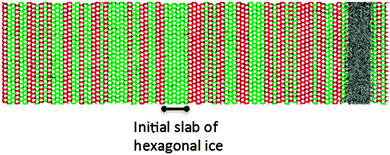 | ||
Fig. 5 Stacking disordered ice grown at 270 K. Water molecules are shown in green if they belong to a hexagonal sequence, red if they belong to a cubic sequence and in gray if they belong to the liquid. The simulation started with a slab of six layers of hexagonal ice (indicated by a black line below the picture) exposing the basal faces to the supercooled liquid. The simulations were performed with a periodic simulation cell containing 110![[thin space (1/6-em)]](https://www.rsc.org/images/entities/char_2009.gif) 592 molecules modeled with the mW water model,107 which has a melting temperature of 274 K.107 The CHILL algorithm40 was used to identify cubic and hexagonal ice. Cubic layers represent 40 out of the 81 new layers grown. 592 molecules modeled with the mW water model,107 which has a melting temperature of 274 K.107 The CHILL algorithm40 was used to identify cubic and hexagonal ice. Cubic layers represent 40 out of the 81 new layers grown. | ||
Ice tends to grow in a layer by layer fashion in the direction perpendicular to the stacking plane, (111) of ice Ic or (0001) of ice Ih.51,55,57 Recent studies57 reveal that hexagonal and cubic arrangements, which only differ by a small displacement of the molecules with respect to the underlying layer (Fig. 1), occur with similar probability on the basal surface of ice, and their competitive formation and dissolution slows down the growth rate of ice in the direction perpendicular to the basal plane.57 This in-layer competition does not occur in the prismatic and secondary prismatic planes,51,55–57,112,113 which only produced stacking faults in simulations at very high supercooling.53
Formation of stacking disordered ice can be considered a case of extensive cross-nucleation114–116 between ice polymorphs. Cross-nucleation involves the nucleation of one crystal structure (polymorph) on the face of another, and usually favours the faster growing polymorph, irrespective of whether it is the most stable crystal.116,117 Cross-nucleation between polymorphs that have a common plane, as is the case for (111) of ice Ic and (0001) of ice Ih, is very facile as it does not require the nucleation of an interfacial nucleation layer to seamlessly connect the two polymorphs.117,118 Clathrate hydrates provide other examples of cross-nucleation between water crystal polymorphs.117,118 The main differences between cross-nucleation in ice and in clathrates is that not only the stabilities of ice Ih and the hypothetical ice Ic polymorphs are almost identical, but that they apparently also have similar rates of growth.
Although cubic and hexagonal ice layers can stack seamlessly, in-layer competition between hexagonal and cubic order can result in the formation of defects when domains with distinct order propagate in the same layer.57 Large-scale simulations of ice growth revealed the presence of lines of defects, coupled 5- and 8-membered water rings, in the boundary between domains of cubic and hexagonal order coexisting within a single layer.53 It has been proposed that these defects facilitate the nucleation of stacking faults.53 A recent study, however, suggests that the 5–8 defects are not the origin but the result of in-layer competition between cubic and hexagonal order in the newly formed layer of ice.57 The density of these defects should increase with supercooling as the rate of nucleation of new layers on the growing ice surface becomes faster. The role that these defects and their annealing play on the long-term decrease of stacking disorder in ice is an open question that warrants further investigation.
Heterogeneous nucleation of ice has been only recently achieved in molecular simulations.48,58,119 The two surfaces studied, graphitic carbon and kaolinite, produce distinct preferential orientation of the critical ice embryos on the surface. Ice embryos expose the basal plane to the graphite surfaces, resulting in the growth of stacking disordered ice with the stacking plane parallel to the surface.48 Kaolinite, on the other hand, favours the formation of hexagonal ice embryos that expose the prismatic plane to the mineral surface.58 These embryos, however, are finite in size and expose all faces to liquid water. This implies that, upon growth, they can develop stacking faults. The experimental results in the next section show that ice nucleated by kaolinite presents significant stacking disorder, supporting the evidences from molecular simulations that the non-equilibrium growth process plays an important role in the development of stacking disorder in ice.
Heterogeneous freezing of water droplets
In the past, the structure of ice crystallised after homogeneous nucleation of pure water droplets at around −40 °C,27,30 and solution droplets below −40 °C,6,27–29,31,120 have been investigated. However, to date the structure of ice which crystallises following heterogeneous nucleation in water droplets has only been investigated through molecular simulations,48,58 and has not been subject to laboratory experiments. In this section, we present experiments where the aim was to quantify the degree of stacking disorder in ice which crystallises in droplets where nucleation was induced by well characterised heterogeneous ice nucleants. This builds on our previous research on the quantification of the efficiencies with which various solid materials nucleate ice when immersed in water droplets.59–62,121These experiments involved cooling water droplets containing solid nucleating agents at a controlled rate, measuring the freezing temperature and subsequently recording a diffraction pattern of the ice which crystallised. The technique is similar to that described previously,26,27,30,31 but with the exception that we now work with droplets containing nucleants. Fine powders of a variety of minerals and other solids were suspended in ultra-pure water (18.2 MΩ). The aqueous suspensions were mixed with paraffin oil (Fisher Scientific) and lanolin (Aldrich Chemical Company) in order to create water-in-oil emulsions with droplets of a volume median diameter, dvm, of 17 ± 3 μm. This was significantly larger than the 0.9 μm used by Malkin et al.30 and ensured that each droplet contained a representative number of sub-micron particles. The droplets sizes were then determined using an optical transmission microscope with a 10× objective. The X-ray diffractometer (Bruker D8 Advance, Cu Kα) used in these experiments was configured in standard 2θ reflection geometry and was equipped with an Anton Paar TTK450 temperature control stage.
In order to determine the temperatures at which the water droplets froze, the diffraction angle (2θ = ∼40°) of a strong reflection associated with all types of ice I was continually monitored upon cooling at 30 K min−1. This peak is insensitive to the phase of ice, only varying in intensity by 1.9% between ice well-defined Ih and ice Ic and being no larger for ice Isd (according to our calculated patterns, which is consistent with our measurements) and therefore provides a useful proxy for the amount of ice crystallised. The cooling rate of 30 K min−1 was chosen on the basis that we wanted to quantify stacking-disorder in ice which initially crystallised, and slower cooling rates allow more time for recrystallization of stacking-disorder. The area under the peak at ∼40° was normalised to the peak area at 173 K where all the droplets were frozen and the peak area was at its maximum. Plots of the fraction of pure water droplets (0.9 and 17 μm) and droplets containing kaolinite (∼17 μm) frozen, as a function of temperature during cooling, are shown in Fig. 6A.
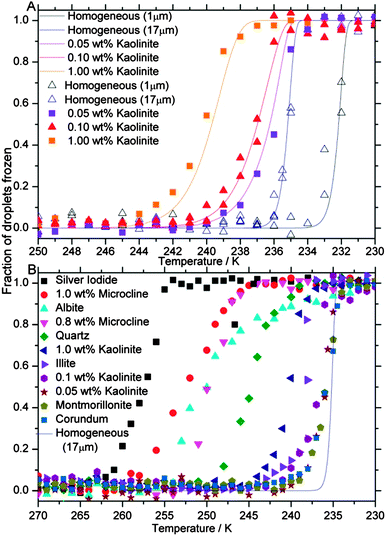 | ||
| Fig. 6 Fraction of droplets frozen as a function of temperature. (A) Shows curves for droplets of pure water and droplets containing various weight fractions of kaolinite cooled at 30 K min−1. Median droplet size was held almost constant in these experiments. The solid lines are based on time-dependent parameterisations of homogeneous freezing of pure water121 and heterogeneous freezing by kaolinite.60 (B) Shows curves for a range of solid nucleating agents. Error bars are omitted as they are comparable to symbol size. | ||
It is clear from Fig. 6A that the addition of kaolinite particles induces freezing at higher temperatures than droplets containing no particles (the median freezing temperature increases by 1 to 5 K depending on the weight fraction of kaolinite). This means that the mode of nucleation shifts from homogeneous to heterogeneous. In addition, the solid lines in Fig. 6A are the freezing curves predicted on the basis of literature parameterisations;60,121 the excellent agreement indicates that the presence of the oil and surfactant did not influence nucleation. The fraction frozen curves for droplets containing a range of other ice nucleants that triggered heterogeneous nucleation with median freezing temperatures as high as 257 K are shown in Fig. 6B.
Diffraction patterns of the sample between 2θ = 20–70° were recorded at 173 K, a temperature at which stacking-disorder was assumed to not change on the timescale of the diffraction measurement. The range of 2θ covers all of the strong ice Ic and ice Ih reflections, and the diffraction pattern for frozen droplets containing 0.1 wt% kaolinite is compared with the diffraction pattern for ice resulting from homogeneous freezing (for 0.9 μm droplets30) in Fig. 7. Also shown are the calculated ice Ih and ice Ic patterns. Despite ice nucleating heterogeneously on kaolinite, the ice Isd produced is almost indistinguishable to that seen after homogeneous nucleation, which was previously shown by Malkin et al.30 to have fully random stacking. Utilising molecular simulations, Cox et al.58 found that the prismatic face of hexagonal ice nucleates on kaolinite. Our results suggest that even if nucleation of one phase or another is preferred, the growth of stacking disordered ice subsequent to nucleation is controlled by kinetic factors during crystal growth.
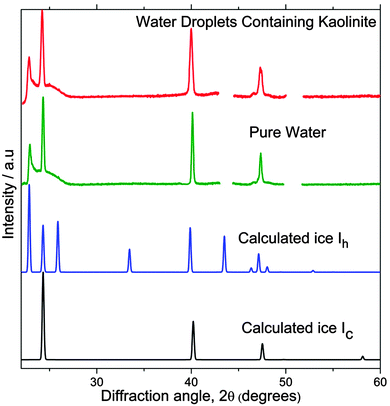 | ||
| Fig. 7 Experimental diffraction patterns for water droplets containing 0.1 wt% of kaolinite, cooled at a rate of 30 K min−1 compared with frozen pure water droplets of 0.9 μm from Malkin et al.30 Simulated diffraction patterns using DIFFaX of well-defined ice Ih and ice Ic are also shown. The gaps in the experimental pattern are where diffraction peaks from the sample support are observed. | ||
A fully random stacking sequence is consistent with a two-dimensional nucleation (or layer-by-layer growth) mechanism,122 where each successive layer nucleates independently and can either stack in a cubic or hexagonal fashion. Our result indicates that the probability of nucleating a cubic or hexagonal sequence is equal. This also implies that the crystal structure of the macroscopic frozen droplet is independent of the structure of the initial critical cluster that nucleates. This is important, because it is often assumed that nucleation of one particular phase will define or serve as a template for the resulting crystal growth.1 This has implications for the interpretation of the analysis of nucleation data using classical nucleation theory (CNT).
Several authors used experimentally determined nucleation rates to establish ice-water interfacial energies on the basis that ice Ic nucleates.32,121,123,124 Murray et al.121 justified this assumption on the basis of X-ray diffraction data reported in a separate study,27 which clearly contain features consistent with stacking-disorder. Huang and Bartell32 used electron diffraction data to identify their nanometre sized ice particles as ice Ic, but also note that there were ‘imperfections in the longer-range internal order’, which may also be consistent with stacking-disorder. In order to employ classical nucleation theory to derive the ice-water interfacial energy, these authors used the best available estimate of the thermodynamic properties of ice Ic.32,121,123,124 Given the intrinsic quantitative inaccuracies of CNT, the additional assumption that the critical cluster has the same structure as the final macroscopic crystal is in question, these interfacial energies should be taken with some caution.
Previous studies have shown that ice Isd transforms to ice Ih increasingly rapidly as temperature is elevated.8,13,27 For droplets suspended in an oil emulsion, where the only recrystallization mechanism is a solid-to-solid transformation, as opposed to a vapour or solvent mediated route,31 the time required for recrystallization increases rapidly below about 238 K.27 Hence, during cooling at 30 K min−1 droplets which froze below this temperature did not have the opportunity to transform to the stable ice Ih, locking the ice in the metastable structure in which it initially crystallised. We hypothesise that ice which initially forms at higher temperatures is also stacking-disordered, but freezing at higher temperatures may provide an opportunity for the ice to anneal. In order to explore this hypothesis, solid particles of different types with the capacity to nucleate ice at different temperatures were introduced into the droplets. The resulting diffraction patterns after complete crystallization are shown in Fig. 8. The patterns are arranged in order of lowest freezing temperature at the top and a pattern of fully annealed ice Ih at the bottom for comparison. It is evident from the observations that on increasing freezing temperature the peaks unique to ice Ih at 26, 33 and 44° all increase in intensity, the broad feature between 22 and 27° disappears, all peaks become increasingly sharp and the relative intensities of the peaks generally approaches that of ice Ih. This evolution of the diffraction patterns is consistent with higher freezing temperatures allowing the initially stacking-disordered ice to anneal leading to ice which is structurally closer to ice Ih.
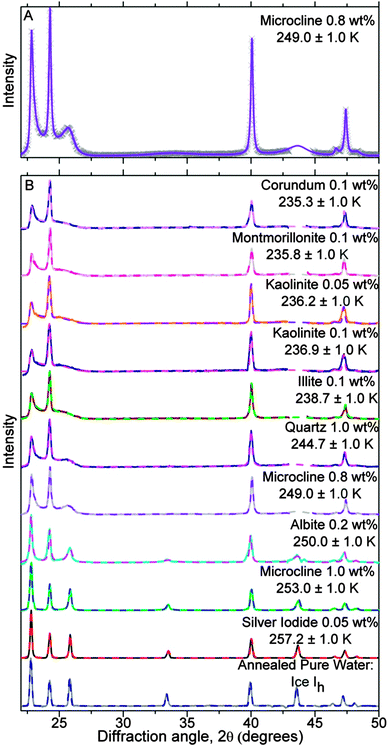 | ||
| Fig. 8 Experimental and model best fit X-ray diffraction patterns for frozen droplets containing a variety of solid inclusions (dvm ∼ 17 μm), which froze over a range of median freezing temperatures (Tf). (A) Is an example of experimental data (crosses) and MCDIFFaX fit (solid line) for droplets containing microcline. (B) Contains experimental (solid line) and MCDIFFaX fit (dashed line) diffraction patterns for droplets containing a range of ice nucleants. The data was normalized to the largest peak. The fitted stacking probabilities are listed in Table 3. The MCDIFFaX fits here included 2nd order memory effects. The results were indistinguishable from the 1st order model indicating 2nd order memory effects were not significant. | ||
Modelling of stacking disorder in ice I
In order to quantitatively characterize the stacking disorder in ice I, we employed the DIFFaX (Diffracted Intensities from Faulted Xrystals, v1.813) computer program for calculating powder diffraction patterns of crystals containing stacking disorder.125 DIFFaX uses a general recursion algorithm and requires information about the structure of the layer, the stacking probabilities and the symmetry relationships between the stacked layers. The calculated pattern is convolved with a profile function in order to account for finite crystallite size and instrument broadening effects. DIFFaX can be configured to take into account varying complexities in stacking disorder. The simplest form of stacking disorder in ice is where cubic and hexagonal sequences are randomly arranged. For example, Malkin et al.30 showed that ice resulting from homogeneous nucleation in pure water droplets was fully random with 50% cubic and 50% hexagonal stacking. More complex stacking can also be possible where there is correlation or memory in the stacking sequence. For example, once in a hexagonal stacking sequence the probability of transitioning back to cubic may be small, but when it does there may also be a low probability of transitioning back again. This would result in extended clusters of cubic and hexagonal sequences. In this example, the correlations are between nearest neighbour layers (1st order memory effects; Kuhs et al.9 define this as an interaction range, s, of 3), but there can also be correlations between sequences further apart (2nd, 3rd, etc. order memory effects; s = 4, 5 etc.). Kuhs et al.9 and Hansen et al.12,13 found that the ice they made through a variety of routes contained 2nd order (s = 4) memory effects. In what follows, we explore the possibility of complex memory effects.Stacking disordered ice with no memory effects (s = 2) can be described in DIFFaX using a single stacking probability, Φc, which indicates the likelihood of cubic stacking. The probability of hexagonal stacking, Φh, is simply 100 − Φc. To model 1st order (s = 3) memory effects, it is necessary to use two independent stacking probabilities, Φcc and Φhc which define the probabilities of cubic stacking after a previous cubic or hexagonal stacking events, respectively. The two hexagonal stacking probabilities, Φch and Φhh, are obtained from 100 − Φcc and 100 − Φhc. In this paper we have modified the original terminology used by Malkin et al.30 so that we can describe higher order memory effects (the relationship between the different notations for stacking probabilities is summarised in Table 2).
| Old 1st order notation Malkin et al.30 | New 1st order notation | 2nd order notation | Kuhs et al.9 | 2nd → 1st order notation |
|---|---|---|---|---|
| Φ cc | Φ ccc | Φ ccc = 100 × δ |

|
|
| Φ hcc | Φ hcc = 100 × β | |||
| Φ c | Φ hc | Φ chc | Φ chc = 100 × γ |

|
| Φ hhc | Φ hhc = 100 × α | |||
| Φ h | Φ ch = 100 − Φcc | Φ cch = 100 − Φccc | ||
| Φ hch = 100 − Φhcc | ||||
| Φ hh = 100 − Φhc | Φ chh = 100 − Φchc | |||
| Φ hhh = 100 − Φhhc | ||||
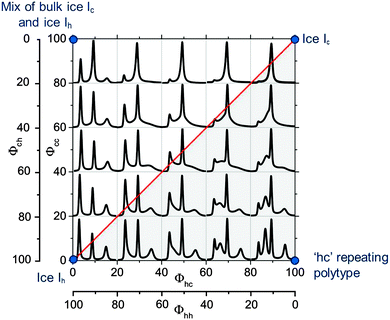
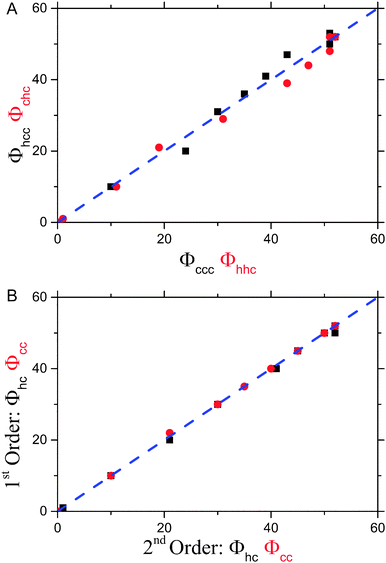
Since both, Φcc and Φhc, can vary independently between 0 and 100% there are a wide range of possible ice Isd structures. The relationship between ice structure, and Φcc and Φhc is illustrated in the “stackogram” shown in Fig. 9. If the two stacking probabilities Φhc and Φcc are equal then there is no 1st order memory in the stacking sequences of the ice structure and we refer to this as random stacking (red line in Fig. 9) which can be described with Φc only. The top right of the stackogram (Fig. 9) represents perfect ice Ic, while the bottom left describes perfect ice Ih. In the case where Φhc and Φcc are not equal then there is a memory in the stacking sequences and there are a number of distinct regimes which can be defined. Anywhere to the right of the random line is a regime with the same close-packed planes tending towards the strictly alternating stacking sequence in the third dimension (polytype) at the bottom right of the stackogram (hexagonal, cubic, hexagonal, cubic etc.). As will be seen later no known ice sample falls in this half of the stackogram. The region above the random line is characterised by extended sequences of either cubic or hexagonal stacking, or extended regions of both. The top left of the diagram is for a sample consisting of a 50% mixture of bulk cubic and bulk hexagonal crystallites.
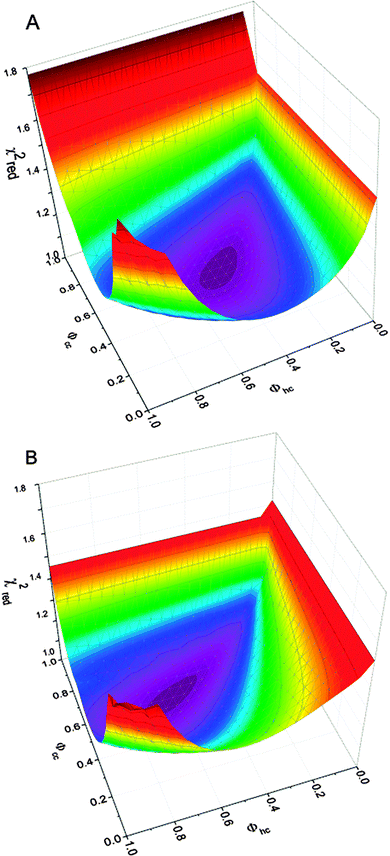
In order to illustrate the sensitivity of the diffraction pattern to stacking disorder and 1st order memory effects we have plotted an array of calculated diffraction patterns in Fig. 9. We focus on the region around the 111 peak of cubic ice where the pattern is particularly sensitive to stacking disorder. The red line indicates a combination of stacking probabilities that produces random stacking (Φhc = Φcc). Above this line Φhc < Φcc whereas, below Φhc > Φcc. One striking feature of this plot is the strong sensitivity of the diffraction pattern to the values of Φhc and Φcc, which means that finding a unique fit to the diffraction pattern is highly likely. This is illustrated in Fig. 10 where the 1st order memory model was used to produce patterns for many combinations of Φhc and Φcc, and the goodness of the fit is expressed as χ2. There is a clear single minimum and no local minima. Malkin et al.30 allowed Φhc and Φcc to vary independently, hence they made no a priori assumption about which type of stacking was present in their ice (i.e. random or 1st order memory effects). They found that for ice which nucleated homogeneously from pure water there was no memory effect and the resulting ice was fully stacking disordered (i.e. Φhc and Φcc = 50%).
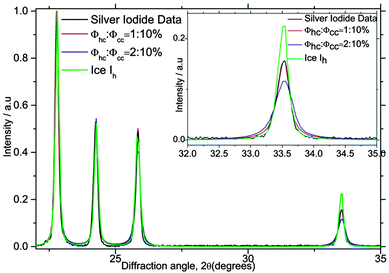
The diffraction pattern is remarkably sensitive to even small degrees of stacking disorder. This is illustrated in Fig. 11 where droplets containing silver iodide froze around 257 K and the peaks associated with hexagonal character are clearly present. However, the pattern is clearly inconsistent with well-defined hexagonal ice and instead we find, Φhc = 1% and Φcc = 10%. Note that the fitted diffraction pattern from ice annealed at just below 0 °C has a Φhc and Φcc = 0% as expected for ice Ih. This indicates that we can detect stacking fault probabilities on the order of only 1% in ice Ih.
Kuhs et al.9 concluded that the ice they made via decomposition from gas hydrates and vapour deposition contained 2nd order memory effects (s = 4). Hence, it is prudent to analyse the new data with a DIFFaX model capable of resolving second order memory interactions. In order to resolve 2nd order memory effects (s = 4), a model with four independent stacking probabilities (Φccc, Φhcc, Φchc and Φhhc) is required in DIFFaX. The relationships between these stacking probabilities and the parameters defined by Hansen and co-workers,9,12 are given in Table 2.
In the model employed by Hansen et al.12,13 and Kuhs et al.9 the best fit to their diffraction data was found using a least-square minimisation approach. To obtain the best possible fit to our diffraction data we have written a new computer programme (MCDIFFaX) which embeds DIFFaX in a least-square environment and uses a Monte Carlo algorithm to search for the best values of the various stacking probabilities, lattice constants, peak profile parameters and zero shift.126 Our fitting strategy is to start off with Φc = 0.5 and no memory effects. Once the χ2 has converged, first and second order memory effects are introduced successively as the programme runs to see if this is required to improve the quality of the fit to the data.
In addition to the least-square approach we have used a grid sampling approach where the four stacking probabilities in the 2nd order memory model were systematically varied independently across their entire ranges from 0 to 100%. This test allowed us to verify the approximate location of the global minimum. This was initially done in large steps, for example 10%. Once a rough indication of the best values was obtained, a higher resolution run (e.g. steps of 1%) was performed over a smaller range of numbers to improve the accuracy of the result. The resultant structure file is compared to the observed structural results and scored using a delayed cross correlation function. The cross correlation function allows the identification of all possible stacking ratio fits. The maximum value of the cross correlation is used as a score of how similar the results are, where score = 1 − maximum correlation. This produces a 4D array of scores between 0 and 1. The dimensions of the array are determined by the number of steps in (Φccc, Φhcc, Φchc and Φhhc). The first minimum found in this 4D array is the lowest score present. An algorithm was developed to locate all of the minima. The current minimum value is initially set to the lowest minimum score and the cell (set of parameters, Φccc, Φhcc, Φchc and Φhhc) where the lowest minimum score occurs is marked as having been visited. All not yet visited cells are then searched to see if they contain a score between the current minimum value and a small positive increment to it. Any cells found that are within two neighbouring cells in any direction of an already visited cell are assumed to belong to that minimum peak. If a cell is found that is further away and not touching any neighbouring cells is considered to be another (second) minimum peak and is recorded and marked as visited. The current minimum value is then incremented by the small positive increment and the process repeated until the current minimum value exceeds 1. Fitting all the diffraction patterns using this technique showed that there was a single minimum in the parameter space and confirmed the result of the least squared routine.
The 2nd order memory MCDIFFaX fits to the diffraction patterns are shown in Fig. 8. We also fitted a 1st order memory model to the same data and the resulting stacking probabilities are shown together with those for the 2nd order memory model in Table 3. The correlations between the various stacking probabilities in Table 3 are illustrated in Fig. 12. In the case where 2nd order memory effects were not deemed important there should be no dependence on the structure of the sequence two stacking events away, i.e. Φhcc = Φccc and Φchc = Φhhc. Hence, it is clear from Fig. 12A that there is no substantial 2nd order memory effect. The only pattern in which there may be a minor 2nd order memory effect is for droplets containing microcline which froze around 259 K and for which we found Φhcc = 20% and Φccc = 24%. The DIFFaX fit to the experimental homogeneous nucleation diffraction pattern in ref. 30 showed no indication of 1st order memory effect, this has been corroborated by re-analyzing the data with MCDIFFaX. In contrast, Kuhs et al.9 and Hansen et al.12 found strong differences between their equivalent parameters indicating complex stacking patterns in ice made in a variety of different ways. Given, that Kuhs et al.9 and Hansen et al.12 show strong 2nd order memory effects in the ices recrystallized from high pressure phases, the possibility of even higher order memory effects should not be discounted.
| Symbol (Fig. 6) | Materiala | T onset ± 1.0/K | T f ± 1.0/K | 1st order model | 2nd order model | Cubicityd (%) | ||||||||
|---|---|---|---|---|---|---|---|---|---|---|---|---|---|---|
| Φ hc (%) | Φ cc (%) |
χ
red
2![[thin space (1/6-em)]](https://www.rsc.org/images/entities/char_2009.gif) b b |
Φ ccc (%) | Φ hcc (%) | Φ chc (%) | Φ hhc (%) | Scorec | Φ hc (%) | Φ cc (%) | |||||
a Kaolinite (KGa-1b) and montmorillonite (STx-1) (Clay Mineral Society, West Lafayette, USA); NX-illite (B+M Nottenkamper, Munich, Germany); quartz, microcline and albite (Ward's Natural Science Establishment Inc., New York, USA); silver iodide (>99.99%) and corundum (>99.9%) from Sigma-Aldrich.
b The reduced chi-squared (χred2) is defined as the sum of the squared difference between model and experimental pattern at each point in 2θ divided by the number of degrees of freedom.
c Score using a delayed cross correlation function: score = 1 − maximum correlation (http://paulbourke.net/miscellaneous/correlate). Notation conversion and calculating Φhc and Φcc from MCDIFFaX model ratio can be found in Table 2.
d Cubicity is calculated by:  . .
|
||||||||||||||

|
Corundum 0.1 wt% | 237.0 | 235.3 | 52 | 52 | 1.05 | 52 | 52 | 52 | 52 | 0.02 | 52 | 52 | 52 |

|
Montmorillonite 0.1 wt% | 238.0 | 235.8 | 52 | 52 | 1.09 | 51 | 53 | 52 | 52 | 0.04 | 52 | 52 | 52 |

|
Kaolinite 0.05 wt% | 239.0 | 236.2 | 50 | 50 | 1.07 | 51 | 50 | 52 | 51 | 0.03 | 52 | 50 | 51 |

|
Kaolinite 0.1 wt% | 241.0 | 236.9 | 50 | 50 | 1.08 | 51 | 50 | 48 | 51 | 0.04 | 50 | 50 | 50 |

|
Illite 0.1 wt% | 245.0 | 238.7 | 45 | 45 | 1.07 | 43 | 47 | 44 | 47 | 0.03 | 45 | 45 | 45 |

|
Kaolinite 1.0 wt% | 244.0 | 239.9 | 40 | 40 | 1.04 | 39 | 41 | 39 | 43 | 0.02 | 41 | 40 | 41 |

|
Quartz 1.0 wt% | 244.0 | 244.7 | 40 | 40 | 1.06 | 39 | 41 | 39 | 43 | 0.02 | 41 | 40 | 41 |

|
Microcline 0.8 wt% | 252.0 | 249.0 | 30 | 35 | 1.07 | 35 | 36 | 29 | 31 | 0.03 | 30 | 35 | 32 |

|
Albite 0.2 wt% | 256.0 | 250.0 | 20 | 30 | 1.08 | 30 | 31 | 21 | 19 | 0.04 | 21 | 30 | 23 |

|
Microcline 1.0 wt% | 259.0 | 253.0 | 10 | 22 | 1.09 | 24 | 20 | 10 | 11 | 0.04 | 10 | 21 | 11 |
| ■ | Silver Iodide 0.05 wt% | 263.0 | 257.2 | 1 | 10 | 1.04 | 10 | 10 | 1 | 1 | 0.02 | 1 | 10 | 1 |
| Annealed ice Ih | 0 | 0 | 1.03 | 0 | 0 | 0 | 0 | 0.01 | 0 | 0 | 0 | |||
Since there is no significant 2nd order memory in ice nucleated homogeneously or heterogeneously from pure water the first order variables Φhc and Φcc are therefore adequate to describe this ice. This is demonstrated in Fig. 12B, where the Φhc and Φcc from the 1st order memory fitting procedure and the same values derived from the 2nd order memory model are compared (the stacking probabilities from the 2nd order memory model are converted to 1st order equivalents using the relationships set out in Table 2). Hence, the remaining discussion of stacking in ice from water droplets is based around the 1st order memory model, and the Φhc and Φcc parameters.
At median freezing temperatures below ∼237 K, the ice is fully stacking-disordered (Φhc and Φcc ≈ 50%) and indistinguishable from ice resulting from homogeneous nucleation in 0.9 μm sized droplets (see Fig. 7 and 8). Fig. 13 shows that as the freezing temperature increases, Φhc and Φcc decrease and the proportion of cubic sequences decreases. One striking result from this study is that there is still detectable stacking disorder even at the highest studied median freezing temperature of 257 K. In this instance Φhc = 1% and Φcc = 10%. This corresponds to approximately one cubic sequence (or stacking fault) in 100 layers of what is dominantly ice Ih.
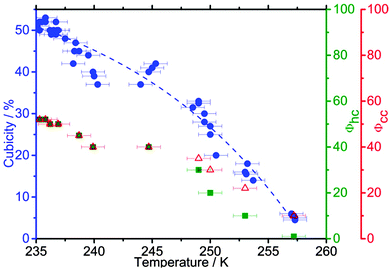 | ||
| Fig. 13 Cubicity, Φcc and Φhc as a function of Tf for droplets containing a range of heterogeneous ice nucleants; the diffraction patterns and MCDIFFaX fits are shown in Fig. 8. The fit through the cubicity data is for illustrative purposes only. | ||
At freezing temperatures above 249 K, the stacking probabilities Φhc and Φcc are no longer equivalent, indicating that the stacking disorder is no longer random (s = 3). This is illustrated in the stackogram in Fig. 14 where the points corresponding to freezing temperatures higher than 249 K fall above the random stacking line. This suggests that domains of hexagonal ice form with higher freezing temperatures, together with smaller domains of stacking disordered ice. The monotonic decrease in the fraction of cubic sequences with increasing freezing temperature is consistent with the hypothesis that the initial ice to crystallize is ice Isd which anneals to stable ice Ih if the experimental conditions allow. Hence, the structure of the resulting ice is a function of the temperature at which nucleation occurred, and the time available for re-crystallization, rather than the mode or nature of the nucleation event. Slower cooling rates had a similar effect to warmer freezing temperatures, with slower cooling rates leading to fewer cubic sequences. The lack of dependence of stacking-disorder on nucleation mechanism suggests that whenever ice grows from supercooled water in nature or technological applications it initially grows as ice Isd with randomly arranged 50% hexagonal and 50% cubic stacking sequences. Though, in many situations latent heat release may rapidly elevate the temperature to a regime in which stacking-disorder will anneal. These results offer detailed insights into the crystallization process of water, a process important in many fields,127 and suggest that stacking-disorder plays an important transient role in the crystallization of ice from water in general.
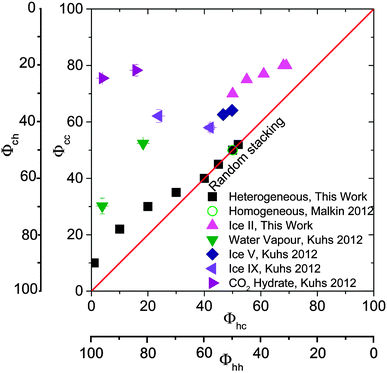 | ||
| Fig. 14 A stackogram illustrating the stacking probabilities (Φhc and Φcc) of ice I resulting from heterogeneous nucleation in water droplets from this study as well as those from: Malkin et al.30 for homogeneous nucleation in water; Kuhs et al.9 who report stacking probabilities in ice I made from CO2 hydrates and vapour deposition onto a cold substrate; and Hansen et al.12,13 who made ice Isd from ice V and IX. Φhc and Φcc would both equal 100 for hypothetical perfect cubic ice Ic. | ||
Stacking disorder in ice I made via routes other than from liquid water
The equivalent 1st order memory stacking probabilities Φhc and Φcc for ice I made via the recrystallization of ice V and IX,12,13 the decomposition of CO2 hydrates9 and via vapour deposition9 are illustrated in Fig. 14. As discussed above, both Kuhs et al.9 and Hansen et al.12,13 report 2nd order memory effects, information which is not possible to plot on a 2D plot, hence the stacking probabilities reported by those authors have been converted to Φhc and Φcc. The details of the translation the parameters given by Hansen and co-workers to Φhc and Φcc can be found in Table 2. Additionally, we plot the stacking probabilities for ice from liquid water and new data for ice recrystallized from ice II.It is striking that all of the data in the stackogram (Fig. 14) is above of, or on, the random line (i.e. where Φhc ≤ Φcc). This is perhaps consistent with the fact that stacking disorder in ice is a result of kinetic limitations in the growth of ice I and the stacking sequences never tend towards more ordered sequences which would be to the right (Φhc > Φcc) of the random line. In general, ice which forms at higher temperatures tends to contain larger domains of hexagonal sequences. It is also evident that ice made in different ways seems to occupy different parts of the stackogram. Ice from liquid water is either at the random line for ice which nucleates at the lowest temperatures or just above the random line for ice which nucleated at warmer temperatures where domains of hexagonal sequences form. Whereas, ice formed from re-crystallisation of high pressure phases and gas hydrates has Φcc greater than 50%. More work is required to understand what causes the variation in ice Isd generated through different pathways.
The results in Fig. 14 for ice I recrystallized from ice II were performed for this study. The ice II sample was prepared by freezing 1 mL of H2O in an indium gasket inside a Specac press die precooled to 77 K, followed by heating of the sample to 233 K at 0.4 GPa. The sample was then rapidly quenched to 77 K, recovered under liquid nitrogen and transferred onto an XRD sample holder under liquid nitrogen. This was subsequently mounted on a cold stage at 98 K of our X-ray diffractometer as described above. Quantitative Rietveld refinement showed that the ice II sample was contaminated with only 2–5% ice V. We then followed the recrystallisation of the ice II as the samples were warmed at rates of between 0.1 to 30 K min−1 in separate experiments. The samples were heated from 98–148 K (in 5 K increments) and then to 168 (in 2 K increments) at the defined rate. In order to record diffraction patterns of the ice at each increment without further transformation of the ice during the period of the measurement, the samples were cooled back to 110 K at each increment. Recrystallization to ice Isd was observed between 150 and 165 K. A selection of the resulting diffraction patterns for ice Isd, immediately after recrystallization, are shown in Fig. 15 together with the MCDIFFaX fits. The resulting Φhc and Φcc values are listed in Fig. 14 and Table 4. This ice falls well above the random line in a similar region to ice recrystallized from ice V and IX. Intriguingly, ice Isd from ice II is the closest to well-defined cubic ice of all the ices summarised in Fig. 14.
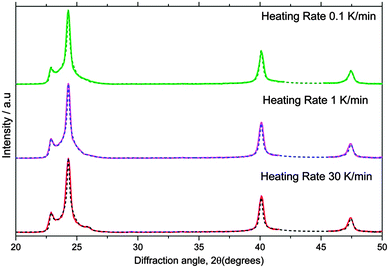 | ||
| Fig. 15 X-ray diffraction patterns of ice Isd recrystallized from ice II (solid lines) together with MCDIFFaX fits including 2nd order memory effects (dashed lines). | ||
| Heating rate K min−1 | 2nd order model | Cubicitya (%) | ||||||
|---|---|---|---|---|---|---|---|---|
| Φ ccc (%) | Φ hcc (%) | Φ chc (%) | Φ hhc (%) | χ 2 | Φ hc (%) | Φ cc (%) | ||
| a Cubicity is calculated as in Table 2. | ||||||||
| 0.1 | 84.5 | 59.2 | 49.8 | 66.1 | 0.07 | 56.8 | 67.4 | 73.3 |
| 0.5 | 83.6 | 57.2 | 48.1 | 64.0 | 0.13 | 55.2 | 66.2 | 71.4 |
| 1 | 83.1 | 49.7 | 45.8 | 57.9 | 0.16 | 47.8 | 62.3 | 67.0 |
| 10 | 81.0 | 49.8 | 41.3 | 57.9 | 0.06 | 47.7 | 61.7 | 63.3 |
| 30 | 77.6 | 47.6 | 40.6 | 57.9 | 0.12 | 45.7 | 59.7 | 58.8 |
It is apparent from Table 4 and Fig. 14 that the stacking ratio of ice Isd recrystallized from ice II is dependent on the heating rate. There is a monotonic decrease in the fraction of cubic sequences with increasing heating rates, suggesting that increasing the rate of heating promotes the recrystallization of ice II to ice Ih or the transformation of cubic sequences to hexagonal sequences. Thus, cubic stacking seems to be favoured kinetically.
The resulting stacking ratios from the 2nd order memory model, in Table 4, identify that there is a 2nd order memory effect since Φhhc ≠ Φchc and Φhcc ≠ Φccc. The probability of appearance of a particular type of stacking sequence is affected by the next-nearest stacking sequences. The 2nd order memory grid sampling programme also identified multiple minima. However, upon further investigation and comparison of the numerically calculated fits with the experimental data the lowest scoring minima was the only reasonable fit; the best fits can be seen in Fig. 15. The ice II to ice I transition is endothermic and therefore there is no associated release of latent heat.128 This is perhaps why the sample forms ice which is furthest of any from the stable hexagonal structure and closest to perfect ice Ic.
Symmetry of ice Isd
The six-fold rotational symmetry in crystals of ice Ih is related to the six-fold screw axis in its crystal structure. Introduction of cubic sequences into a hexagonal structure disrupts the six-fold screw axis, but does not affect the three-fold rotational symmetry on the same axis. Hansen et al.13 recognised this and identified the space group P3m1 for ice I containing stacking disorder. This space group is in the trigonal crystal system, a subgroup of the hexagonal crystal family. This was also recognised in the past by Hallet et al.129 who also showed numerous images of atmospheric ice crystals with three-fold rotational symmetry. A review of atmospheric trigonal ice crystals reveals that trigonal ice crystals occur over a wide range of atmospheric conditions and have been observed in clouds all around the globe both in the troposphere and stratosphere.130Conclusion
The emerging picture of ice I is of a highly variable and much more complex material than was typically thought in the past. All diffraction patterns for what was identified as cubic ice in the past contain features consistent with a substantial degree of stacking disorder and there exists no pattern indicative of well-defined cubic ice (to the best of our knowledge). We argue that the name stacking disordered ice, ice Isd, is the most appropriate name for this material. This name has now been used in the literature for several years,4,30,58,62,123,124,131–134 and we recommend it is used in place of the term cubic ice where the ice is stacking disordered. The term cubic ice should be reserved for well-defined ice I with cubic space group Fd![[3 with combining macron]](https://www.rsc.org/images/entities/char_0033_0304.gif) m.
m.
One striking feature of ice Isd is the fact that it is highly variable with the memory within the structure of ice Isd being strongly dependent on the route through which the ice was formed. Ice which forms homogeneously from pure water is fully stacking disordered, whereas ice recrystallized from high pressure crystal phases, for example, has a more complex structure in which there are correlations between nearest and next-nearest layers. The varying degrees and nature of stacking disorder raises important questions about the validity and applicability of the physical data for metastable ice I. Much of this data was collected without a record of the nature of the stacking disorder. Revisiting data such as the latent heat of transformation of ice Isd to ice Ih with well characterised ice Isd may resolve the substantial discrepancies in the reported values (23 to 160 J mol−1).8,18,20,21,25,109,135–137 It is possible that the broad range of enthalpies of transformation reported in these studies are in part related to the variability in stacking disorder in ice Isd,11 although it may also reflect variability in other structural defects. In addition, it was very recently found that there are signatures in the Raman spectrum of stacking disorder and that the spectral features depend on the nature of the stacking disorder in ice.134 As a community, we should also consider revisiting measurements of thermodynamic quantities, (e.g. heat capacity and vapour pressure) as well as interfacial energies, optical constants and spectroscopic properties using well-characterized ice in order to understand the relationship between stacking disorder and the physical properties of ice Isd.
The new results presented in this work reveal that stacking disorder can be important in ice crystallized at much higher temperatures than previously thought. We showed that resulting ice heterogeneously nucleated at 257 K contains measurable stacking disorder. At these warm temperatures stacking disorder is likely to be transient, but nevertheless it appears to be an intermediate in the crystallisation of water to ice under conditions pertinent to much of the Earth's atmosphere. At below ∼200 K, which is relevant for stratospheric clouds, equatorial cirrus clouds and mesospheric clouds, stacking disorder will likely persist for extended periods of time and these clouds may even be made of ice Isd.6,8,138 This is consistent with the appearance of ice crystals in very cold cirrus with three-fold symmetry,139 since ice Isd has a trigonal space group. Intriguingly, ice crystals with three-fold symmetry are also observed in much warmer clouds (see Murray et al.130).
Given what we have learnt about stacking disorder in ice, does well-defined cubic ice exist? We are not aware of any diffraction evidence for well-defined cubic ice. However, there are scattered reports which suggest that well-defined cubic ice may exist. A rare halo at 28° to the sun, called Scheiner's Halo, has been observed and is consistent with octahedral crystals of cubic ice.140,141 Others have suggested that angles between crystallites in snow crystals are consistent with growth off the faces of an initial crystal of cubic ice with an octahedral shape.142 Crystals sampled in the polar stratosphere sometimes have what appears to be 4-fold rotational symmetry consistent with crystals of cubic ice with a cubic habit,143 and crystals grown from vapour deposition around 200 K in the laboratory have been observed with an apparent cubic morphology.144 Whilst we cannot rule out the existence or possibility of creating true cubic ice, there is an increasing realisation that there is strong propensity for ice I to grow with stacking disorder.
Acknowledgements
The authors thank R. J. Herbert for writing the chi-square mapping routine and K. J. Baustian, S. L. Broadley, J. D. Atkinson and A. H. Nguyen for useful discussions. This study was funded by the European Research Council (FP7, 240449 ICE), the Natural Environment Research Council (NE/I019057/1, NE/I020059/1, NE/I013466/1, NE/K004417/1), and the National Science Foundation (CHE-1309601 and CHE-1305427). C. G. Salzmann would like to acknowledge the Royal Society (UF100144) and the Leverhulme Trust (RPG-2014-04) for funding.References
- J. W. Mullin, Crystallization, Elsevier, Oxford, UK, 2001 Search PubMed.
- G. J. Morris and E. Acton, Cryobiology, 2013, 66, 85–92 CrossRef PubMed.
- J. G. Morris, E. Acton, B. J. Murray and F. Fonseca, Cryobiology, 2012, 64, 71–80 CrossRef PubMed.
- J. K. W. Lam, J. I. Hetherington and M. D. Carpenter, Fuel, 2013, 113, 402–406 CrossRef CAS PubMed.
- B. J. Murray, S. L. Broadley and G. J. Morris, Fuel, 2011, 90, 433–435 CrossRef CAS PubMed.
- B. J. Murray, D. A. Knopf and A. K. Bertram, Nature, 2005, 434, 202–205 CrossRef CAS PubMed.
- B. J. Murray and E. J. Jensen, J. Atmos. Sol.-Terr. Phys., 2010, 72, 51–61 CrossRef CAS PubMed.
- D. M. Murphy, Geophys. Res. Lett., 2003, 30, 2230, DOI:10.1029/2003GL018566.
- W. F. Kuhs, C. Sippel, A. Falenty and T. C. Hansen, Proc. Natl. Acad. Sci. U. S. A., 2012, 109, 21259–21264 CrossRef CAS PubMed.
- G. P. Arnold, E. D. Finch, S. W. Rabideau and R. G. Wenzel, J. Chem. Phys., 1968, 49, 4365–4369 CrossRef CAS PubMed.
- C. G. Salzmann, E. Mayer and A. Hallbrucker, Phys. Chem. Chem. Phys., 2004, 6, 1269–1276 RSC.
- T. C. Hansen, M. M. Koza and W. F. Kuhs, J. Phys.: Condens. Matter, 2008, 20, 285104 CrossRef.
- T. C. Hansen, M. M. Koza, P. Lindner and W. F. Kuhs, J. Phys.: Condens. Matter, 2008, 20, 285105 CrossRef.
- W. F. Kuhs, D. V. Bliss and J. L. Finney, J. Phys., 1987, 48, 631–636 Search PubMed.
- K. Morishige, H. Yasunaga and H. Uematsu, J. Phys. Chem. C, 2009, 113, 3056–3061 CAS.
- K. Morishige and H. Uematsu, J. Chem. Phys., 2005, 122, 44711 CrossRef PubMed.
- D. C. Steytler, J. C. Dore and C. J. Wright, J. Phys. Chem., 1983, 87, 2458–2459 CrossRef CAS.
- J. E. Shilling, M. A. Tolbert, O. B. Toon, E. J. Jensen, B. J. Murray and A. K. Bertram, Geophys. Res. Lett., 2006, 33, L17801 CrossRef.
- L. G. Dowell and A. P. Rinfret, Nature, 1960, 188, 1144–1148 CrossRef CAS.
- I. Kohl, E. Mayer and A. Hallbrucker, Phys. Chem. Chem. Phys., 2000, 2, 1579–1586 RSC.
- J. A. McMillan and S. C. Los, Nature, 1965, 206, 806–807 CrossRef CAS.
- H. Grothe, H. Tizek, D. Waller and D. J. Stokes, Phys. Chem. Chem. Phys., 2006, 8, 2232–2239 RSC.
- A. Elarby-Aouizerat, J.-F. Jal, J. Dupuy, H. Schildberg and P. Chieux, J. Phys. Colloques, 1987, 48, C1-465–C461-470 Search PubMed.
- H. König, Z. Kristallogr., 1943, 105, 279–286 Search PubMed.
- E. Mayer and A. Hallbrucker, Nature, 1987, 325, 601–602 CrossRef CAS.
- B. J. Murray, Environ. Res. Lett., 2008, 3, 025008 CrossRef.
- B. J. Murray and A. K. Bertram, Phys. Chem. Chem. Phys., 2006, 8, 186–192 RSC.
- B. J. Murray and A. K. Bertram, in Physics and Chemistry of Ice, ed. W. F. Kuhs, The Royal Society of Chemistry, Cambridge, 2007, pp. 417–426 Search PubMed.
- B. J. Murray and A. K. Bertram, Geophys. Res. Lett., 2007, 34, L16810, DOI:10.1029/2007GL030471.
- T. L. Malkin, B. J. Murray, A. V. Brukhno, J. Anwar and C. G. Salzmann, Proc. Natl. Acad. Sci. U. S. A., 2012, 109, 1041–1045 CrossRef CAS PubMed.
- B. J. Murray and A. K. Bertram, Phys. Chem. Chem. Phys., 2008, 10, 3287–3301, 10.1039/B802216J.
- J. Huang and L. S. Bartell, J. Chem. Phys., 1995, 99, 3924–3931 CrossRef CAS.
- L. S. Bartell and P. J. Lennon, J. Chem. Phys., 2009, 130, 084303 CrossRef PubMed.
- G. Torchet, P. Schwartz, J. Farges, M. F. Deferaudy and B. Raoult, J. Chem. Phys., 1983, 79, 6196–6202 CrossRef CAS PubMed.
- W. F. Kuhs, G. Genov, D. K. Staykova and T. Hansen, Phys. Chem. Chem. Phys., 2004, 6, 4917–4920 RSC.
- P. V. Hobbs, Ice Physics, Clarendon Press, Oxford, 1974 Search PubMed.
- V. F. Petrenko and R. W. Whitworth, Physics of Ice, Oxford University Press, Oxford, 1999 Search PubMed.
- A. Elarby-Aouizerat, J. F. Jal, J. Dupuy, P. Chieux, A. Wright and R. Parreins, J. Phys., 1982, 43, 205–208 Search PubMed.
- E. B. Moore and V. Molinero, Phys. Chem. Chem. Phys., 2011, 13, 20008–20016 RSC.
- E. B. Moore, E. de la Llave, K. Welke, D. A. Scherlis and V. Molinero, Phys. Chem. Chem. Phys., 2010, 12, 4124–4134 RSC.
- E. B. Moore and V. Molinero, J. Chem. Phys., 2010, 132, 244504–244510 CrossRef PubMed.
- E. González Solveyra, E. de la Llave, D. A. Scherlis and V. Molinero, J. Phys. Chem. B, 2011, 115, 14196–14204 CrossRef PubMed.
- T. Li, D. Donadio, G. Russo and G. Galli, Phys. Chem. Chem. Phys., 2011, 13, 19807–19813 RSC.
- J. C. Johnston and V. Molinero, J. Am. Chem. Soc., 2012, 134, 6650–6659 CrossRef CAS PubMed.
- A. Reinhardt and J. P. K. Doye, J. Chem. Phys., 2012, 136, 054501, DOI:10.1063/1.3677192.
- A. Reinhardt, J. P. K. Doye, E. G. Noya and C. Vega, J. Chem. Phys., 2012, 137, 194504 CrossRef PubMed.
- G. Bullock and V. Molinero, Faraday Discuss., 2013, 167, 371–388 RSC.
- L. Lupi, A. Hudait and V. Molinero, J. Am. Chem. Soc., 2014, 136, 3156–3164 CrossRef CAS PubMed.
- A. Hudait and V. Molinero, J. Am. Chem. Soc., 2014, 136, 8081–8093 CrossRef CAS PubMed.
- A. V. Brukhno, J. Anwar, R. Davidchack and R. Handel, J. Phys.: Condens. Matter, 2008, 20, 494243 CrossRef.
- M. A. Carignano, J. Phys. Chem. C, 2007, 111, 501–504 CAS.
- E. B. Moore and V. Molinero, Nature, 2011, 479, 506–508 CrossRef CAS PubMed.
- P. Pirzadeh and P. G. Kusalik, J. Am. Chem. Soc., 2011, 133, 704–707 CrossRef CAS PubMed.
- E. Pluhařová, L. Vrbka and P. Jungwirth, J. Phys. Chem. C, 2010, 114, 7831–7838 Search PubMed.
- D. Rozmanov and P. G. Kusalik, J. Chem. Phys., 2012, 137, 094702 CrossRef PubMed.
- M. Seo, E. Jang, K. Kim, S. Choi and J. S. Kim, J. Chem. Phys., 2012, 137, 154503 CrossRef PubMed.
- S. Choi, E. Jang and J. S. Kim, J. Chem. Phys., 2014, 140, 014701 CrossRef PubMed.
- S. J. Cox, Z. Raza, S. M. Kathmann, B. Slater and A. Michaelides, Faraday Discuss., 2013, 167, 389–403 RSC.
- J. D. Atkinson, B. J. Murray, M. T. Woodhouse, T. F. Whale, K. J. Baustian, K. S. Carslaw, S. Dobbie, D. O'Sullivan and T. L. Malkin, Nature, 2013, 498, 355–358 CrossRef CAS PubMed.
- B. J. Murray, S. L. Broadley, T. W. Wilson, J. D. Atkinson and R. H. Wills, Atmos. Chem. Phys., 2011, 11, 4191–4207 CrossRef CAS.
- S. L. Broadley, B. J. Murray, R. J. Herbert, J. D. Atkinson, S. Dobbie, T. L. Malkin, E. Condliffe and L. Neve, Atmos. Chem. Phys., 2012, 12, 287–307 CrossRef CAS.
- B. J. Murray, D. O'Sullivan, J. D. Atkinson and M. E. Webb, Chem. Soc. Rev., 2012, 41, 6519–6554 RSC.
- D. O'Sullivan, B. J. Murray, T. L. Malkin, T. F. Whale, N. S. Umo, J. D. Atkinson, H. C. Price, K. J. Baustian, J. Browse and M. E. Webb, Atmos. Chem. Phys., 2014, 14, 1853–1867 CrossRef.
- J. Benet, L. G. Macdowell and E. Sanz, J. Chem. Phys., 2014, 141, 034701 CrossRef PubMed.
- D. Quigley, J. Chem. Phys., 2014, 141, 121101 CrossRef CAS PubMed.
- J. Benet, L. G. Macdowell and E. Sanz, Phys. Chem. Chem. Phys., 2014, 16, 22159–22166, 10.1039/c4cp03398a.
- W. L. Jorgensen, J. Chandrasekhar, J. D. Madura, R. W. Impey and M. L. Klein, J. Chem. Phys., 1983, 79, 926 CrossRef CAS PubMed.
- H. W. Horn, W. C. Swope, J. W. Pitera, J. D. Madura, T. J. Dick, G. L. Hura and T. Head-Gordon, J. Chem. Phys., 2004, 120, 9665–9678 CrossRef CAS PubMed.
- J. L. F. Abascal and C. Vega, J. Chem. Phys., 2005, 123, 234505 CrossRef CAS PubMed.
- J. L. F. Abascal, E. Sanz, R. García Fernández and C. Vega, J. Chem. Phys., 2005, 122, 234511 CrossRef CAS PubMed.
- C. Vega, E. Sanz and J. L. F. Abascal, J. Chem. Phys., 2005, 122, 114507 CrossRef CAS PubMed.
- V. Molinero and E. B. Moore, J. Phys. Chem. B, 2009, 113, 4008–4016 CrossRef CAS PubMed.
- E. B. Moore and V. Molinero, J. Chem. Phys., 2010, 132, 244504–244510 CrossRef PubMed.
- E. B. Moore and V. Molinero, Phys. Chem. Chem. Phys., 2011, 13, 20008–20016 RSC.
- E. a. González Solveyra, E. de la Llave, D. A. Scherlis and V. Molinero, J. Phys. Chem. B, 2011, 115, 14196–14204 CrossRef PubMed.
- J. C. Johnston and V. Molinero, J. Am. Chem. Soc., 2012, 134, 6650–6659 CrossRef CAS PubMed.
- D. T. Limmer and D. Chandler, J. Chem. Phys., 2012, 137, 044509 CrossRef PubMed.
- G. Bullock and V. Molinero, Faraday Discuss., 2013, 167, 371–388 RSC.
- L. Lupi, A. Hudait and V. Molinero, J. Am. Chem. Soc., 2014, 136, 3156–3164 CrossRef CAS PubMed.
- L. Lupi, N. Kastelowitz and V. Molinero, J. Chem. Phys., 2014, 141, 18C508 CrossRef PubMed.
- L. Lupi and V. Molinero, J. Phys. Chem. A, 2014, 118, 7330–7337 CrossRef CAS PubMed.
- J. Russo, F. Romano and H. Tanaka, Nat. Mater., 2014, 13, 733–739 CrossRef CAS PubMed.
- M. Matsumoto, S. Saito and I. Ohmine, Nature, 2002, 416, 409–413 CrossRef CAS PubMed.
- G. Torrie and J. Valleau, J. Comput. Phys., 1977, 23, 187–199 CrossRef.
- R. Radhakrishnan and B. L. Trout, J. Chem. Phys., 2002, 117, 1786 CrossRef CAS PubMed.
- B. Ensing, M. De Vivo, Z. Liu, P. Moore and M. L. Klein, Acc. Chem. Res., 2006, 39, 73–81 CrossRef CAS PubMed.
- A. Laio and F. L. Gervasio, Rep. Prog. Phys., 2008, 71, 126601 CrossRef.
- A. Barducci, G. Bussi and M. Parrinello, Phys. Rev. Lett., 2008, 100, 020603, DOI:10.1103/PhysRevLett.100.020603.
- R. J. Allen, D. Frenkel and P. R. Ten Wolde, J. Chem. Phys., 2006, 124, 194111 CrossRef PubMed.
- C. Valeriani, R. J. Allen, M. J. Morelli, D. Frenkel and P. R. Ten Wolde, J. Chem. Phys., 2007, 127, 114109 CrossRef PubMed.
- R. J. Allen, C. Valeriani and P. Rein Ten Wolde, J. Phys.: Condens. Matter, 2009, 21, 463102, DOI:10.1088/0953-8984/21/46/463102.
- F. A. Escobedo, E. E. Borrero and J. C. Araque, J. Phys.: Condens. Matter, 2009, 21, 333101 CrossRef PubMed.
- R. Radhakrishnan and B. L. Trout, Phys. Rev. Lett., 2003, 90, 158301 CrossRef.
- R. Radhakrishnan and B. L. Trout, J. Am. Chem. Soc., 2003, 125, 7743–7747 CrossRef CAS PubMed.
- D. Quigley and P. Rodger, J. Chem. Phys., 2008, 128, 154518 CrossRef CAS PubMed.
- T. Li, D. Donadio, G. Russo and G. Galli, Phys. Chem. Chem. Phys., 2011, 13, 19807–19813 RSC.
- T. Li, D. Donadio and G. Galli, Nat. Commun., 2013, 4, 1887 CrossRef PubMed.
- A. Reinhardt and J. P. K. Doye, J. Chem. Phys., 2012, 136, 054501, DOI:10.1063/1.3677192.
- A. Reinhardt, J. P. K. Doye, E. G. Noya and C. Vega, J. Chem. Phys., 2012, 137, 194504 CrossRef PubMed.
- A. Reinhardt and J. P. K. Doye, J. Chem. Phys., 2014, 141, 084501 CrossRef PubMed.
- A. Reinhardt and J. P. K. Doye, J. Chem. Phys., 2013, 139, 096102 CrossRef PubMed.
- T. L. Malkin, B. J. Murray, A. V. Brukhno, J. Anwar and C. G. Salzmann, Proc. Natl. Acad. Sci. U. S. A., 2012, 109, 1041–1045 CrossRef CAS PubMed.
- A. Haji-Akbari, R. S. DeFever, S. Sarupria and P. G. Debenedetti, Phys. Chem. Chem. Phys., 2014 10.1039/C4CP03948C.
- P. J. Steinhardt, D. R. Nelson and M. Ronchetti, Phys. Rev. B: Condens. Matter Mater. Phys., 1983, 28, 784–805 CrossRef CAS.
- P. Rein ten Wolde, M. J. Ruiz-Montero and D. Frenkel, J. Chem. Phys., 1996, 104, 9932 CrossRef PubMed.
- E. Sanz, C. Vega, J. R. Espinosa, R. Caballero-Bernal, J. L. F. Abascal and C. Valeriani, J. Am. Chem. Soc., 2013, 135, 15008–15017 CrossRef CAS PubMed.
- V. Molinero and E. B. Moore, J. Phys. Chem. B, 2009, 113, 4008–4016 CrossRef CAS PubMed.
- E. B. Moore and V. Molinero, J. Chem. Phys., 2009, 130, 244505–244512 CrossRef PubMed.
- Y. P. Handa, D. D. Klug and E. Whalley, J. Chem. Phys., 1986, 84, 7009–7010 CrossRef CAS PubMed.
- O. Yamamuro, M. Oguni, T. Matsuo and H. Suga, J. Phys. Chem. Solids, 1987, 48, 935–942 CrossRef CAS.
- H. Tanaka, J. Chem. Phys., 1998, 108, 4887–4893 CrossRef CAS PubMed.
- R. A. Nistor, T. E. Markland and B. J. Berne, J. Phys. Chem. B, 2014, 118, 752–760 CrossRef CAS PubMed.
- H. Nada and Y. Furukawa, J. Cryst. Growth, 2005, 283, 242–256 CrossRef CAS PubMed.
- L. Yu, J. Am. Chem. Soc., 2003, 125, 6380–6381 CrossRef CAS PubMed.
- S. Chen, H. Xi and L. Yu, J. Am. Chem. Soc., 2005, 127, 17439–17444 CrossRef CAS PubMed.
- L. Yu, CrystEngComm, 2007, 9, 847 RSC.
- A. H. Nguyen and V. Molinero, J. Chem. Phys., 2014, 140, 084506 CrossRef PubMed.
- A. H. Nguyen, L. C. Jacobson and V. Molinero, J. Phys. Chem. C, 2012, 116, 19828–19838 CAS.
- L. Lupi and V. Molinero, J. Phys. Chem. A, 2014, 118, 7330–7337, DOI:10.1021/jp4118375.
- B. J. Murray, Atmos. Chem. Phys., 2008, 8, 5423–5433 CrossRef CAS.
- B. J. Murray, S. L. Broadley, T. W. Wilson, S. J. Bull, R. H. Wills, H. K. Christenson and E. J. Murray, Phys. Chem. Chem. Phys., 2010, 12, 10380–10387 RSC.
- D. Kashchiev, Nucleation: Basic Theory with Applications, Butterworth-Heinemann, 2000 Search PubMed.
- A. Manka, H. Pathak, S. Tanimura, J. Wolk, R. Strey and B. E. Wyslouzil, Phys. Chem. Chem. Phys., 2012, 14, 4505–4516 RSC.
- T. Nemec, Chem. Phys. Lett., 2013, 583, 64–68 CrossRef CAS PubMed.
- M. M. J. Treacy, J. M. Newsam and M. W. Deem, Proc. R. Soc. London, Ser. A, 1991, 433, 499–520 CrossRef.
- C. G. Salzmann, http://www.ucl.ac.uk/chemistry/research/group_pages/salzmann_group.
- T. Bartels-Rausch, V. Bergeron, J. H. E. Cartwright, R. Escribano, J. L. Finney, H. Grothe, P. J. Gutirrez, J. Haapala, W. F. Kuhs, J. B. C. Pettersson, S. D. Price, C. I. Sainz-Daaz, D. J. Stokes, G. Strazzulla, E. S. Thomson, H. Trinks and N. Uras-Aytemiz, Rev. Mod. Phys., 2012, 84, 885–944 CrossRef CAS.
- Y. Paul Handa, D. D. Klug and E. Whalley, Can. J. Chem., 1988, 66, 925–937 CrossRef.
- J. Hallet, W. P. Arnott, M. P. Bailey and J. T. Hallet, in Cirrus, ed. D. K. Lynch, K. Sassen, D. O. Starr and G. Stephens, Oxford University Press, New York, 2002, pp. 41–77 Search PubMed.
- B. J. Murray, C. G. Salzmann, S. Dobbie, A. J. Heymsfield and R. R. Neely III, Bull. Am. Meteorol. Soc. DOI:10.1175/BAMS-D-13-00128.1.
- P. K. Wang, Physics and Dynamics of Clouds and Precipitation, Cambridge University Press, Cambridge, 2013 Search PubMed.
- R. Wagner, O. Mohler, H. Saathoff, M. Schnaiter, J. Skrotzki, T. Leisner, T. W. Wilson, T. L. Malkin and B. J. Murray, Atmos. Chem. Phys., 2012, 12, 8589–8610 CrossRef CAS.
- T. W. Wilson, B. J. Murray, R. Wagner, O. Mohler, H. Saathoff, M. Schnaiter, J. Skrotzki, H. C. Price, T. L. Malkin, S. Dobbie and S. Al-Jumur, Atmos. Chem. Phys., 2012, 12, 8611–8632 CrossRef CAS.
- T. H. G. Carr, J. J. Shephard and C. G. Salzmann, J. Phys. Chem. Lett., 2014, 5, 2469–2473, DOI:10.1021/jz500996p.
- M. Sugisaki, H. Suga and S. Seki, Bull. Chem. Soc. Jpn., 1968, 41, 2591–2599 CrossRef CAS.
- G. P. Johari, Philos. Mag. B, 1998, 78, 375–383 CrossRef CAS.
- J. A. Ghormley, J. Chem. Phys., 1968, 48, 503 CrossRef CAS PubMed.
- B. J. Murray, T. L. Malkin and C. G. Salzmann, J. Atmos. Sol.-Terr. Phys., 2014 Search PubMed , accepted.
- A. J. Heymsfield, J. Atmos. Sci., 1986, 43, 851–855 CrossRef.
- E. Whalley, Science, 1981, 211, 389–390 CAS.
- M. Riikonen, M. Sillanpää, L. Virta, D. Sullivan, J. Moilanen and I. Luukkonen, Appl. Opt., 2000, 39, 6080–6085 CrossRef CAS.
- T. Takahashi, J. Cryst. Growth, 1982, 59, 441–449 CrossRef CAS.
- J. Goodman, O. B. Toon, R. F. Pueschel, K. G. Snetsinger and S. Verma, J. Geophys. Res.: Atmos., 1989, 94, 16449–16457 CrossRef.
- L. F. Keyser and M. T. Leu, Microsc. Res. Tech., 1993, 25, 434–438 CrossRef CAS PubMed.
- J. E. Bertie and M. Jacobs, J. Chem. Phys., 1977, 67, 2445–2448 CrossRef CAS PubMed.
| This journal is © the Owner Societies 2015 |

