The photoformation of a phthalide: a ketene intermediate traced by FSRS†
Sascha
Fröbel
a,
Laura
Buschhaus
a,
Torben
Villnow
a,
Oliver
Weingart
b and
Peter
Gilch
*a
aHeinrich Heine Universität, Institut für Physikalische Chemie, Universitätsstraße 1, 40225 Düsseldorf, Germany. E-mail: gilch@hhu.de; Fax: +49 211 8112803; Tel: +49 211 8115400
bHeinrich Heine Universität, Institut für Theoretische Chemie und Computerchemie, Universitätsstraße 1, 40225 Düsseldorf, Germany
First published on 12th November 2014
Abstract
The photo-isomerization of o-acetylbenzaldehyde (oABA) in acetonitrile was studied by femto- and nanosecond transient absorption spectroscopy. Spectroscopic signatures are assigned with the aid of TD-DFT, TD-CAM-DFT and DFT-MRCI computations. The isomerization yields a lactone, 3-methylphthalide (3MP), with a quantum yield of 0.3 (30%). As evidenced by femtosecond stimulated Raman spectroscopy (FSRS), the isomerization proceeds via a ketene intermediate. It is formed within ∼2–3 ps after photo-excitation. Intersystem crossing (ISC) populating the triplet state of oABA seems to compete with the ketene formation. Experiments on the non-reactive meta- and para-derivatives, which undergo efficient ISC with time constants of 5 ps, support this statement. The triplet state of oABA also contributes to the ketene formation, presumably involving a biradical intermediate. The ketene exhibits a lifetime of 1.4 μs and generates an additional intermediate in the cascade towards the lactone.
1 Introduction
Intramolecular hydrogen transfers in the excited state are crucial elementary processes in photochemistry and photobiology.1 The transfer may occur in an adiabatic way yielding electronically excited transfer products.2 After radiative or non-radiative decay the transfer usually is reversed and the starting material is rapidly (<10 ns) recovered.3,4 In a non-adiabatic process, transfer and non-radiative decay are coupled; the transfer product is formed in the electronic ground state. Often, these products are more stable with respect to the reverse transfer than those formed adiabatically. As a consequence secondary processes yielding stable products are more likely.Blancafort et al.5,6 invoked symmetry arguments and correlation diagrams to explain why for a certain molecule the transfer is reversible or not. In the irreversible case the hydrogen transfer is accompanied by the relocation of two electrons from an n- to a π-orbital. This renders the reverse transfer orbital-forbidden and therefore slow. For reversible transfers the character of the orbitals involved does not alter which enables a fast reverse transfer. The model was first developed for the photochemistry of ortho-nitrobenzaldehyde (oNBA), a compound on which we conducted a series of femtosecond spectroscopy measurements.7–11 In oNBA, photoexcitation triggers the transfer of a hydrogen atom from the aldehyde substituent to the nitro group. The transfer occurs within a few 100 fs and results in the formation of a ketene intermediate12 in its electronic ground state. In line with that, high level quantum chemistry computations find a barrier-less path from the Franck–Condon region of photo-excited oNBA to the ketene intermediate.5,13 The computed barrier for the reverse transfer amounts to 0.8 eV.5 This explains the experimental finding7,14 that the ketene intermediate transforms quantitatively into a stable photoproduct, ortho-nitrosobenzoic acid.
To widen the scope of their model Blancafort et al.6 addressed a related molecule, ortho-phthalaldehyde (oPA, Scheme 1). This molecule is known to be photo-reactive, forming among other products a phthalide.15 As the initial process of this reaction, the computations predict a non-adiabatic hydrogen transfer resulting in a ketene.6 A ketene intermediate was indeed observed via IR spectroscopy in a matrix isolation experiment.16 However, this experiment gave neither information on the time scale of the formation nor on its yield. Time resolved spectroscopy on oPA and related compounds15,17,18 lacked the temporal resolution to trace the ketene formation.
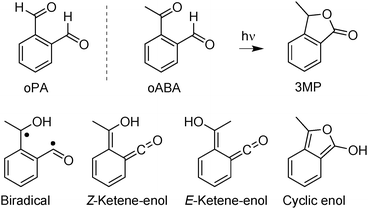 | ||
| Scheme 1 Structures of oPA, oABA, 3MP and of diverse intermediates, which have been discussed in the photochemistry of oABA and analogous compounds. | ||
Here, we will present a comprehensive femto- and nanosecond spectroscopy study on ortho-acetylbenzaldehyde (oABA, Scheme 1). We have opted for oABA instead of oPA since for the latter at least two rotamers (denoted as EZ and EE) coexist.15 These rotamers are expected to differ in their photo-reactivity which renders the observed kinetics heterogeneous.15 For sterical reasons, in oABA the rotamer depicted in Scheme 1 is expected to predominate. As oPA, oABA is known to photo-transform into a phthalide (3-methylphthalide, 3MP, Scheme 1).18
The computations by Blancafort et al. on oPA did not take intersystem crossing (ISC) to triplet states into account. Most aromatic carbonyl compounds, however, undergo efficient ISC.2,19 So to set signatures of ISC apart from the ones of hydrogen transfer, results on the meta- and para-isomers (mABA and pABA) are included. Both exhibit a much lower photochemical reactivity (see below).
In the remainder of this paper, the phototransformation of oABA to a phthalide will first be characterized by steady state illumination. Femto- and nanosecond transient absorption will reveal the characteristic times for the processes occurring in mABA, pABA and oABA. By means of femtosecond stimulated Raman spectroscopy (FSRS)20 evidence for the ketene formation will be given. Spectral assignments will receive support from quantum chemistry. The results will finally be discussed in the light of earlier findings on oNBA and the computations on oPA.
2 Experimental and theoretical methods
2.1 Steady state illumination
The steady state illumination was performed in 1 cm fused silica cells (Hellma). For excitation at 266 nm, the frequency doubled output of a pulsed Nd:YAG laser (Continuum NY60, pulse duration 10 ns (FWHM), repetition rate 50 Hz), which was converted to 266 nm via an additional β-barium borate (BBO) crystal, was used. Residual fundamental and second harmonic light was removed by two dichroic mirrors. For all other excitation wavelengths, the xenon lamp and excitation monochromator of a Fluorolog 3 spectrometer (Horiba) were employed.2.2 Femtosecond spectroscopy
The experimental set-ups for the FSRS and transient absorption (TA) experiments in the femto- to nanosecond range were described before.8,21 Here, only deviations from these descriptions and the relevant experimental parameters are summarized. For all measurements the frequency tripled output (266 nm) of a 1 kHz femtosecond laser/amplifier system (Coherent Libra) served as actinic pump. Pump-induced spectroscopic changes were probed by a single-filament white light continuum generated in CaF2. Its diameter amounted to 25 μm at the sample position. The time resolution of both techniques was about 200 fs. In all measurements, the relative orientation of the polarization vectors of actinic pump and probe light was at magic angle.FSRS data processing was performed as follows. After subtraction of the dark background bgr, the change in stimulated Raman signal upon photoexcitation S(![[small nu, Greek, tilde]](https://www.rsc.org/images/entities/i_char_e0e1.gif) ,t,s) as a function of wavenumber
,t,s) as a function of wavenumber ![[small nu, Greek, tilde]](https://www.rsc.org/images/entities/i_char_e0e1.gif) was calculated for each delay setting t and scan s according to
was calculated for each delay setting t and scan s according to
 | (1) |
![[small nu, Greek, tilde]](https://www.rsc.org/images/entities/i_char_e0e1.gif) ,t,s) is the measured spectrum when all three pulses reach the sample and Iwl+exc(
,t,s) is the measured spectrum when all three pulses reach the sample and Iwl+exc(![[small nu, Greek, tilde]](https://www.rsc.org/images/entities/i_char_e0e1.gif) ,t,s) when the Raman pump pulse is blocked. To correct for baseline fluctuations, S(
,t,s) when the Raman pump pulse is blocked. To correct for baseline fluctuations, S(![[small nu, Greek, tilde]](https://www.rsc.org/images/entities/i_char_e0e1.gif) ,t,s) was first processed with a Savitzky–Golay filter25 (4th order polynom, 2 points left/right) to yield SSav(
,t,s) was first processed with a Savitzky–Golay filter25 (4th order polynom, 2 points left/right) to yield SSav(![[small nu, Greek, tilde]](https://www.rsc.org/images/entities/i_char_e0e1.gif) ,t,s). Then the baseline was fitted with a spline function SF(
,t,s). Then the baseline was fitted with a spline function SF(![[small nu, Greek, tilde]](https://www.rsc.org/images/entities/i_char_e0e1.gif) ,t,s). This spline function was subtracted from the data to give the baseline corrected spectra Scorr(
,t,s). This spline function was subtracted from the data to give the baseline corrected spectra Scorr(![[small nu, Greek, tilde]](https://www.rsc.org/images/entities/i_char_e0e1.gif) ,t,s)
,t,s)Scorr(![[small nu, Greek, tilde]](https://www.rsc.org/images/entities/i_char_e0e1.gif) ,t,s) = SSav( ,t,s) = SSav(![[small nu, Greek, tilde]](https://www.rsc.org/images/entities/i_char_e0e1.gif) ,t,s) − SF( ,t,s) − SF(![[small nu, Greek, tilde]](https://www.rsc.org/images/entities/i_char_e0e1.gif) ,t,s). ,t,s). | (2) |
Since the absorption of the Raman pump pulse from excited state molecules does not only lead to baseline fluctuations, but also to an apparent decrease in Raman intensity, a correction factor C(![[small nu, Greek, tilde]](https://www.rsc.org/images/entities/i_char_e0e1.gif) ref,t,s) for this decrease is required. We compute this correction factor by relying on a solvent peak at
ref,t,s) for this decrease is required. We compute this correction factor by relying on a solvent peak at ![[small nu, Greek, tilde]](https://www.rsc.org/images/entities/i_char_e0e1.gif) ref, which is assumed to have an intensity independent of the photoexcitation of the solute.21C(
ref, which is assumed to have an intensity independent of the photoexcitation of the solute.21C(![[small nu, Greek, tilde]](https://www.rsc.org/images/entities/i_char_e0e1.gif) ref,t,s) is the ratio of this peak's background corrected intensity with (delay settings t) and without (negative delay setting tneg = −4 ps) photoexcitation of the solute
ref,t,s) is the ratio of this peak's background corrected intensity with (delay settings t) and without (negative delay setting tneg = −4 ps) photoexcitation of the solute
 | (3) |
The final transient Raman spectra R(![[small nu, Greek, tilde]](https://www.rsc.org/images/entities/i_char_e0e1.gif) ,t) were then obtained by computing
,t) were then obtained by computing
R(![[small nu, Greek, tilde]](https://www.rsc.org/images/entities/i_char_e0e1.gif) ,t,s) = Scorr( ,t,s) = Scorr(![[small nu, Greek, tilde]](https://www.rsc.org/images/entities/i_char_e0e1.gif) ,t,s)·C( ,t,s)·C(![[small nu, Greek, tilde]](https://www.rsc.org/images/entities/i_char_e0e1.gif) ref,t,s) − Scorr( ref,t,s) − Scorr(![[small nu, Greek, tilde]](https://www.rsc.org/images/entities/i_char_e0e1.gif) ,tneg,s) ,tneg,s) | (4) |
![[small nu, Greek, tilde]](https://www.rsc.org/images/entities/i_char_e0e1.gif) ,tneg,s) equals the ground state FSRS spectrum of the sample for each scan.
,tneg,s) equals the ground state FSRS spectrum of the sample for each scan.
2.3 Nanosecond transient absorption
The nanosecond transient absorption setup (Applied Photophysics, LSK 6.0) utilizes the output of a frequency quadrupled (266 nm) pulsed Nd:YAG laser (Innolas, Spitlight 600) for photoexcitation.26 The sample was excited with 38 mJ pump energy at 12 ns laser pulse duration and 1 Hz repetition rate. The pump beam of 0.8 cm diameter was directed into the sample (a standard 3.5 ml cuvette, pathlength 1 cm) at right angle to the probe beam. The sample was purged with nitrogen to remove dissolved oxygen. For quenching experiments the sample was purged with pure oxygen. For sensitive measurements of absorbance changes we used a high-intensity pulsed xenon lamp (150 W, 1.5 ms, Osram) as probe source. The pulsed output of the lamp remains flat in terms of intensity for ∼400 μs. This temporal window was relied on in the experiments. Behind the sample the probe light was dispersed by a grating monochromator for wavelength selection. The output signal was detected by a photomultiplier (1P28, 250–600 nm), digitized by an oscilloscope (Agilent Infinium) and transferred to a workstation (Iyonix). Typically 10 laser pulses were averaged to record a kinetic trace at a selected wavelength.2.4 Quantum chemical computations
Quantum chemical computations were performed using Gaussian0927 and Turbomole.28 Optimized ground state geometries and vibrational modes in acetonitrile were obtained using Gaussian DFT B3LYP, the TZVP basis set and the PCM reaction field method.29 The calculated frequencies were scaled by a factor of 0.965. Excited state absorptions and oscillator strengths were calculated for the first ten excited states with TD-B3LYP and TD-CAM-B3LYP using Gaussian. DFT-MRCI30,31 values were computed in Turbomole using COSMO32 for solvation effects.Gaussian09 computes Raman activities Scomp(![[small nu, Greek, tilde]](https://www.rsc.org/images/entities/i_char_e0e1.gif) ) for linearly polarized incident light and 90° unpolarized detection.33 Different conditions apply for the FSRS experiments here. While the incident light still has linear polarization, the detection is performed at 180°. Also, due to the stimulated Raman effect, the detection “selects” light scattered with parallel polarization relative to the incident light (Raman pump and Raman probe polarizations are parallel, see above). So, to obtain intensity values which are directly comparable to the relative intensities in R(
) for linearly polarized incident light and 90° unpolarized detection.33 Different conditions apply for the FSRS experiments here. While the incident light still has linear polarization, the detection is performed at 180°. Also, due to the stimulated Raman effect, the detection “selects” light scattered with parallel polarization relative to the incident light (Raman pump and Raman probe polarizations are parallel, see above). So, to obtain intensity values which are directly comparable to the relative intensities in R(![[small nu, Greek, tilde]](https://www.rsc.org/images/entities/i_char_e0e1.gif) ,t) (eqn (4)), two corrections have to be applied to Scomp(
,t) (eqn (4)), two corrections have to be applied to Scomp(![[small nu, Greek, tilde]](https://www.rsc.org/images/entities/i_char_e0e1.gif) ). First, the depolarization ratio ρ (“Depolar (P)” in the Gaussian output) has to be considered (eqn (5)).34 Second, the calculated activities have to be corrected for the intrinsic frequency dependency in stimulated Raman spectroscopy.35 Therefore, Scomp(
). First, the depolarization ratio ρ (“Depolar (P)” in the Gaussian output) has to be considered (eqn (5)).34 Second, the calculated activities have to be corrected for the intrinsic frequency dependency in stimulated Raman spectroscopy.35 Therefore, Scomp(![[small nu, Greek, tilde]](https://www.rsc.org/images/entities/i_char_e0e1.gif) ) has to be multiplied by the absolute wavenumbers
) has to be multiplied by the absolute wavenumbers ![[small nu, Greek, tilde]](https://www.rsc.org/images/entities/i_char_e0e1.gif) S,abs of the Stokes shifted bands.36 The incident light wavenumber
S,abs of the Stokes shifted bands.36 The incident light wavenumber ![[small nu, Greek, tilde]](https://www.rsc.org/images/entities/i_char_e0e1.gif) 0,abs was set to 25
0,abs was set to 25![[thin space (1/6-em)]](https://www.rsc.org/images/entities/char_2009.gif) 000 cm−1 (400 nm) since our experiment was performed under these conditions. Considering far-from-resonance conditions, application of both corrections yields Raman activities Scomp,corr(
000 cm−1 (400 nm) since our experiment was performed under these conditions. Considering far-from-resonance conditions, application of both corrections yields Raman activities Scomp,corr(![[small nu, Greek, tilde]](https://www.rsc.org/images/entities/i_char_e0e1.gif) ), which are directly comparable to our experimental signal heights:
), which are directly comparable to our experimental signal heights:
 | (5) |
Finally, the corrected stick spectra were convoluted with Lorentzian functions (FWHM = 15 cm−1).
2.5 Materials
o-Acetylbenzaldehyde (95%), m-acetylbenzaldehyde (95%), and p-acetylbenzaldehyde (97%) were supplied by Aldrich and used as received. trans-Stilbene (98%) was supplied by TCI Europe. Spectroscopic grade acetonitrile (>99%, water content <0.03%) from Acros Organics and acetonitrile-d3 (99.8% deuteration) from Euriso-Top were used as solvents.3 Results
3.1 Steady state illumination
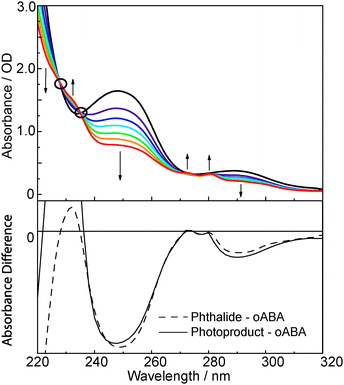
The UV/Vis absorption spectrum of oABA dissolved in acetonitrile (Fig. 1) exhibits clearly discernible bands at 288 nm (absorption coefficient ε = 1720 M−1 cm−1), 247 nm (7560 M−1 cm−1), and 215 nm (23![[thin space (1/6-em)]](https://www.rsc.org/images/entities/char_2009.gif) 200 M−1 cm−1) (for spectra of mABA and pABA see ESI,† Fig. S1). Closer inspection of the spectrum reveals an additional band at ∼350 nm with a small absorption coefficient of ∼200 M−1 cm−1. Illumination of the solution with 266 nm light mostly results in a reduction of the absorption except for spectral regions around 230 and 270 nm. Here small increases are seen. The spectral changes fit well with a photo-induced formation of 3MP. A difference spectrum derived from the illumination experiment matches the one computed from the spectra of oABA and phthalide. The parent compound phthalide was used as a “stand-in” for 3-methylphthalide which was not available.
200 M−1 cm−1) (for spectra of mABA and pABA see ESI,† Fig. S1). Closer inspection of the spectrum reveals an additional band at ∼350 nm with a small absorption coefficient of ∼200 M−1 cm−1. Illumination of the solution with 266 nm light mostly results in a reduction of the absorption except for spectral regions around 230 and 270 nm. Here small increases are seen. The spectral changes fit well with a photo-induced formation of 3MP. A difference spectrum derived from the illumination experiment matches the one computed from the spectra of oABA and phthalide. The parent compound phthalide was used as a “stand-in” for 3-methylphthalide which was not available.
An illumination experiment with FTIR detection (see ESI,† Fig. S2) and GC/MS spectra (data not shown) also support the formation of 3MP as the only product. In the IR experiment a strong band at 1765 cm−1 is seen to rise. This wavenumber is characteristic for the carbonyl stretching mode of the lactone motif37 in 3MP. The reaction quantum yield ϕr was determined relying on UV/Vis and FTIR spectroscopy. In either experiments the absorption at the illumination wavelength was high enough and the illumination time short enough that constant absorbed light flux may be assumed. Under these conditions the concentrations change linearly with illumination time and the slope of the respective plots is proportional to ϕr. In the UV/Vis experiment the reduction of the absorption at 291 nm served as a measure for the consumption of oABA. At 291 nm the absorption of 3MP is negligible. In the IR experiment the consumption was monitored at 1697 cm−1. Here, one carbonyl stretching mode of oABA is located. The UV/Vis experiment afforded a yield ϕr of 0.31 (31%) for an illumination wavelength of 288 nm. For IR detection and a slightly different illumination wavelength of 266 nm a value of 0.30 was determined. Since the formation of a lactone is impossible in mABA and pABA, the quantum yields for their consumption are by a factor of ∼50 smaller than the one for oABA. No attempts were made to clarify the nature of mABA and pABA photoproducts. Recording fluorescence properties of oABA failed since during the acquisition the fluorescence increased in intensity. Obviously, in the fluorimeter the photo-reaction occurs and the 3MP formed exhibits a much higher fluorescence quantum yield than the starting material.
3.2 Transient absorption spectroscopy
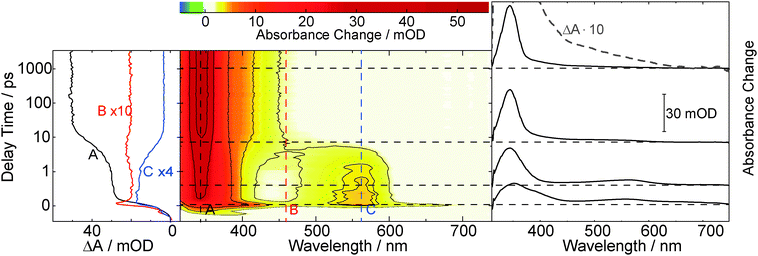
The initial ultrafast decay occurs with a time constant below our instrumental response function (<200 fs) and is attributed to internal conversion from the initially excited to the lowest excited singlet state. Monoexponential fits of the time traces around 345 and 580 nm (traces A and C in Fig. 2) yield identical time constants of 5 ps, describing the decay of the species featuring the 340 and 580 nm bands and population of the one featuring the 345 nm band. Around 450 nm the time traces are more complex. This is ascribed to vibrational cooling of the species formed within 5 ps. The lifetime of this species, as observed in a nanosecond experiment (cpABA = 0.14 mM), proves to be oxygen sensitive (see ESI,† Fig. S4). In a nitrogen purged solution the lifetime is ∼2 μs. In an oxygen saturated solution it is lower by an order of magnitude (∼0.2 μs). Analyses of the mABA data sets yield similar time constants (5 ps, ∼2 μs (N2) and ∼0.2 μs (O2), see ESI,† Fig. S3 and S5).
The time resolved data on mABA and pABA lend to the interpretation that the compounds undergo efficient ISC to the triplet state. For a closely related system—acetophenone dissolved in acetonitrile—a triplet absorption spectrum similar to the ones observed here was reported.38 The lifetimes of ∼2 μs recorded in the nanosecond experiments are in the range typical for organic carbonyls in solution.39 The “building blocks” of mABA and pABA, benzaldehyde and acetophenone, exhibit longer triplet lifetimes in acetonitrile of 17 μs and 130 μs, respectively.40 We stress, however, that the lifetime values of ∼2 μs do not need to be the “intrinsic” lifetimes of the states. Concentration quenching, i.e. an interaction between a triplet excited and a ground state molecule, and triplet–triplet annihilation cannot be excluded. The former effect comes into play for benzaldehyde and acetophenone dissolved in acetonitrile.40 The lifetime reduction by oxygen translates into a bi-molecular quenching constant kq,O2 of 5.0 × 10⁸ M−1 s−1 for pABA. Hereby, a published value for oxygen concentration in oxygen saturated acetonitrile (9.1 mM) was relied on.39 The quenching constant is clearly below the one for the diffusion limit (1.9 × 10¹⁰ M−1 s−1).39 The rate constant for quenching of the acetophenone triplet by oxygen is also below the diffusion limit.41 This observation was ascribed to spin statistics.41 All this is in favor of assigning the transients observed at delay times >10 ps to the lowest triplet states of mABA and pABA, which are both populated with a time constant of 5 ps.
Within the instrumental response time (200 fs) the difference absorption decreases in magnitude throughout the spectral region covered. On the time scale of picoseconds a decay in signal strength is observed, predominately around 380 nm. Within ∼10 ps a band around 400 nm is seen to narrow in spectral width. Further kinetic compounds on the time scale of 100 ps and 1 ns are discernible. On the nanosecond time scale signal increases as well as decreases are seen. The difference spectrum recorded for the largest delay time (3 ns) in the femtosecond experiment exhibits peaks at 520, 405, and ∼320 nm.
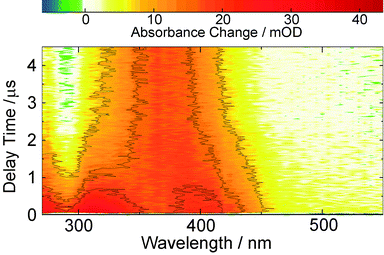
The same features are observed in the earliest difference spectra recorded with the nanosecond set-up (Fig. 4). After ∼1 μs these signatures decay giving way to another species with a spectrum peaking at 370 nm and a ground state bleach around 280 nm becomes discernible. This species does not fully decay within the time range covered (up to 400 μs), so that at the given noise level the time constant for its decay of about 100 μs is afflicted with a rather high uncertainty. This lifetime proves to be mildly oxygen dependent (lifetime quenched by ∼30% in presence of oxygen, see ESI,† Fig. S6).
The kinetic analysis of the oABA data set is more challenging than for the ones of mABA and pABA. The femto- and nanosecond data sets were analyzed using a global fitting routine.42 To model the femtosecond data set, trial functions with different numbers of exponential terms were tested. Visual inspection of the time traces (Fig. 3) reveals that at least four terms are involved. It turned out that five exponential terms and an offset are required to describe the data set. The corresponding decay associated spectra (DAS) and time constants are shown in Fig. 5. To cross-check the number of components, a singular value decomposition (SVD)42 was performed. To avoid the instrumental rise showing up in the SVD results, the procedure was restricted to the range 500 fs to 3 ns. In this range four dominant singular values were found. Considering that one time constant (τ1 = 0.02 ps, Fig. 5) of the global analysis is outside of this range, the SVD procedure justifies using five terms. The nanosecond data could be reproduced using two major kinetic components and an offset. The resulting time constants are 1.4 μs and 106 μs. We will postpone the assignment of time constants to the Discussion since the FSRS data covered now will greatly facilitate this assignment.
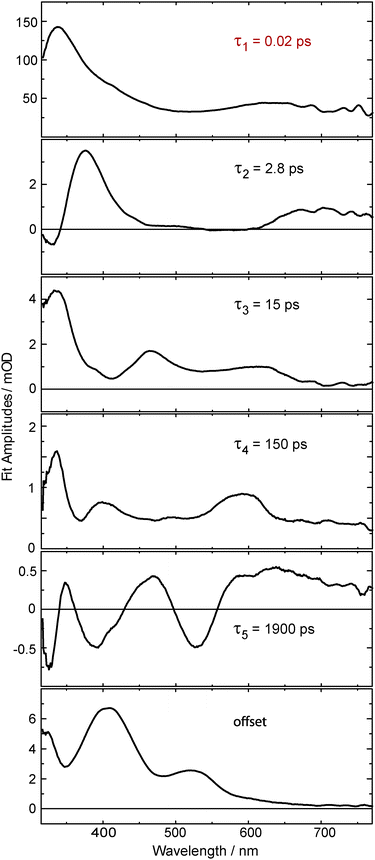 | ||
| Fig. 5 Decay associated spectra obtained from an analysis of the data on oABA plotted in Fig. 3. The first time constant τ1 lies below our instrument response function and is therefore afflicted with large uncertainty. | ||
3.3 Femtosecond stimulated Raman spectroscopy
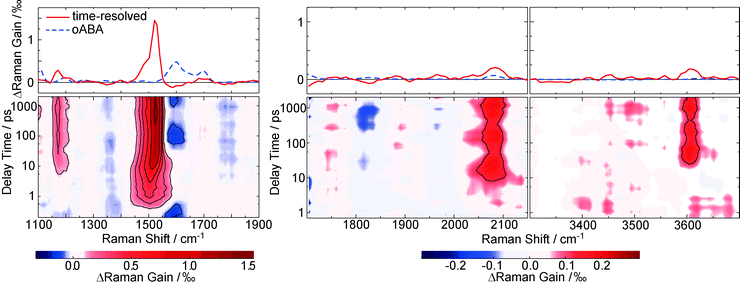
Raman resonances of the solvent impair measurements on the solute at the spectral position of these resonances. Deuteration shifts the solvent resonances and thereby opens additional spectral windows. So, to cover a broad range of Raman shifts in the FSRS experiment, oABA dissolved in acetonitrile and in deuterated acetonitrile was investigated. As in the experiments described above, the sample was excited with 266 nm laser pulses. The Raman probe pulse was centered at 400 nm and thereby in resonance with the transient species observed in the transient absorption experiment (cf.Fig. 3). The excitation results in increases of the Raman gain due to species populated by the excitation and decreases due to depletion of the starting material (Fig. 6). Due to resonance Raman enhancement positive signatures are often stronger in magnitude than the negative ones. Positive signatures are located at Raman shifts of 1170, 1525, 2080, and 3600 cm−1. The intense band at 1525 cm−1 is present from ∼1 ps onwards. The other bands are clearly discernible from 10–20 ps onwards. All bands do not change in strength or position thereafter. The band at 1525 cm−1 is by far the strongest. Thus, we assume that this apparent difference in rise time is caused solely by the fact that the weaker bands surmount the noise floor at later delay times. Early on the most intense band is centered at a lower wavenumber of 1500 cm−1 and features a larger bandwidth (40 cm−1 FWHM) than later on (22 cm−1). So within a few picoseconds the band shifts to larger wavenumbers and narrows, which is characteristic for vibrational cooling of a nascent species.43–45 To separate these spectral dynamics from a “genuine” rise, the band integral was computed and plotted as a function of delay time (Fig. 7, upper panel). The resulting time trace can be modeled with an exponential rise and a time constant of 2.2 ps. Plotting the peaks of the Raman band as obtained from Gaussian fits versus delay time reveals a slower response (Fig. 7, lower panel). From a single exponential fit a relaxation time of 11.2 ps is obtained for this shift.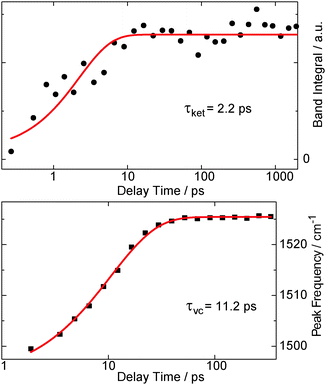 | ||
| Fig. 7 The rise behavior of the 1525 cm−1 resonance in the FSRS data on oABA in deuterated acetonitrile (see left panel in Fig. 6). The upper panel gives the spectral integral over the band (black bullets), plotted as a function of the delay time. In the lower panel, the peak frequency of the band (black squares) as obtained from Gaussian fits of the respective transient spectra is plotted versus delay time. Single exponential fits are represented by red lines and the resulting time constants τket for ketene formation and τvc for vibrational cooling are shown. | ||
The FSRS pattern and temporal behavior is very similar to the one observed for the ketene derived from oNBA.8 Quantum chemistry will give further support that indeed a ketene intermediate is also formed here.
3.4 Quantum chemical computations
To affirm the formation of a ketene intermediate upon photo excitation of oABA, the structures of oABA and potential intermediates (Scheme 1) were geometry optimized considering solvent effects (for coordinates see ESI,† Tables S1–S5). In the E-ketene-enol the methyl group must point towards the ketene group. Optimization of this compound yielded a structure with a distorted six-membered ring due to the sterical demand of both substituents. The Helmholtz free energy F of formation of this structure is much larger than the one of the Z-ketene-enol (FE − FZ = 16.7 kJ mol−1, T = 298 K, cf. ESI†). So, an E-ketene-enol intermediate is unlikely to be formed here.Based on the optimized structures, the respective Raman spectra in acetonitrile were computed (for computational details see Section 2.4). A comparison of the FSRS data with the calculated spectra confirms the formation of the Z-ketene-enol intermediate (Fig. 8). As expected from vibrational spectroscopy on other ketenes46 only this intermediate exhibits a band around 2050 cm−1. The resonance is caused by the stretching mode of the ketene motif. The most intense band in the experimental spectrum at 1525 cm−1, which is reproduced by the computation, is due to an in-phase stretching vibration of the butadiene scaffold in the ketene intermediate. Finally, the band at 3600 cm−1 seen in experiment and computation is caused by an OH-stretching mode and unequivocally shows that a hydrogen atom has been transferred. Some computed bands are not visible in the experiment. This can in most of the cases be explained by selective enhancement of some bands in resonance Raman spectroscopy.47 The experiment was conducted under resonance conditions whereas the computations were not. In particular, the totally symmetric A-term resonances according to Albrecht's notation48 become stronger compared to off-resonance scattering. This may explain the high intensity of the mode at 1525 cm−1, which represents a totally symmetric vibration regarding the butadiene scaffold. In other cases, rising bands are compensated by the bleach of ground state bands as in the case of the intense 1625 cm−1 resonance. Taking differences between experimental and computed spectra into account, it is evident that within a few picoseconds after excitation the Z-ketene-enol intermediate is formed.
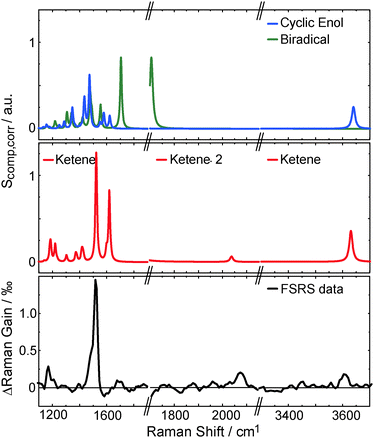 | ||
| Fig. 8 Comparison of experimental (lower panel, data as in top panel of Fig. 6) and computed Raman spectra Scomp,corr (top and central panel, see eqn (5)). The calculated Z-ketene-enol spectrum (red) is in best agreement with the experimental spectrum compared to the biradical (green) and the cyclic enol (blue) spectra. Note that the OH-stretching mode of the biradical is shifted below 3200 cm−1 (not shown). | ||
For the interpretation of the transient absorption spectra, transition energies and oscillator strengths of the intermediates were computed (Table 1). The FSRS experiment has shown that the 405 nm absorption band observed in the fs-UV/Vis data is caused by the ketene intermediate. In the computations we find that this band is the ketene S0 → S2 transition. Note that the computed position of this band varies depending on the method employed. This may be explained by the differing quality of the description of dispersion interactions between solvent and solute in the different methods. Nevertheless the calculations deliver the following trends:
| Structure | Method | State | Wavelength λ (oscillator strength f) |
|---|---|---|---|
| Z-Ketene-enol | DFT-MRCI | S1 | 576 nm (5 × 10⁻⁴) |
| S2 | 380 nm (0.146) | ||
| TD-CAM-DFT | S1 | 466 nm (0.000) | |
| S2 | 393 nm (0.160) | ||
| TD-DFT | S1 | 521 nm (0.000) | |
| S2 | 429 nm (0.119) | ||
| Cyclic enol | DFT-MRCI | S1 | 351 nm (0.129) |
| TD-CAM-DFT | S1 | 357 nm (0.135) | |
| TD-DFT | S1 | 388 nm (0.099) | |
| Biradical | TD-CAM-DFT | S1 | 578 nm (0.055) |
| S2 | 460 nm (0.001) | ||
| S3 | 366 nm (0.014) | ||
| S4 | 329 nm (0.019) | ||
| TD-DFT | S1 | 636 nm (0.040) | |
| S2 | 515 nm (7 × 10⁻⁴) | ||
| S3 | 369 nm (0.014) | ||
| S4 | 351 nm (0.030) |
• The Z-ketene-enol exhibits a weak S0 → S1 absorption at >460 nm and an intense band around 400 nm, as seen in our experiments. The oscillator strength of the latter is ∼0.15.
• The cyclic enol exhibits an S0 → S1 absorption with an intensity comparable to the S0 → S2 transition of the ketene. Its position is shifted to shorter wavelengths by roughly 30 nm with respect to the latter.
• The biradical exhibits multiple low intensity absorption bands in the spectral window of our experiments.
This knowledge assists in assigning molecular processes to the kinetic components in our transient absorption experiments (see Discussion). Furthermore, the computed oscillator strengths allow for estimates of intermediate concentrations and their quantum yields.
3.5 Quantum yield of the ketene formation
Based on the experimental and computational results an estimate of the quantum yield for ketene formation ϕr,k will be given. The measured difference absorption ΔA(ν) as a function of frequency ν after ketene formation is related to this yield via| ΔA(ν) = ϕr,kΔε(ν)c*d ≈ ϕr,kεk(ν)c*d | (6) |
 | (7) |
The determination of the yield further requires knowledge on the product c*d. It was evaluated by a comparison. To this end, a femtosecond transient absorption experiment on a reference molecule was performed under conditions identical to those for oABA. trans-Stilbene dissolved in acetonitrile was used for this purpose. It has been thoroughly characterized by femtosecond spectroscopy and forms cis-stilbene with a quantum yield of 0.5 within less than 50 ps after excitation.50 Since the extinction coefficients of both trans- and cis-stilbene in acetonitrile are known,51 one can compute the product c*d from the persistent ground state bleach at large delay times (>100 ps). This experiment affords a product c*d of 1.8 × 10⁻⁶ M cm for oABA. An estimate based on the energy per pump pulse, the diameters of pump and probe beams and the absorption at the pump wavelength yields a value in the range of the former one (2.6 × 10⁻⁶ M cm). With these inputs and fk = 0.146 (DFT-MRCI, Table 1), the quantum yield of ketene formation ϕr,k is computed to be ∼0.55 (±0.2).
4 Discussion
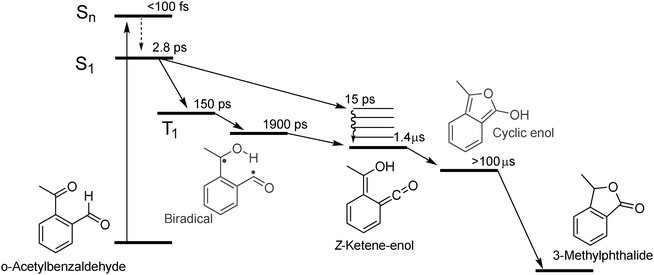
A combination of FSRS with quantum chemical computations has allowed to unambiguously identify and characterize the Z-ketene-enol intermediate in the photoreaction of oABA (a summarizing kinetic scheme of the photoreaction of oABA to 3MP is given in Scheme 2). The ketene is formed with vibrational excess energy within ∼2.5 ps after excitation. The excess energy is dissipated with a time constant of ∼11 ps. Similar time constants (τ2 = 2.8 ps and τ3 = 15 ps) are retrieved from the UV/Vis data (see Fig. 5).In addition to these two processes, the three remaining time constants in this experiment have to be assigned. The first one, τ1, lies below our instrumental response function and is therefore afflicted with a rather large uncertainty. However, it can be assigned to the relaxation to the lowest excited singlet state since our excitation wavelength is in resonance with an upper singlet state.
As can be seen in the time traces (Fig. 3, traces B and C) and the DAS of τ5 (Fig. 5), the ketene signature features an additional low amplitude rise with the characteristic time constant τ5. From the DAS a contribution of roughly 0.15 (15%) to the overall ketene yield can be estimated. This shows that on the early nanosecond timescale the ketene is populated by a path additional to the singlet channel. The amplitude of this rise is within the noise of the FSRS experiment and is therefore not clearly discernible there. We assume that the additional path involves the triplet state of oABA for the following reason. The fs-UV/Vis experiments on the oABA isomers mABA and pABA both delivered a time constant for triplet population of ∼5 ps. The excited singlet state of oABA decays with a faster time constant of ∼2.5 ps due to the additional reactive decay channel. Assuming that the rate constants for ISC are similar in all three isomers, the triplet state must still be partly populated within the 2.5 ps excited singlet state lifetime of oABA.
This triplet state then decays with a time constant of 150 ps (τ4) and forms a triplet biradical via hydrogen transfer. The corresponding DAS features several minima and maxima due to simultaneous triplet decay and biradical formation. Due to the formation of the biradical, the DAS exhibits weak minima around 460 and 370 nm which conforms with our quantum chemical results. The most pronounced maximum is situated at ∼340 nm and agrees with a decay of a triplet spectrum similar to the ones observed for mABA and pABA. The rather low positive amplitudes in this spectrum may be explained by a partial compensation of positive (triplet decay) and weaker negative (biradical formation) contributions. Furthermore, a sub-nanosecond triplet decay and biradical formation have already been discussed for the photochemistry of oPA15 and have been found in analogous reactions of ortho-substituted nitrobenzenes.10 It is this biradical which we assume to be responsible for the additional low amplitude rise of the ketene signature.
The Z-ketene-enol persists until the end of the time window of our fs-experiments. As seen in the nanosecond experiment (Fig. 4), an additional species with an absorption around 370 nm is formed upon decay of the Z-ketene with a time constant of 1.4 μs. This species exhibits a lifetime of <100 μs, which is only slightly reduced by oxygen. We presume that here we observe the same species as reported for similar compounds17,18 (the mild oxygen dependence has also been observed there and was attributed to oxidation of the species). There, the short lived components were ascribed to Z-ketene-enol and the long lived to E-ketene-enol intermediates. We agree with the first assignment, but digress from the latter. The quantum chemical computations place the E- energetically well above the Z-isomer. Thus, the Z-ketene-enol should not transform into the E-isomer. We cannot exclude that the triplet biradical partly recombines to the E-ketene-enol. However, this being a minor channel on the early nanosecond time scale, it cannot explain the formation of the 370 nm band. Instead, we suggest that the cyclic enol intermediate may be formed here. It has been discussed as an intermediate in the reaction of oPA.15 For this structure, our computations predict an absorption band which is shifted by ∼30 nm to lower wavelengths compared to the S0 → S2 ketene absorption and exhibits a comparable oscillator strength. This is in agreement with our nanosecond data.
Since all measurements were conducted in spectroscopic grade acetonitrile without further purification, it cannot be excluded that some steps of the kinetics may be influenced by water impurities. Water molecules may for example act as catalysts for certain reaction steps. However, since these are bimolecular reactions and the concentrations of the involved species are low, they should not affect the kinetics of our femtosecond data. In contrast, an influence on the microsecond kinetics cannot be excluded. The influence of water on the nano- to microsecond kinetics of a similar reaction has been investigated before.17 It was observed that addition of water shortens the lifetime of the long-lived transient without leading to additional photoproducts. Thus, one has to keep in mind that the microsecond time constants we obtained apply for the given solvent conditions.
Regarding the computations of Blancafort et al.,6 we can confirm the formation of a Z-ketene-enol intermediate via a singlet channel in the photoreaction of oABA. A triplet path was not considered in these calculations. For oPA, an energy barrier of 0.3 eV was calculated for the formation of the ketene. Assuming a pre-exponential factor of ∼1014 s−1 close to the maximum for hydrogen transfers, this translates into a formation on the nanosecond timescale according to the Arrhenius equation. For oABA, we observe a faster population in the picosecond range, which translates into a barrier in the range of ∼0.14 eV. Additionally, the computations predict the occurrence of a singlet biradical precursor for which we do not find any evidence. However, the calculations were performed for the gas phase while our experiments were conducted in solution. This may alter the barrier heights significantly and so our results are not in conflict with the computations on oPA. Additionally, Blancafort et al. predict that the ketene is formed by an irreversible hydrogen transfer.6 We performed an estimate of the quantum yield of ketene formation (Section 3.5) based on the computed oscillator strength of the ketene absorption and the fs-UV/Vis signatures. The estimated ketene yield of ∼0.55 is about two times larger than the overall reaction quantum yield to 3MP (∼30%). Unfortunately, this estimate does neither confirm nor exclude that the ketene is formed irreversibly. First, the estimated value is afflicted with a large uncertainty due to the uncertainties of the experimental and computed parameters that enter the calculation. Second, the ketene forms another intermediate on the way to 3MP so that a reaction of this intermediate back to oABA may lower the reaction quantum yield at a later time.
5 Conclusions
Extending our studies on excited state hydrogen transfers to nitro-free compounds, we have characterized the photoreaction of an ortho-substituted acylarene, oABA. Up to now, literature provides an incomplete picture of the photochemistry of such compounds and is blurred by tentative assignments. Employing modern techniques of time-resolved spectroscopy, the reaction path has been followed from the earliest processes after photoexcitation for the first time. Quantum chemistry aided in assignments of spectral signatures, so that an ultrafast excited state hydrogen transfer could unequivocally be verified. It was found that the kinetic behavior and reaction path of oABA closely resemble the ones found for ortho-substituted nitrobenzenes.3,10,52 Surprisingly, changing a substituent from a nitro- to a carbonyl-group does not appear to have a dramatic effect on the photochemical processes. The complex mechanism of these reactions appears to be conferrable to acylarenes containing hydrogen atoms in ortho-position.Acknowledgements
This article is dedicated to Prof. Dr Ulrich E. Steiner on occasion of his 70th birthday. We thank the group of Prof. Dr N. Ernsting, in particular M. Quick and Dr S. Kovalenko, for helpful discussions regarding the FSRS experiments. This study was supported by the Deutsche Forschungsgemeinschaft via project GI349/4-1. S.F. is grateful for a Chemiefonds Fellowship provided by the Fonds der Chemischen Industrie. Computational infrastructure was provided by the Centre for Information and Media Technology (ZIM) at the University of Düsseldorf.References
- Hydrogen Bonding and Transfer in the Excited State, ed. K.-L. Han and G.-J. Zhao, John Wiley & Sons, Inc., vol. I & II, 2010 Search PubMed.
- P. Klan and J. Wirz, Photochemistry of Organic Compounds. From Concepts to Practice, Wiley, Chichester, 2009 Search PubMed.
- T. Schmierer, S. Laimgruber, K. Haiser, K. Kiewisch, J. Neugebauer and P. Gilch, Phys. Chem. Chem. Phys., 2010, 12, 15653–15664 RSC.
- M. Dittmann, F. F. Graupner, B. Maerz, S. Oesterling, R. de Vivie-Riedle, W. Zinth, M. Engelhard and W. Lüttke, Angew. Chem., Int. Ed., 2014, 53, 591–594 CrossRef CAS PubMed.
- A. Migani, V. Leyva, F. Feixas, T. Schmierer, P. Gilch, I. Corral, L. Gonzalez and L. Blancafort, Chem. Commun., 2011, 47, 6383–6385 RSC.
- Q. Li, A. Migani and L. Blancafort, Phys. Chem. Chem. Phys., 2012, 14, 6561–6568 RSC.
- S. Laimgruber, W. J. Schreier, T. Schrader, F. Koller, W. Zinth and P. Gilch, Angew. Chem., Int. Ed., 2005, 44, 7901–7904 CrossRef CAS PubMed.
- S. Laimgruber, T. Schmierer, P. Gilch, K. Kiewisch and J. Neugebauer, Phys. Chem. Chem. Phys., 2008, 10, 3872–3881 RSC.
- B. Heinz, T. Schmierer, S. Laimgruber and P. Gilch, J. Photochem. Photobiol., A, 2008, 199, 274–281 CrossRef CAS.
- T. Schmierer, W. Schreier, F. Koller, T. Schrader and P. Gilch, Phys. Chem. Chem. Phys., 2009, 11, 11596–11607 RSC.
- T. Schmierer, G. Ryseck, T. Villnow, N. Regner and P. Gilch, Photochem. Photobiol. Sci., 2012, 11, 1313–1321 CAS.
- A. D. Allen and T. T. Tidwell, Chem. Rev., 2013, 113, 7287–7342 CrossRef CAS PubMed.
- V. Leyva, I. Corral, F. Feixas, A. Migani, L. Blancafort, J. Gonzalez-Vazquez and L. Gonzalez, Phys. Chem. Chem. Phys., 2011, 13, 14685–14693 RSC.
- R. W. Yip and D. K. Sharma, Res. Chem. Intermed., 1989, 11, 109–116 CrossRef CAS.
- J. C. Scaiano, M. V. Encinas and M. V. George, J. Chem. Soc., Perkin Trans. 2, 1980, 724–730 RSC.
- J. Gebicki and S. Kuberski, J. Chem. Soc., Chem. Commun., 1988, 1364–1365 RSC.
- J. C. Netto-Ferreira and J. C. Scaiano, Can. J. Chem., 1993, 71, 1209–1215 CrossRef CAS.
- L. Plistil, T. Solomek, J. Wirz, D. Heger and P. Klan, J. Org. Chem., 2006, 71, 8050–8058 CrossRef CAS PubMed.
- N. Turro, V. Ramamurthy and J. Scaiano, Modern Molecular Photochemistry of Organic Molecules, University Sciences Books, Sausalito, California, 2010 Search PubMed.
- P. Kukura, D. W. McCamant and R. A. Mathies, Annu. Rev. Phys. Chem., 2007, 58, 461–488 CrossRef CAS PubMed.
- S. Laimgruber, H. Schachenmayr, B. Schmidt, W. Zinth and P. Gilch, Appl. Phys. B: Lasers Opt., 2006, 85, 557–564 CrossRef CAS.
- M. Lorenc, M. Ziolek, R. Naskrecki, J. Karolczak, J. Kubicki and A. Maciejewski, Appl. Phys. B: Lasers Opt., 2002, 74, 19–27 CrossRef CAS.
- M. A. Marangoni, D. Brida, M. Quintavalle, G. Cirmi, F. M. Pigozzo, C. Manzoni, F. Baronio, A. D. Capobianco and G. Cerullo, Opt. Express, 2007, 15, 8884–8891 CrossRef CAS PubMed.
- E. Pontecorvo, C. Ferrante, C. G. Elles and T. Scopigno, Opt. Express, 2013, 21, 6866–6872 CrossRef CAS PubMed.
- A. Savitzky and M. Golay, Anal. Chem., 1964, 36, 1627 CrossRef CAS.
- D. Löwenich, K. Kleinermanns, V. Karunakaran and S. A. Kovalenko, Photochem. Photobiol., 2008, 84, 193–201 Search PubMed.
- M. J. Frisch, G. W. Trucks, H. B. Schlegel, G. E. Scuseria, M. A. Robb, J. R. Cheeseman, G. Scalmani, V. Barone, B. Mennucci, G. A. Petersson, H. Nakatsuji, M. Caricato, X. Li, H. P. Hratchian, A. F. Izmaylov, J. Bloino, G. Zheng, J. L. Sonnenberg, M. Hada, M. Ehara, K. Toyota, R. Fukuda, J. Hasegawa, M. Ishida, T. Nakajima, Y. Honda, O. Kitao, H. Nakai, T. Vreven, J. J. A. Montgomery, J. E. Peralta, F. Ogliaro, M. Bearpark, J. J. Heyd, E. Brothers, K. N. Kudin, V. N. Staroverov, R. Kobayashi, J. Normand, K. Raghavachari, A. Rendell, J. C. Burant, S. S. Iyengar, J. Tomasi, M. Cossi, N. Rega, J. M. Millam, M. Klene, J. E. Knox, J. B. Cross, V. Bakken, C. Adamo, J. Jaramillo, R. Gomperts, R. E. Stratmann, O. Yazyev, A. J. Austin, R. Cammi, C. Pomelli, J. W. Ochterski, R. L. Martin, K. Morokuma, V. G. Zakrzewski, G. A. Voth, P. Salvador, J. J. Dannenberg, S. Dapprich, A. D. Daniels, Ö. Farkas, J. B. Foresman, J. V. Ortiz, J. Cioslowski and D. J. Fox, Gaussian 09 Revision D.01, Gaussian Inc., Wallingford CT, 2009 Search PubMed.
- R. Ahlrichs, M. K. Armbruster, R. A. Bachorz, M. Bar, H. P. Baron, R. Bauernschmitt, F. A. Bischoff, S. Bocker, N. Crawford and P. Deglmann, TURBOMOLE 6.3, 2010 Search PubMed.
- J. Tomasi, B. Mennucci and R. Cammi, Chem. Rev., 2005, 105, 2999–3094 CrossRef CAS PubMed.
- S. Grimme and M. Waletzke, J. Chem. Phys., 1999, 111, 5645–5655 CrossRef CAS.
- M. Kleinschmidt, C. M. Marian, M. Waletzke and S. Grimme, J. Chem. Phys., 2009, 130, 044708 CrossRef PubMed.
- A. Schäfer, A. Klamt, D. Sattel, J. C. Lohrenz and F. Eckert, Phys. Chem. Chem. Phys., 2000, 2, 2187–2193 RSC.
- S. D. Williams, T. J. Johnson, T. P. Gibbons and C. L. Kitchens, Theor. Chem. Acc., 2007, 117, 283–290 CrossRef CAS.
- D. A. Long, Raman Spectroscopy, McGraw-Hill International Book Company, 1977 Search PubMed.
- D. McCamant, P. Kukura and R. Mathies, Appl. Spectrosc., 2003, 57, 1317–1323 CrossRef CAS PubMed.
- E. C. L. Ru and P. G. Etchegoin, Principles of Surface-Enhanced Raman Spectroscopy, Elsevier, 2009 Search PubMed.
- E. Pretsch, P. Bühlmann and M. Badertscher, Structure Determination of Organic Compounds: Tables of Spectral Data, Springer, 2009 Search PubMed.
- H. Lutz, E. Breheret and L. Lindqvist, J. Phys. Chem., 1973, 77, 1758–1762 CrossRef CAS.
- M. Montalti, A. Credi, L. Prodi and T. Gandolfi, Handbook of Photochemistry, Taylor & Francis, 3rd edn, 2006 Search PubMed.
- L. Giering, M. Berger and C. Steel, J. Am. Chem. Soc., 1974, 96, 953–958 CrossRef CAS.
- S. Chattopadhyay, C. Kumar and P. Das, J. Photochem., 1985, 30, 81–91 CrossRef CAS.
- H. Satzger and W. Zinth, Chem. Phys., 2003, 295, 287–295 CrossRef CAS.
- E. T. J. Nibbering, H. Fidder and E. Pines, Annu. Rev. Phys. Chem., 2005, 56, 337–367 CrossRef CAS PubMed.
- P. Hamm, S. Ohline and W. Zinth, J. Chem. Phys., 1997, 106, 519–529 CrossRef CAS.
- T. Schrader, A. Sieg, F. Koller, W. Schreier, Q. An, W. Zinth and P. Gilch, Chem. Phys. Lett., 2004, 392, 358–364 CrossRef CAS.
- N. B. Colthup, L. H. Daly and S. E. Wiberley, Introduction to Infrared and Raman Spectroscopy, Academic Press, 3rd edn, 1990 Search PubMed.
- E. Smith and G. Dent, Modern Raman Spectroscopy, John Wiley & Sons Ltd, 2005 Search PubMed.
- A. C. Albrecht, J. Chem. Phys., 1961, 34, 1476–1484 CrossRef CAS.
- W. Parson, Modern Optical Spectroscopy, Student Edition, Springer, Dordrecht, Heidelberg, London, New York, 2009 Search PubMed.
- S. Kovalenko, A. Dobryakov, I. Ioffe and N. Ernsting, Chem. Phys. Lett., 2010, 493, 255–258 CrossRef CAS.
- V. V. Semionova, E. M. Glebov, V. V. Korolev, S. A. Sapchenko, D. G. Samsonenko and V. P. Fedin, Inorg. Chim. Acta, 2014, 409(Part B), 342–348 CrossRef CAS.
- T. Schmierer, F. Bley, K. Schaper and P. Gilch, J. Photochem. Photobiol., A, 2011, 217, 363–368 CrossRef CAS.
Footnote |
| † Electronic supplementary information (ESI) available: Absorption spectra, IR spectra of oABA upon illumination, additional nanosecond data for oABA, mABA and pABA, fs-UV/Vis data for mABA, additional computational results. See DOI: 10.1039/c4cp03351e |
| This journal is © the Owner Societies 2015 |

