Fe2O3 nanoparticles anchored in situ on carbon nanotubes via an ethanol-thermal strategy for the selective catalytic reduction of NO with NH3†
Jin
Han
,
Dengsong
Zhang
*,
Phornphimon
Maitarad
,
Liyi
Shi
,
Sixiang
Cai
,
Hongrui
Li
,
Lei
Huang
and
Jianping
Zhang
Research Center of Nano Science and Technology, Shanghai University, Shanghai 200444, China. E-mail: dszhang@shu.edu.cn; Fax: +86 021 66136079; Tel: +86 021 66136081
First published on 29th August 2014
Abstract
Fe2O3 nanoparticles were anchored in situ on carbon nanotubes (CNTs) via an ethanol-thermal route, for the selective catalytic reduction (SCR) of NO with NH3. The structure and surface characteristics of the obtained catalysts were measured by transmission electron microscopy, X-ray diffraction, N2 adsorption–desorption isotherms, Raman, X-ray photoelectron spectroscopy, H2-temperature programmed reduction, and NH3-temperature programmed desorption. Compared with catalysts prepared via impregnation or co-precipitation methods, the synthesized catalyst showed better catalytic activity and a more extensive operating-temperature window. The TEM and XRD results suggested that the iron species was uniformly anchored on the surface of the CNTs. The Raman and XPS results indicated that the catalyst has a relatively higher number of defects, a higher atomic concentration of Fe present on the surface of the CNTs and a higher content of chemisorbed oxygen species. The H2-TPR and NH3-TPD results demonstrated that the catalyst possesses a more powerful reducibility and stronger acid strength than the other two catalysts. Based on the above-mentioned physicochemical properties, the obtained catalyst showed an excellent performance in the SCR of NO to N2 with NH3. Additionally, the catalyst also presented outstanding stability, H2O resistance and SO2 tolerance.
1. Introduction
Nitrogen oxides (NOx), which arise from the combustion of fossil fuels in industrial processes, can result in environmental contamination, such as acid rain, photochemical smog and air haze.1–4 Nowadays, certain processes have been employed to remedy these environmental problems.4–10 Among these methods, selective catalytic reduction (SCR) technology is a state-of-the-art process which, through a reductant-NH3 selective chemical reaction with NOx, forms the environmental products N2 and H2O.5,6 The commercial catalyst V2O5–WO3 (MoO3)/TiO2 has been widely used for NOx elimination.4–6 However, there still remain some inevitable unsolved problems, such as low N2 selectivity at high temperatures, and the volatility and toxicity of V2O5.5,11–13 What's more, the oxidation of SO2 to SO3 could cause etching of the equipment and blocking of the pores of the catalyst.5,11,12 So it is meaningful to design and develop a suitable non-vanadium catalyst with a relatively low working temperature and a great resistance to SO2 toxicity.11,14,15Iron oxide, as an ordinary transition metal oxide, has been widely investigated either as an active ingredient or promoter for DeNOx catalysts, due to its inherently environmentally friendly character, its prominent thermal stability and its outstanding SO2 resistance; for example, as Fe2O3,16 Fe/ZSM-5,11,17–22 Fe/HBEA,23,24 Au/Fe2O3,25 Fe2O3–TiO2,26 and Fe2O3–CeO2/TiO2.27 The catalytic performance and mechanism of Fe zeolites in NH3-SCR have been systematically studied,11,17–24 and ferric oxides have also been applied as additive agents.13,14,27 However, as the application of the NH3-SCR of NO is always downstream of the desulfurizer and electrostatic precipitator, it is still necessary to improve the low temperature activity of ferric oxide catalysts.
Recently, it was demonstrated that carbon nanotubes (CNTs) possess the feature of outstanding adsorption of ammonia, nitric oxides and other gaseous substances.28–31 Besides, CNTs could decompose and directly reduce NO,32,33 and improve the SO2 resistance with a decrease in the decomposition temperature of sulfates and bisulfates.34,35 Hence, CNTs have attracted great attention for the NH3-SCR of NO.36–39 It is considered that a good dispersion of active ingredients on the support could favor activity during the NH3-SCR reaction,40,41 and thus it is significant to realize active species with a smaller size that are highly dispersed on the support. Normally, CNT-carried catalysts are synthesized by an impregnation method36,42 or sol–gel method.26,35,43,44 However, the active nanoparticles can't be uniformly dispersed on the surface of the CNTs when using these routes. Therefore, there still remains a great challenge to uniformly disperse the active species on the CNTs. Recently, we accomplished in situ the production of MnOx–CeOx nanoparticles supported on CNTs, via a surfactant assisted reflux route41 and a pyridine-thermal route,45 and found that they all displayed enhanced NH3-SCR activity and improved resistance to SO2 and H2O when compared with the same catalyst synthesized by an impregnation method.
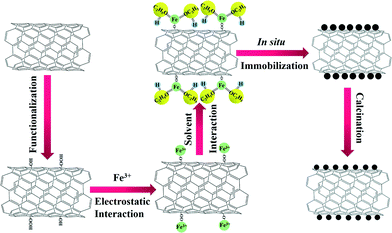
Herein, we have rationally designed and prepared for the first time, highly dispersed Fe2O3 nanoparticles on CNTs via an ethanol-thermal route. As illustrated in Scheme 1, Fe2O3 nanoparticles were anchored in situ on the CNTs by an ethanol-thermal strategy. Firstly, the Fe3+ interacts with the hydroxyl and carboxyl groups on the surface of the pretreated CNTs due to the electrostatic effect. Secondly, the ethanol may bond with the Fe3+ through the strongly electronegative end to afford the Fe3+ electric neutrality. After the solvothermal process and calcination, the Fe2O3 nanoparticles were anchored in situ on the CNTs. In this synthetic process, the steric hindrance of ethanol can effectively separate each of the Fe3+ particles, and thus highly dispersed Fe2O3 nanoparticles were formed in situ on the CNTs. The obtained catalysts were systematically characterized, and their NH3-SCR activities, stabilities, H2O resistances and SO2 tolerances were also investigated.
2. Experimental
2.1 Catalyst preparation
The multiwall carbon nanotubes (CNTs) were furnished by Qinhuangdao Tai Chi Ring Nano-products Co. Ltd (China). All other chemicals were purchased from the Sinopharm Chemical Regent Company and were used without any further purification. The raw CNTs were 1–10 μm in length and 10–30 nm in diameter. The CNTs were pretreated by refluxing in dilute HNO3 (6 mol L−1) under stirring for 6 h at 120 °C, to remove metal species and impurities that existed in the surface of the raw CNTs; they were then washed with an excess of deionized water until the pH was neutral, and were dried at 100 °C in oven overnight.In a typical synthesis, 0.23 g of pretreated CNTs, 0.03 g of iron(III) nitrate nonahydrate and 80 mL of ethanol were mixed with subsequent ultrasonic treatment at room temperature for 0.5 h. Then the mixture was poured into a stainless steel autoclave with PTFE lining (100 mL) and maintained at 120 °C for 24 h. After the autoclave was cooled to an ambient temperature, the suspension was filtered and washed, and then dried at 100 °C for 12 h. Finally, it was calcined in a N2 stream at 450 °C for 4 h, with a heating rate of 2 °C min−1. The obtained catalyst was denoted as Fe2O3/CNTs-ET.
For comparison, the catalysts were also separately prepared by impregnation and co-precipitation methods. In the impregnation procedure, 0.69 g of pretreated CNTs were added to a solution of iron(III) nitrate nonahydrate (0.09 g) and H2O (80 mL) with stirring until the solution dried at 80 °C, and was then calcined in a N2 stream at 450 °C for 4 h, with a heating rate of 2 °C min−1. The catalyst synthesized by this method was denoted as Fe2O3/CNTs-IM. In the co-precipitation procedure, 0.23 g of pretreated CNTs, 0.03 g of iron(III) nitrate nonahydrate, 0.5 g of urea and 80 mL of H2O were mixed in a beaker with subsequent ultrasonic treatment for 0.5 h. Then the mixture was transferred into a stainless steel autoclave with PTFE lining (100 mL) and maintained at 120 °C for 24 h. After the autoclave was cooled to room temperature, the suspension was filtered and washed with an excess of water, and then dried at 100 °C for 12 h. Finally, it was calcined in a N2 stream at 450 °C for 4 h, with a heating rate of 2 °C min−1. The obtained catalyst was denoted as Fe2O3/CNTs-CP. The Fe2O3 supported on TiO2 was synthesized by an impregnation method with the iron content unchanged, and was denoted as Fe2O3/TiO2.
2.2 Characterization
The morphologies and surface structures of the catalysts were observed using a transmission electron microscope (TEM, JEOL JEM-200CX) and a field emission high resolution transmission electron microscope (HRTEM, JEOL JEM-2100F). The energy dispersive X-ray spectroscopy (EDS) was carried out on a TEM (JEOL JEM-2100F). Powder X-ray diffraction (XRD) was performed with a Rigaku D/MAX-2200 X-ray diffractometer, using Cu Kα (40 kV, 40 mA) radiation and a secondary beam graphite monochromater. Nitrogen adsorption–desorption isotherms of the samples were taken at 77 K using an ASAP 2020 volumetric adsorption analyzer. Before the measurements, all the samples were degassed overnight at 573 K in a vacuum line. The specific surface areas and the pore volumes of the samples were calculated by the Brunauer–Emmett–Teller (BET) method and the pore size distributions were derived from the adsorption branches of the isotherms, using the Barrett–Joyner–Halenda (BJH) model. The Raman spectra were recorded on a spectrometer (JY H800UV) equipped with an optical microscope at room temperature. X-Ray photoelectron spectroscopy (XPS) was recorded on a Perkin-Elmer PHI-5000C ESCA system equipped with a dual X-ray source, using an Mg Kα (1253.6 eV) anode and a hemispherical energy analyzer. The background pressure during data acquisition was kept below 10−6 Pa. The XPS species of the elements in these catalysts were recorded and fitted by XPS PEAK 4.1 software, which had been calibrated against the standardized C 1s peak at 284.6 eV. Temperature-programmed reduction by hydrogen (H2-TPR) was obtained on a Tianjin XQ TP5080 auto-adsorption apparatus. 50 mg of the catalyst was outgassed at 300 °C under a N2 atmosphere. After cooling to room temperature under a N2 atmosphere, the flowing gas was switched to 5% H2/N2 and the sample was heated to 840 °C at a heating rate of 10 °C min−1. The H2 consumption was monitored by a thermal conductivity detector (TCD). Temperature-programmed desorption experiments on ammonia (NH3-TPD) were conducted on a Tianjin XQ TP5080 auto-adsorption apparatus. Before the TPD, each sample was pretreated with high-purity (99.999%) He (35 mL min−1) at 300 °C for 0.5 h, then saturated with high-purity anhydrous ammonia at 100 °C for 1 h and subsequently flushed at the same temperature for 1 h to remove physically-adsorbed ammonium. Finally, the TPD experiment was carried out from 100 °C to 525 °C at a heating rate of 10 °C min−1. The amount of NH3 that was desorbed was monitored by a TCD.2.3 Catalytic tests
The NH3-selective catalytic reduction activity tests were completed in a fixed-bed quartz reactor using 0.2 g catalyst (40–60 mesh). The gas mixture was composed of 500 ppm NO, 500 ppm NH3, 3 vol.% O2, N2 balance, 200 ppm SO2 (when used) and 4 vol.% H2O (when used). The gas hourly space velocity (GHSV) was about 18![[thin space (1/6-em)]](https://www.rsc.org/images/entities/char_2009.gif) 000 h−1 while the total flow rate of the feed gas was approximately 220 mL min−1. The reaction temperature was from 150 °C to 400 °C. All the concentrations of the feed gas and the tail gases were detected by a KM9106 flue gas analyzer when the reaction reached 15 min.
000 h−1 while the total flow rate of the feed gas was approximately 220 mL min−1. The reaction temperature was from 150 °C to 400 °C. All the concentrations of the feed gas and the tail gases were detected by a KM9106 flue gas analyzer when the reaction reached 15 min.
3. Results & discussion
3.1 Characteristics of the catalysts
The microstructures of the catalysts and the size distribution of ferric oxide nanoparticles supported on the surface of the CNTs were investigated using a TEM. As shown in Fig. 1a and b, the TEM images show that Fe2O3/CNTs-ET exhibited a homogeneous dispersion of ferric oxide nanoparticles supported on the surface of the CNTs, and that the particle size was uniform. The HRTEM image in Fig. 1c shows that the inter-planar distance was 0.23 nm, which is related to the (222) plane of Fe2O3. Fig. 1d presents the EDS spectrum of Fe2O3/CNTs which confirms the presence of iron elements, suggesting that the Fe species are supported on the surface of the CNTs. As can be seen in the Fig. 1 inset, it was observed that the sizes of the ferric oxide nanoparticles on the CNTs were in the range of 2.5–8.0 nm and that the average size of the nanoparticles was 4.8 nm. However, for Fe2O3/CNTs-IM, the particles aggregated to some extent (Fig. S1a, ESI†); and for Fe2O3/CNTs-CP and Fe2O3/TiO2, Fe2O3 nanoparticles displayed a distinct agglomeration (Fig. S1b and c, ESI†). This indicates that the active components are uniformly anchored on the surface of the CNTs by the ethanol-thermal method. Moreover, for Fe2O3/CNT-ET, the XRD peaks assigned to Fe2O3 were negligible, which suggests a good dispersion of Fe species (Fig. S2, ESI†). It was confirmed that the Fe2O3 nanoparticles can be highly dispersed on CNTs by the ethanol-thermal method.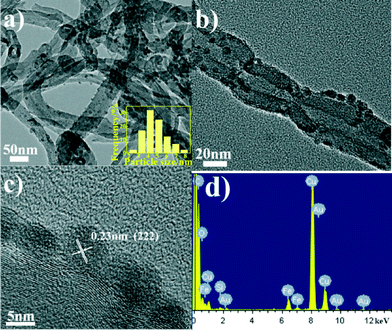 | ||
| Fig. 1 (a, b) TEM images of Fe2O3/CNTs-ET; (c) HRTEM image of Fe2O3/CNTs-ET; (d) EDS spectrum of Fe2O3/CNTs-ET; (inset) size distribution of ferric oxide nanoparticles of Fe2O3/CNTs-ET. | ||
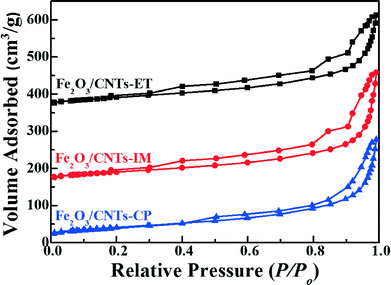
The specific surface areas, pore volumes and pore sizes of the catalysts were analyzed using N2 adsorption–desorption isotherms. As displayed in Fig. 2, the Fe2O3 nanoparticles supported on CNTs by three different methods imply the IV isotherm with the relative pressure P/Po = 0.15, indicating the existence of a mesoporous structure, and Fe2O3/TiO2 also presents a mesoporous structure due to the stack of particles (Fig. S3, ESI†). In addition, the specific surface areas, pore volumes and pore sizes of the catalysts are summarized in Table 1. As shown directly in Table 1, there is no obvious difference between the three catalysts. Moreover, the BET surface area of the Fe2O3/CNTs catalyst was about 145 m2 g−1, which is higher than that of Fe2O3/TiO2.
| Fe2O3/CNTs-ET | Fe2O3/CNTs-IM | Fe2O3/CNTs-CP | Fe2O3/TiO2 | |
|---|---|---|---|---|
| BET surface area (m2 g−1) | 147 | 144 | 146 | 55 |
| Pore volume (cm3 g−1) | 0.41 | 0.48 | 0.43 | 0.33 |
| Pore size (Å) | 95 | 110 | 101 | 199 |
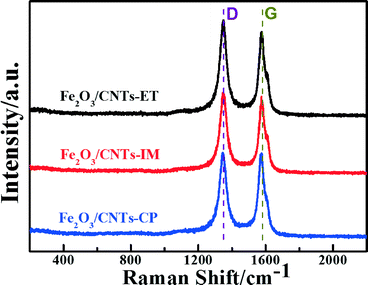
Raman spectroscopy is a powerful tool in probing the lattice vibrational states and dynamics of CNTs, under the variation of the layer number with respect to the CNT surface plane.46–49 The Raman spectra of Fe2O3/CNTs prepared by the three routes are displayed in Fig. 3. The G-band, at around 1580 cm−1, is associated with an E2g mode of graphite and is related to the vibration of sp2 bonded carbon atoms in a 2-dimensional hexagonal lattice. The D-band, centred around 1360 cm−1, corresponds to the vibrations of carbon atoms with dangling bonds in plane terminations of disordered graphite or glassy carbon.50–52 The ID/IG (the ratio of the intensities of the D and G bands) values over Fe2O3/CNTs-ET, Fe2O3/CNTs-IM, Fe2O3/CNTs-CP and CNTs were around 1.02, 0.99, 0.89 and 0.81 (Fig. 3 and S4, ESI†), respectively. Compared with the value of ID/IG over CNTs, the value over Fe2O3/CNTs-ET is larger than the others, which suggest that more defects were created by introducing the active species.52 Furthermore, the increased ratio of ID/IG indicates an increase of surface defects in the Fe2O3/CNTs-ET,53 which should be favorable to the NH3-SCR of NO. The Raman results of Fe2O3/CNTs and CNTs demonstrate that the structure of multi-wall CNTs can be retained after being loaded with Fe2O3 nanoparticles.50
In order to acquire information on the atomic concentrations and element chemical states of each catalyst's surface, the XPS spectra of the Fe 2p and O 1s in these catalysts were recorded. Fig. 4A shows the Fe peaks assigned to Fe species (Fe 2p3/2 and Fe 2p1/2). The Fe peaks of Fe2O3/CNTs were assigned to oxidized Fe species, most likely Fe3+ type species.13,54 The binding energies centered at about 709.8 eV and 711.2 eV may be assigned to Fe3+ in the spinel structure, and the binding energy centered at about 712.4 eV may be ascribed to Fe3+ bonded with a hydroxyl group.55 It is interesting that the surface atomic concentration of Fe over Fe2O3/CNTs-ET is higher than those of Fe2O3/CNTs-IM and Fe2O3/CNTs-CP, as shown in Table 2. It has been demonstrated that accessible Fe3+ can participate in the reversible redox cycle, which is beneficial for SCR activity.13 Based on the above results, it is reasonable that Fe2O3/CNTs-ET could display the best capacity for NH3-SCR performance among the three catalysts.
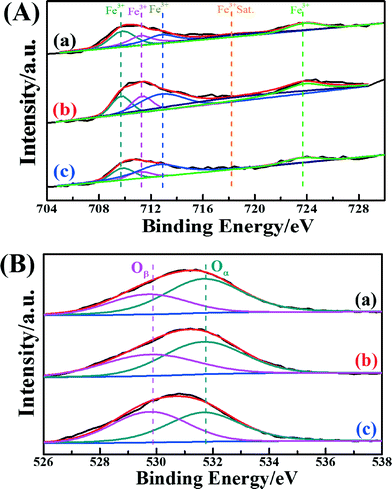 | ||
| Fig. 4 (A) Fe 2p spectra and (B) O 1s spectra of the catalysts: (a) Fe2O3/CNTs-ET, (b) Fe2O3/CNTs-IM and (c) Fe2O3/CNTs-CP. | ||
| Catalysts | Surface atomic concentration/% | Binding energy/eV | The relative concentration ratios/% | ||||
|---|---|---|---|---|---|---|---|
| C | Fe | O | Oβ | Oα | Oβ/(Oα + Oβ) | Oα/(Oα + Oβ) | |
| Fe2O3/CNTs-ET | 92.93 | 0.43 | 7.64 | 529.8 | 531.7 | 34.45 | 65.55 |
| Fe2O3/CNTs-IM | 92.01 | 0.42 | 7.57 | 529.8 | 531.7 | 42.41 | 57.59 |
| Fe2O3/CNTs-CP | 92.19 | 0.23 | 7.59 | 529.8 | 531.7 | 47.81 | 52.19 |
The XPS spectra of O 1s for the three catalysts are presented in Fig. 4B. All three catalysts show two overlapping peaks of the O 1s. The overlapping peaks of O 1s at a binding energy of 529.8 eV could be assigned to lattice oxygen (donated as Oβ), and the overlapping peaks of O 1s at binding energies of about 531.7 eV could attributed to chemisorbed oxygen (donated as Oα), which could belong to defect oxide or hydroxyl-like groups.27,56–58Table 2 summarizes the binding energies of O 1s and the atomic ratios of Oα/(Oα + Oβ) for the three catalysts. As seen clearly in Fig. 4B and Table 2, Fe2O3/CNTs-ET had a higher ratio of Oα/(Oα + Oβ) than Fe2O3/CNTs-IM and Fe2O3/CNTs-CP, mainly on account of the increase in chemisorbed oxygen species on the catalyst surface by the iron species.27 The surface chemisorbed oxygen Oα has been reported to be the most active oxygen, and is highly active in the oxidation reaction due to its higher mobility. Besides, the high relative concentration ratio of Oα/(Oα + Oβ) on the surface of the catalyst could be correlated with the high NH3-SCR activity.59 The loading of Fe2O3 nanoparticles on the CNTs by the ethanol-thermal route could create more vacancies on the catalyst surface, and lead to the increase of chemisorbed oxygen on the surface. It is reported that the NO2 would enhance the NH3-SCR reaction by participating in the “fast SCR” reaction route on the catalysts.15 It has been demonstrated that the chemisorbed oxygen plays an important role in oxidation reactions.59 Therefore, the Oα plays a crucial role in the NH3-selective catalytic reduction process for promoting the oxidation of NO to NO2.60 Thus, the Fe2O3/CNTs-ET, which possess the highest Oα content, could be beneficial for improving the low-temperature NH3-SCR catalytic activity, as expected.
H2-TPR measurements were extensively performed to investigate the reducibility of the iron species in the different catalysts. Fig. 5 presents the H2-TPR profiles of the different samples. In the temperature range 100–840 °C, all three catalysts presented three distinct H2 consumption peaks, which were assigned to the three-stepwise reduction of Fe2O3 → Fe3O4, Fe3O4 → FeO, and FeO → Fe.25 For Fe2O3/TiO2, the H2-TPR profile showed the sequential reduction of Fe2O3 to Fe (Fig. S5a, ESI†). Comparing the Fe2O3/CNTs made by each method, the corresponding reduction peaks of Fe2O3/CNTs-ET shifted to a relatively low temperature. It should be pointed out that the area of the reduction peak has a direct relationship with the consumed content of H2. It can be seen clearly that the area of the reduction peak over Fe2O3/CNTs-ET is the largest among the three catalysts. The H2 consumption values of all the three Fe2O3/CNTs are given in Table 3. As shown in Table 3, Fe2O3/CNTs-ET exhibited the largest H2 consumption among the three catalysts. In addition, the content of the reductive species was related to the degree of dispersion, which suggests that Fe2O3 nanoparticles were highly dispersed on the CNTs by the ethanol-thermal method. Thus, the Fe2O3/CNTs-ET can offer more active species, which is in accordance with the XPS results. Since more reductive species could enhance the NH3-SCR reaction, the Fe2O3/CNTs synthesized by the ethanol-thermal route expose more reductive species, which should be beneficial to low-temperature NH3-SCR performance.
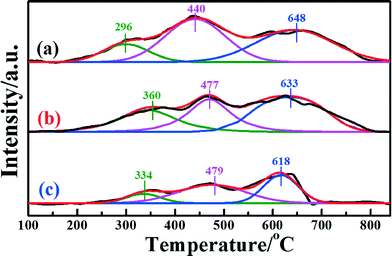 | ||
| Fig. 5 H2-TPR profiles of the catalysts: (a) Fe2O3/CNTs-ET, (b) Fe2O3/CNTs-IM and (c) Fe2O3/CNTs-CP. | ||
| Catalysts | |||
|---|---|---|---|
| Fe2O3/CNTs-ET | Fe2O3/CNTs-IM | Fe2O3/CNTs-CP | |
| Consumed hydrogen (mmol g−1) | 0.072 | 0.056 | 0.034 |
The NH3-TPD technique has been extensively used to characterize the adsorption of ammonia on the surface active sites of catalysts, which plays a significant role in the NH3-SCR reaction. To investigate the surface acid amount and strength of the catalysts, NH3-TPD was performed. Fig. 6 shows the temperature-programmed desorption after ammonia adsorption over the three catalysts. It is clear that all three catalysts present three desorption peaks at desorption temperatures in the range 100–525 °C. The peaks around 150–160 °C were caused by the desorption of weak acid sites; the peaks around 200–220 °C were caused by the medium acid sites; and the peaks around 390–420 °C were caused by the strong acid sites.35 It is generally accepted that Lewis acids attributed to coordinated NH3 molecules are more thermally stable than Brønsted acid sites attributed to NH4+, so it can be inferred that the desorption peak at a low temperature is assigned to physisorbed NH3, and the desorption peak at high temperature is assigned to chemisorbed NH3.26,59 It was demonstrated that the position and area of the desorption peaks are correlated with the acid strength and acid amount, respectively.41 The desorption peaks of Fe2O3/CNTs made by different methods locate at similar temperatures, indicating that the acid sites are similar among them.
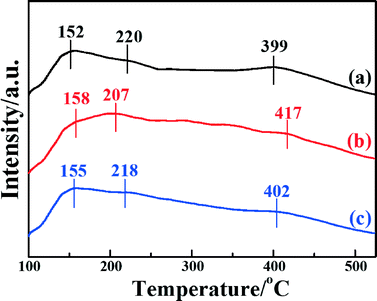 | ||
| Fig. 6 NH3-TPD profiles of the catalysts: (a) Fe2O3/CNTs-ET, (b) Fe2O3/CNTs-IM and (c) Fe2O3/CNTs-CP. | ||
It is clear that the amounts of adsorbed NH3 for Fe2O3/CNTs-ET and Fe2O3/CNTs-IM are greater than that of Fe2O3/CNTs-CP. However, it is notable that Fe2O3/CNTs-ET shows a higher amount of Lewis acid sites than the other two Fe2O3/CNTs catalysts. For Fe2O3/TiO2, the intensity of the desorption peaks for adsorbed NH3 is very weak and mainly concentrates at low temperature (Fig. S5b, ESI†). It has been demonstrated that the CNTs themselves present both weak acid sites and strong acid sites as a catalyst support.28,29 Additionally, the results of the NH3-TPD imply that the synthesis route has a crucial effect on the amount of acidic sites on the catalysts. As has been reported, the highly dispersed active species on the support could offer a large number of acidic sites and result in the best catalytic activity.28 Therefore, the greater amount of the strongest acid sites over Fe2O3/CNTs-ET could be attributed to the highly dispersed Fe2O3 nanoparticles and the CNTs themselves.
3.2 Catalytic performance
Fig. 7 shows the NO conversion curves of the catalysts with reaction temperatures ranging from 150 °C to 400 °C. It can clearly be observed that the reaction temperature has a remarkable influence on the NO reduction efficiency over different catalysts. A negligible NO reduction efficiency was noticed for Fe2O3/CNTs-CP until the temperature reached 400 °C, whereas highly dispersed Fe2O3 nanoparticles on CNTs fabricated by the ethanol-thermal route displayed a favorable NH3-SCR performance. The light-off temperature (at which the conversion of NO reaches 50%, T50) of Fe2O3/CNTs-ET was 220 °C, and 96% NO conversion was achieved at 320 °C. The Fe2O3/CNTs-ET showed the best low-temperature NO conversion among the three catalysts and displayed excellent NH3-SCR activity over a broad temperature window, varying from 250 °C to 400 °C, with NO conversions of more than 80%. It was noted that the Fe2O3/CNTs-ET also showed a better performance at low temperatures than Fe2O3/TiO2 (Fig. S6, ESI†). The differences between the three catalysts could be due to the different physical chemical characterizations of them. The results of the TEM characterization and XRD demonstrated that the Fe2O3 nanoparticles were uniformly anchored on the surface of the CNTs for Fe2O3/CNTs-ET, which could be beneficial for outstanding NH3-SCR activity. Based on the results of the Raman spectroscopy and XPS for Fe2O3/CNTs-ET, it is clear that more defect Fe atoms exist on the catalyst surface, which indicates that more active sites are provided for the SCR reaction. Additionally, the high content of chemisorbed oxygen would enhance the low-temperature NH3-SCR reduction activity by accelerating the oxidation of NO to NO2 during the “fast SCR” reaction. The results of the H2-TPR indicated that the reducibility of Fe2O3/CNTs-ET was the strongest among the three catalysts, which could promote the NH3-SCR reaction. Therefore, the robust interactions between ferric oxide and CNTs could cause the improvement in the NH3-SCR activity of Fe2O3/CNTs-ET.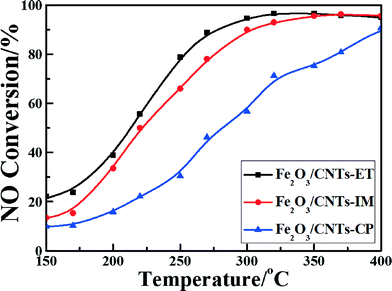 | ||
Fig. 7 NO conversion vs. temperature over the catalysts. Reaction conditions: [NO] = [NH3] = 500 ppm, [O2] = 3 vol.%, N2 balance, and GHSV = 18![[thin space (1/6-em)]](https://www.rsc.org/images/entities/char_2009.gif) 000 h−1. 000 h−1. | ||
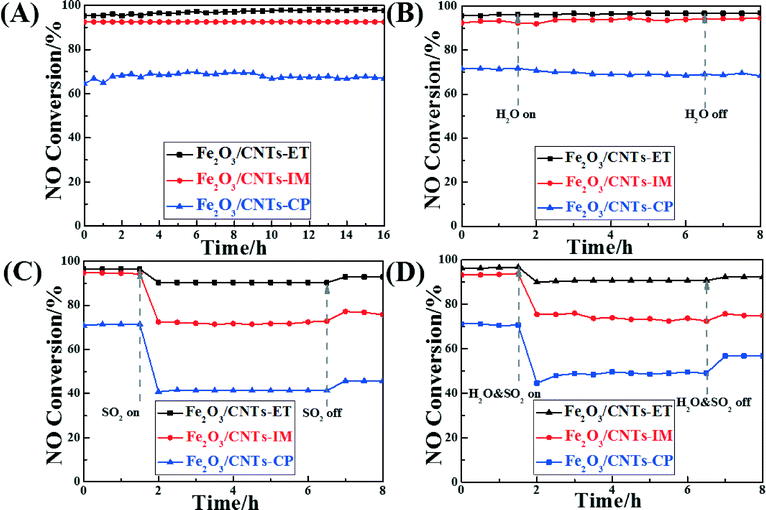
Assessing the change in catalytic activity with different times on stream is a significant way to estimate catalysts' properties. Fig. 8A displays the catalytic activity of the different catalysts with different times on stream at 320 °C. All the catalysts remained unchanged and kept their highest conversion values during the whole test period, and Fe2O3/CNTs-ET showed the highest activity. It was noted that oxidation of the carbon nanotubes didn't occur at this temperature during the SCR process, which has also been confirmed in our previous work.41,61 As is well-known, some residual H2O and SO2 still exist in the exhaust gas after the desulphurization process, which can poison and devitalize the catalysts for the NH3-SCR reaction.3 Thus, it is worth noting the NO conversions of the catalysts in the presence of H2O and SO2. The influence of H2O on the NH3-SCR activity of the Fe2O3 supported on CNTs by the three different methods, as a function of time at 320 °C, was investigated, as shown in Fig. 8B. When introducing 4 vol.% H2O to the feed gas, the NO conversion of all catalysts remained unchanged during the whole test period whether or not H2O was present. It was confirmed that the competitive adsorption between H2O and NH3 on the active sites of the catalyst surface could lead to the inhibition of the H2O. This combined with the NH3-TPD results (Fig. 6) suggests that the Fe2O3/CNTs-ET could preferentially adsorb NH3 rather than H2O in the feed gas, using the total amount of acid sites over Fe2O3/CNTs-ET, leading to an excellent H2O resistance ability.16 The above results suggest that Fe2O3/CNTs-ET could be an appropriate candidate for H2O resistance. Fig. 8C shows the effect of SO2 on the NO conversion of the catalysts at the typical temperature of 320 °C. The total flow rate of the feed gas was 220 mL min−1. As shown in Fig. 8C, the NO conversion of Fe2O3/CNTs-ET was 97% in the absence of SO2, which decreased to 91% when SO2 (200 ppm) was introduced to the feed gas. With the continual addition of 200 ppm SO2, the NO conversion of the Fe2O3/CNTs-ET remained stable. In contrast, the addition of SO2 to the reaction conditions induced a significant decrease in the NO conversion of the Fe2O3/CNTs-IM and Fe2O3/CNTs-CP, by 22% and 30% respectively. After cutting off the SO2 supply to the feed gas, the NO conversion of Fe2O3/CNTs-ET was restored to 92% without any fluctuations during the test periods. However, for Fe2O3/CNTs-IM and Fe2O3/CNTs-CP, once the SO2 stream was stopped, NO conversion was restored to a certain extent, and finally returned to 77% and 46%, respectively. The above results indicate that the Fe2O3/CNTs-ET shows the best resistance to SO2 among the three catalysts. It is well known that the SO2 stream can poison and deactivate the catalyst with the formation and deposition of sulfates and bisulfates on the surface of the catalyst in NH3-SCR reduction.34,35 At the same time, NH3 reacts with SO2 instead of reacting with NO, which could decrease the reaction between NH3 and NO. Compared with Fe2O3/CNTs-IM and Fe2O3/CNTs-CP, Fe2O3/CNTs-ET presents a better resistance to SO2. The results of NH3-SCR activity under the reaction conditions in the presence of both H2O and SO2 over the catalysts were also investigated, as shown in Fig. 8D. As could clearly be seen, the activity of Fe2O3/CNTs-ET only decreased by about 6% after introducing 4 vol.% H2O and 200 ppm SO2 together, but the volume raised to 92% when the mixture of H2O and SO2 was eliminated. In contrast, the NO conversions of Fe2O3/CNTs-IM and Fe2O3/CNTs-CP radically decreased, by 18% and 26%, respectively, in the mixture of 4 vol.% H2O and 200 ppm SO2; they then recovered to 75% and 57%, respectively, once the H2O and SO2 were cut off. The above results show that Fe2O3/CNTs-ET possesses a good capacity for resistance to water and sulfur dioxide.
4. Conclusions
In summary, Fe2O3 nanoparticles anchored on CNTs were prepared in situ, via an ethanol-thermal route, for the selective catalytic reduction of NO with NH3. Fe2O3/CNT-ET presented a better NH3-SCR performance, higher H2O-resistance and greater SO2 tolerance than the catalysts synthesized by impregnation or co-precipitation routes. Additionally, it presented a better NH3-SCR activity than Fe2O3/TiO2. The outstanding NH3-SCR activity of the Fe2O3/CNT-ET could be attributed to the high dispersion of Fe2O3 nanoparticles on the CNTs, the greatest amount of defects on the surface, the robust reducibility, the stronger acid strength and the larger amount of chemisorbed oxygen. According to these excellent properties, the Fe2O3/CNT-ET catalyst might be a promising candidate for the NH3-SCR of NO with NH3.Acknowledgements
The authors acknowledge the support of the National Natural Science Foundation of China (51108258) and the Shanghai Municipal Education Commission (14ZZ097). We thank Prof. W. J. Yu and Prof. B. Lu from the Analysis and Test Centre of SHU for help with the TEM and Raman measurements. The authors would like to thank Dr. K. Zhang from the Analysis and Test Centre of NERCN for help with the HRTEM measurements.Notes and references
- H. Bosch and F. Janssen, Catal. Today, 1988, 2, 369–379 CrossRef CAS.
- W. C. Wang and N. D. Sze, Nature, 1980, 286, 589–590 CrossRef CAS.
- J. M. Hao, H. Z. Tian and Y. Q. Lu, Environ. Sci. Technol., 2002, 36, 552–560 CrossRef CAS.
- P. Forzatti, I. Nova and E. Tronconi, Angew. Chem., 2009, 121, 8516–8518 CrossRef PubMed.
- P. G. Smirniotis, D. A. Pena and B. S. Uphade, Angew. Chem., Int. Ed., 2001, 40, 2479–2482 CrossRef CAS.
- P. G. W. A. Kompioa, A. Brückner, F. Hipler, G. Auer, E. Löffler and W. Grünert, J. Catal., 2012, 286, 237–247 CrossRef PubMed.
- M. H. Groothaert, K. Lievens, H. Leeman, B. M. Weckhuysen and R. A. Schoonheydt, J. Catal., 2003, 220, 500–512 CrossRef CAS PubMed.
- P. J. Smeets, M. H. Groothaert, R. M. Teeffelen, H. Leeman, E. J. M. Hensen and R. A. Schoonheydt, J. Catal., 2007, 245, 358–368 CrossRef CAS PubMed.
- C. Shi, Y. Y. Ji, U. M. Graham, G. Jacobs, M. Crocker, Z. S. Zhang, Y. Wang and T. J. Toops, Appl. Catal., B, 2012, 119–120, 183–196 CrossRef CAS PubMed.
- D. H. Lee, K. T. Kim, H. S. Kang, Y. H. Song and J. E. Park, Environ. Sci. Technol., 2013, 47, 10964–10970 CrossRef CAS PubMed.
- R. Q. Long and R. T. Yang, J. Am. Chem. Soc., 1999, 121, 5595–5596 CrossRef CAS.
- G. S. Qi and R. T. Yang, Appl. Catal., B, 2003, 44, 217–225 CrossRef CAS.
- R. H. Gao, D. S. Zhang, X. G. Liu, L. Y. Shi, P. Maitarad, H. R. Li, J. P. Zhang and W. G. Cao, Catal. Sci. Technol., 2013, 3, 191–199 CAS.
- H. L. Li, D. S. Zhang, P. Maitarad, L. Y. Shi, R. H. Gao, J. P. Zhang and W. G. Cao, Chem. Commun., 2012, 48, 10645–10647 RSC.
- L. Zhang, L. Y. Shi, L. Huang, J. P. Zhang, R. H. Gao and D. S. Zhang, ACS Catal., 2014, 4, 1753–1763 CrossRef CAS.
- X. L. Mou, B. S. Zhang, Y. Li, L. D. Yao, X. J. Wei, D. S. Su and W. J. Shen, Angew. Chem., Int. Ed., 2012, 51, 2989–2993 CrossRef CAS PubMed.
- R. Q. Long and R. T. Yang, J. Catal., 1999, 188, 332–339 CrossRef CAS.
- A. Z. Ma and W. Grunert, Chem. Commun., 1999, 71–72 RSC.
- G. S. Qi and R. T. Yang, Catal. Lett., 2005, 100, 243–246 CrossRef CAS PubMed.
- M. Schwidder, M. S. Kumar, K. Klementiev, M. M. Pohl, A. Bruckner and W. Grunert, J. Catal., 2005, 231, 314–330 CrossRef CAS PubMed.
- S. Brandenberger, O. Krocher, A. Tissler and R. Althoff, Appl. Catal., B, 2010, 95, 348–357 CrossRef CAS PubMed.
- T. Zhang, J. Liu, D. X. Wang, Z. Zhao, Y. C. Wei, K. Cheng, G. Y. Jiang and A. J. Duan, Appl. Catal., B, 2014, 148–149, 520–531 CrossRef CAS PubMed.
- P. Balle, B. Geiger and S. Kureti, Appl. Catal., B, 2009, 85, 109–119 CrossRef CAS PubMed.
- P. Balle, B. Geiger, D. Klukowski, M. Pignatelli, S. Wohnrau, M. Menzel, I. Zirkwa, G. Brunklaus and S. Kureti, Appl. Catal., B, 2009, 91, 587–595 CrossRef CAS PubMed.
- G. Neri, A. M. Visco, S. Galvagno, A. Dunato and M. Panzalorto, Thermochim. Acta, 1999, 329, 39–46 CrossRef CAS.
- R. Q. Long and R. T. Yang, J. Catal., 2002, 207, 158–165 CrossRef CAS.
- Y. Shu, H. Sun, X. Quan and S. Chen, J. Phys. Chem. C, 2012, 116, 25319–25327 CAS.
- C. Fang, D. Zhang, L. Shi, R. Gao, H. Li, L. Ye and J. Zhang, Catal. Sci. Technol., 2013, 3, 803–811 CAS.
- H. Chang, J. D. Lee, S. M. Lee and Y. H. Lee, Appl. Phys. Lett., 2001, 79, 3863–3865 CrossRef CAS PubMed.
- R. Q. Long and R. T. Yang, Ind. Eng. Chem. Res., 2001, 40, 4288–4291 CrossRef CAS.
- S. Santucci, S. Picozzi, F. D. Gregorio, L. Lozzi, C. Cantalini, L. Valentini, J. M. Kenny and B. Delley, J. Chem. Phys., 2003, 119, 10904–10910 CrossRef CAS PubMed.
- J. Z. Luo, L. Z. Gao, Y. L. Leung and C. T. Au, Catal. Lett., 2000, 66, 91–97 CrossRef CAS.
- Z. Zeng, P. Lu, C. T. Li, L. Mai, Z. Li and Y. S. Zhang, Catal. Sci. Technol., 2012, 2, 2188–2199 CAS.
- S. L. Bai, J. H. Zhao, W. Li and Z. P. Zhu, Catal. Today, 2010, 158, 393–400 CrossRef CAS PubMed.
- Z. X. Ma, H. S. Yang, Q. Li, J. W. Zheng and X. B. Zhang, Appl. Catal., A, 2012, 427–428, 43–48 CrossRef CAS PubMed.
- B. C. Huang, R. Huang, D. J. Jin and D. Q. Ye, Catal. Today, 2007, 126, 279–283 CrossRef CAS PubMed.
- J. Z. S. Bai, L. Wang and Z. Zhu, Ranliao Huaxue Xuebao, 2009, 37, 583–587 Search PubMed.
- E. C. Vermisoglou, G. E. Romanos, G. N. Karanikolos and N. K. Kanellopoulos, J. Hazard. Mater., 2011, 194, 144–155 CrossRef CAS PubMed.
- X. Y. Fan, F. M. Qiu, H. S. Yang, W. Tian, T. F. Hou and X. B. Zhang, Catal. Commun., 2011, 12, 1298–1301 CrossRef CAS PubMed.
- S. Q. Song and S. J. Jiang, Appl. Catal., B, 2012, 117–118, 346–350 CrossRef CAS PubMed.
- D. S. Zhang, L. Zhang, L. Y. Shi, C. Fang, H. R. Li, R. H. Gao, L. Huang and J. P. Zhang, Nanoscale, 2013, 5, 1127–1136 RSC.
- J. D. Xu, K. T. Zhu, X. F. Weng, W. Z. Weng, C. J. Huang and H. L. Wan, Catal. Today, 2013, 215, 86–94 CrossRef CAS PubMed.
- Q. Li, H. S. Yang, F. M. Qiu and X. B. Zhang, J. Hazard. Mater., 2011, 192, 915–921 CrossRef CAS PubMed.
- Z. X. Ma, H. S. Yang, F. Liu and X. B. Zhang, Appl. Catal., A, 2013, 467, 450–455 CrossRef CAS PubMed.
- D. S. Zhang, L. Zhang, L. Y. Shi, C. Fang, H. R. Li, R. H. Gao, L. Huang and J. P. Zhang, RSC Adv., 2013, 3, 8811–8819 RSC.
- B. Tang, G. X. Hu and H. Y. Gao, Appl. Spectrosc. Rev., 2010, 45, 369–407 CrossRef CAS.
- L. M. Malard, M. A. Pimenta, G. Dresselhaus and M. S. Dresselhaus, Phys. Rep., 2009, 473, 51–87 CrossRef CAS PubMed.
- Y. F. Hao, Y. Y. Wang, L. Wang, Z. H. Ni, Z. Q. Wang, R. Wang, C. K. Koo, Z. X. Shen and J. T. L. Thong, Small, 2010, 6, 195–200 CrossRef CAS PubMed.
- A. Gupta, G. Chen, P. Joshi, S. Tadigadapa and P. C. Eklund, Nano Lett., 2006, 6, 2667–2673 CrossRef CAS PubMed.
- X. J. Wang, J. Lu, Y. Xie, G. A. Du, Q. X. Guo and S. Y. Zhang, J. Phys. Chem. B, 2002, 106, 933–937 CrossRef CAS.
- L. Zhang, Z. Jia, L. M. Huang, S. O'Brien and Z. H. Yu, J. Phys. Chem. C, 2007, 111, 11240–11245 CAS.
- M. S. Dresselhaus, G. Dresselhaus and A. Jorio, J. Phys. Chem. C, 2007, 111, 17887–17893 CAS.
- S. L. Chou, J. Z. Wang, Z. X. Chen, H. K. Liu and S. X. Dou, Nanotechnology, 2011, 22, 265401 CrossRef PubMed.
- T. Yamashita and P. Hayes, Appl. Surf. Sci., 2008, 254, 2441–2449 CrossRef CAS PubMed.
- S. J. Yang, C. Z. Wang, L. Ma, Y. Peng, Z. Qu, N. Q. Yan, J. H. Chen, H. Z. Chang and J. H. Li, Catal. Sci. Technol., 2013, 3, 161–168 CAS.
- M. Kang, E. D. Park, J. M. Kim and J. E. Yie, Appl. Catal., A, 2007, 327, 261–269 CrossRef CAS PubMed.
- P. Maitarad, D. S. Zhang, R. H. Gao, L. Y. Shi, H. R. Li, L. Huang, T. Rungrotmongkol and J. P. Zhang, J. Phys. Chem. C, 2013, 117, 9999–10006 CAS.
- S. X. Cai, D. S. Zhang, L. Y. Shi, J. Xu, L. Zhang, L. Huang, H. R. Li and J. P. Zhang, Nanoscale, 2014, 6, 7346–7353 RSC.
- B. Guan, H. Lin, L. Zhu and Z. Huang, J. Phys. Chem. C, 2011, 115, 12850–12863 CAS.
- S. X. Cai, D. S. Zhang, L. Y. Shi, J. Xu, L. Zhang, L. Huang, H. R. Li and J. P. Zhang, Catal. Sci. Technol., 2014, 4, 93–101 CAS.
- L. Zhang, D. S. Zhang, J. P. Zhang, S. X. Cai, C. Fang, L. Huang, H. R. Li, R. H. Gao and L. Y. Shi, Nanoscale, 2013, 5, 9821–9829 RSC.
Footnote |
| † Electronic supplementary information (ESI) available: TEM images of Fe2O3/CNTs-IM, Fe2O3/CNTs-CP, Fe2O3/TiO2; XRD patterns of the samples; nitrogen adsorption–desorption isotherm, H2-TPR, NH3-TPD profiles and NO conversion vs. temperature over the Fe2O3/TiO2, and Raman spectrum of CNTs. See DOI: 10.1039/c4cy00789a |
| This journal is © The Royal Society of Chemistry 2015 |

