Rational design of MoS2 catalysts: tuning the structure and activity via transition metal doping†
Charlie
Tsai
ab,
Karen
Chan
ab,
Jens K.
Nørskov
ab and
Frank
Abild-Pedersen
*b
aDepartment of Chemical Engineering, Stanford University, Stanford, California 94305, USA
bSUNCAT Center for Interface Science and Catalysis, SLAC National Accelerator Laboratory, 2575 Sand Hill Road, Menlo Park, California 94025, USA. E-mail: abild@slac.stanford.edu
First published on 24th September 2014
Abstract
Density functional theory was used to study how transition metal doping could be used as a method for systematically fine-tuning the structure and activity of MoS2 catalysts. Through studying the hydrogen evolution reaction (HER) on the edge sites, the role of the metal dopant was determined to be in modifying the strength of sulfur binding on the edge, which determines hydrogen binding onto sulfur atoms on the edge through a negative linear scaling. A simple thermodynamic quantity, ΔGS, is thus identified, which allows for a description of both the stable structure and adsorption at the edge sites. This provides a descriptor-based framework for the rational design of new MoS2-type catalysts, where a metal dopant can be chosen to either strengthen or weaken the binding of key intermediates as desired. We also elucidate the unique coverage dependence of hydrogen binding, which explains why MoS2-type catalysts tend to have near-optimal hydrogen binding. These results are expected to be more general and easily extended to other reactions on other layered transition metal dichalcogenides. Besides confirming the high HER activity of previously studied MoS2 catalysts, we find 6 additional candidates that show marked improvement in hydrogen adsorption free energies over pristine MoS2.
Introduction
Two-dimensional layered transition metal dichalcogenides such as MoS2 have been gaining increased interest as a class of inexpensive electrocatalysts due to their unique chemical and physical properties resulting from their low-dimensionality.1–4 Single layered MoS2 was first predicted by theory5 and then shown in a number of experimental studies to be active for the hydrogen evolution reaction (HER) with activity better than most non-precious metals.3–12 The increased activity of nano-structured MoS2 compared to the inert bulk has been shown to arise from the metallic states located at the edge sites of the monolayer nanoparticles.1,6,13–18 Nanostructured MoS2 has further been suggested19 and subsequently proven20 as being active for electrochemical CO2 reduction due to the unique scaling of adsorption energies between key reaction intermediates on the edges.In light of the wide range of possible applications for MoS2 catalysts, it is desirable to develop a set of guidelines for rationally designing a new generation of MoS2-based catalysts, optimized for new sets of reactions. Transition metal doping into the S-edge of MoS2 has been demonstrated as one method for modifying the edge site activity in both the hydrodesulfurization reaction21–23 and HER.1,5,9,24 Since the Mo-edge has been predicted to be the active edge for HER,5 doping is thought to improve the HER activity by modifying H binding on the S-edge.
Although several detailed theoretical studies21,25–28 have already been conducted, they have largely been limited to a few first row transition metal dopants, which is still insufficient for a broad understanding of how transition metals could modify the structure and activity of MoS2, particularly in the context of designing new catalysts. A systematic screening of transition metal dopants would provide an explanation of the general effects of doping and what the potentials and limitations are in using doped MoS2 catalysts for other reactions. Simple descriptors for the trends would also provide guidelines for choosing a specific dopant metal.
In this study, we present a density functional theory (DFT) study of 19 transitional metal-doped (Ag, Au, Cu, Co, Cr, Fe, Ir, Mn, Ni, Nb, Os, Pd, Pt, Ta, Re, Rh, Ru, V, W) MoS2 catalysts. Using HER as a case study, we show that the expected activity can be continuously tuned over a wide range of binding energies through doping. We confirm that previously established MoS2-type catalysts are active, and propose 6 new candidates that should exhibit improved HER activity over MoS2 and most pure metal catalysts. Using a simple thermodynamic descriptor, we establish a negative linear scaling relationship between the characteristic binding strength of the edge S on the metal and the adsorption onto the S, which provides a general description of the trends in structure and activity on the edge.
Theoretical approach
We have chosen HER as a model reaction because there is now a rich body of literature for HER on MoS2-based catalysts. Furthermore, the strength of hydrogen binding on the edge can act as a simple probe for chemical activity since the hydrogen binding is known to scale with that of other key reaction intermediates.29 HER proceeds as 2H+ + 2e− → H2, where hydrogen is bound onto an active site (*) in the first step via H+ + e− → H(*). The hydrogen adsorption free energy was thus determined to be an accurate descriptor of HER activity over transition metal catalysts, with an optimal binding energy of ΔGH = 0 eV leading to the highest activity.30–32 This descriptor-based approach using ΔGH was then extended to transition metal alloys,33 and used to predict the high activity of edge sites on MoS2,5,6 confirm trends in HER activity on transition metal selenides,34 and predict trends in HER activity on transition metal carbides.35 Due to the largely successful application of the ΔGH descriptor beyond pure transition metals, we also use the hydrogen adsorption free energy, ΔGH, as an indicator of HER activity in this study. A detailed kinetic analysis of the hydrogen evolution reaction is outside the scope of the present work.Location and concentration of metal dopants
Since we are primarily interested in the trends and developing a general understanding, we focus on the S-edge with 100% of the edge-most Mo atoms substituted by the metal dopant. The reasons for this approximation are: (1) experimentally, Fe, Co, Ni, and Cu doped MoS2 catalysts have been shown to preferentially substitute at the S-edge with 100% replacement of the Mo atom in many cases;16–18 (2) previous studies on doped MoS2 clusters37,38 have showed that the S-edge is generally less stable and more prone to doping than the Mo-edge, in agreement with detailed scanning tunneling microscopy studies.23 Hence, even when the Mo-edge is doped, the doped S-edge is expected to also be present. Nevertheless, since partial doping of the S-edge as well as doping of the Mo-edge have been observed,21,28 we will return to the implications of these issues within the context of our results later on. We also do not consider the effects of doping into the basal plane in this study.Determining the stable edge structures
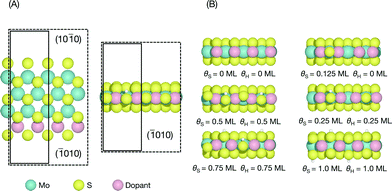
The edge structures of MoS2 are known to be highly dependent on synthesis and reaction conditions,1,21,22,38 making it crucial to consider the relevant conditions in order to accurately describe adsorption and reactivity.39 In this study, we follow a method reported recently for determining the stable edge structures.19,34An infinite stripe model1,5,13,14 was used to investigate the S-edge (shown in Fig. 1A). In the infinite stripe, the Mo-edge and the S-edge are both exposed; however, when studying the S-edge, the exact configuration of the Mo-edge is unimportant so long as it is kept constant.
The coverage of H is defined as a fraction of a monolayer with respect to the number of available S atoms on the edge,
| θH(ML) = nH/(S atom) | (1) |
| θs(ML) = nS/(2 × edge length) | (2) |
For each doped S-edge, we considered S coverages of θS = 0, 0.125, 0.25, 0.5, 0.75, and 1.0 ML and H coverages of θH = 0, 0.25, 0.5, 0.75, 1.0 ML for each S coverage. Examples of each S and H coverage are shown in Fig. 1B. Both metal and S sites were considered at the edge and the H atom was found to preferentially adsorb onto the edge-most S sites and furthest away from an already adsorbed H, even for the cases where there are S vacancies. In principle, both S and H coverages could vary almost continuously in the ranges considered, but the intermediate coverages to the ones considered here would require large unit cell sizes that are computationally prohibitive.
Using the calculated energies of the infinite stripes with each possible configuration, the free energy of the edge γ was then determined by,
 | (3) |
| 2(H+ + e−) + S(*) ⇌ H2S + (*) | (4) |
| H + e− ⇌ H | (5) |
 | (6) |
 | (7) |
Since we are interested in the region of low overpotential, we first take the most thermodynamically stable edge configuration at URHE = 0 V, then we assume that the steady state hydrogen coverage is where H2 evolution of the final adsorbed hydrogen is more exergonic than either the desorption of HS as H2S or further H adsorption. This analysis has been used and thoroughly discussed in previous studies as well.1,19,22,34 Additional details and a table of the stable structures are included in the ESI.†
In reality, the coverage at URHE < 0 V would be determined by kinetics, since the pressure of H2S should be negligible and yet MoS2 catalysts have been shown to be remarkably stable through potential cycling.8,43 However, since activation energies of surface reactions are known to scale with adsorption energies,44,45 we use thermodynamic quantities as an approximation. Our focus is on extracting general guidelines from the trends, so a detailed analysis of the kinetic barriers involved would be outside the scope of this study.
Calculation details
All results were calculated using plane-wave DFT employing ultrasoft-pseudopotentials. The QUANTUM ESPRESSO code46 and the BEEF-vdW exchange-correlation functional47–50 were used for all calculations. Recent studies have shown that hydrogen adsorption free energies of MoS2 calculated using the BEEF-vdW functional agree with those calculated using the RPBE functional previously.5,51 The bulk lattice constants for MoS2 were determined to be a = 3.19 Å and c = 13.05 Å. Due to the inclusion of van der Waals interactions, both lattice constants are in reasonable agreement with experimental values of a = 3.16 Å and c = 12.29 Å.21,52,53 The plane-wave cutoff and density cutoff were 500 eV and 5000 eV respectively. Further calculation details are summarized in the ESI.†Results and discussion
Trends in the structure and activity
Doping significantly alters the S and H coverages of the S-edge structure (summarized in Fig. 2). There is a general correspondence between the reactivity of the pure transition metal54 used for doping and the resulting S coverage at the S-edge (θS) (Fig. 2A). The noble metal dopants (group 11 metals) have the smallest θS, the more reactive metal dopants (group 8 through group 10 metals) have higher θS, and the most reactive metal dopants (group 5 through group 7 metals) have the highest θS. Within each θS, the more reactive dopants generally have smaller θH and the more noble dopants have higher θH (H coverage increases towards the right of the periodic table). From the edge structures, we observe a general compensation effect between adsorption of S on the metal and the adsorption of H on the S; stronger binding metals have larger S coverages but also smaller H coverages. The effect of transition metal substitution then appears to be in modifying the binding strength of S on the edge (reflected in the S coverage), and in turn, modifying how strongly the H is bound (reflected in the H coverage).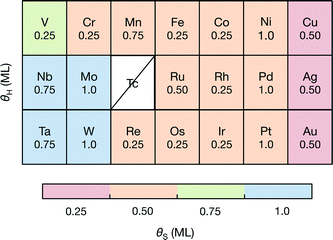 | ||
| Fig. 2 The variation in S coverage (θS) and H coverage (θH) at the S-edge with choice of dopant metal in the periodic table. The S coverages are indicated by the color and the H coverages are shown in the table. Details of the structural determination and the geometries of the structures are provided in the ESI.† | ||
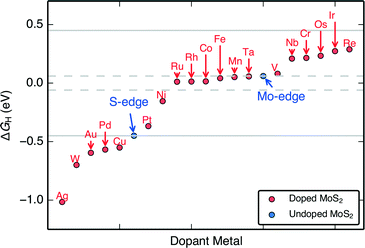
The H adsorption free energies on the doped edges (ΔGH) of MoS2 are almost continuously tuned over a range of approximately −1.0 eV to 0.3 eV (Fig. 3). These differential H adsorption free energies were calculated for the final adsorbed H at the stable S and H coverages indicated in Fig. 2. For HER, we find 14 doped structures that have ΔGH closer to thermo-neutral than the S-edge (Pt, Ni, Ru, Rh, Co, Fe, Mn, Ta, V, Nb, Cr, Os, Ir, and Re) and among them, 6 doped structures (Ru, Rh, Co, Fe, Mn, Ta) that have ΔGH closer to thermo-neutral than the already HER active undoped MoS2 Mo-edge. Our results confirm the experimentally proven Fe, Ni, and Co-doped MoS2 S-edges that show improved HER activity over pristine MoS2,9,24 which indicates that our approach of using a single thermodynamic descriptor, ΔGH, is reasonable.
Understanding the role of the dopant in modifying adsorption
To understand how the dopant modifies the stability of S on the edge metal relative to the reactivity of the S atom, we employ a thermodynamic descriptor of the characteristic S–metal binding onto the edge. Here we have chosen the adsorption free energy of a single S atom onto the bare metal edge ΔGS (equivalent to a sulfur coverage of θS = 0.125 ML. Refer to Fig. 1A). This is analogous to the bulk cohesive energy per metal-sulfur bond that was proposed by Toulhoat et al.,25,55,56 and was successfully used as a descriptor for activity on a variety of bulk transition metal sulfides. Our ΔGS is instead an indicator of the characteristic S–metal bond strength on the edge. We also choose the H adsorption energy onto the single S atom, ΔGH–S, as a descriptor for the characteristic H binding onto the S (hereafter referred to as the characteristic H–S binding). Although the edge structure where ΔGS is defined is highly unstable under HER conditions, it provides a fixed reference for comparing the variation in S binding on the doped edges. In using only a single S atom, the energetic contribution from structural rearrangements is also minimized, as the rearrangements often result from interactions between neighboring S atoms51,57 (see ESI† for all structures and coverages considered herein).When the S coverages, θS, are shown as a function of the S–metal adsorption free energy on the edge, ΔGS, (Fig. 4), the descriptor for S–metal binding on the edge (ΔGS) is shown to successfully describe the trends in the stable edge structure. The doped edges with the strongest S–metal binding (most negative ΔGS) have the highest S coverage whereas those with the weakest S–metal binding (most positive ΔGS) have the lowest S coverage. Generally, nobler metals (such as Ag) have the weakest S binding and more reactive metals (such as W) have the strongest S binding. This is in agreement with previous studies that have found the trend in S–metal bond strength for a doped edge to be Mo > Co > Ni > Cu.21,37 In reality, the stable coverages could also be one of the more intermediate S coverages not sampled in this study, and the dependence of θS on ΔGS is expected to be more continuous.
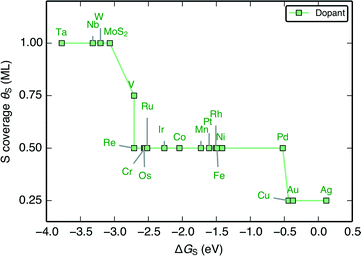 | ||
| Fig. 4 The stable S coverage at the edge θS as a function of the S–metal adsorption free energy on the edge ΔGS. | ||
When the characteristic H–S binding on the edge ΔGH–S is plotted as a function of ΔGS (Fig. 5A), there is a negative linear relationship between the two descriptors, which suggests that there is a compensation effect at play here: stronger S–metal binding should lead to weaker H–S binding. The linear scaling suggests that the characteristic H–S binding energy is entirely determined by how strongly the S–metal binding is, which sets a limit in how the two can be varied with respect to each other. In this way, the dopant metal plays a central role in mediating the binding of adsorbates onto S.
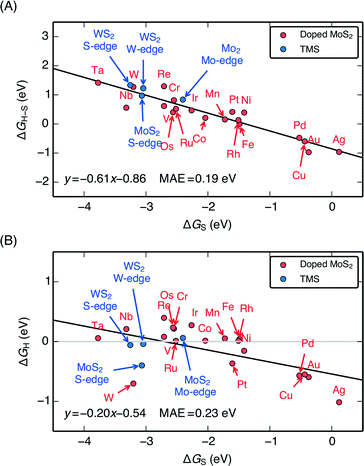 | ||
| Fig. 5 (A) Plot of the characteristic H–S binding energy (ΔGH–S) on the S site as a function of the characteristic S–metal binding energy (ΔGS) on the metal site. Weaker S binding to the metal corresponds to stronger H binding to the S. ΔGS corresponds to a single S adsorbed onto the bare metal edge, whereas ΔGH–S corresponds to a single H bound onto that S (equivalent to θS = 0.125 ML and θH = 0.125 ML, the lowest possible coverages); both doped MoS2 and pure transition metal sulfides (TMS) are shown (B) Plot of differential H adsorption free energy at the stable coverages for each doped edge (ΔGH) as a function of the characteristic S–metal adsorption free energy at the edge, ΔGS (same as in A). ΔGS acts as a descriptor for the H binding at the various stable coverages. The gray line indicates where ΔGH = 0 eV. The mean absolute errors (MAE) are ≈0.2 eV, which is approximately the error of DFT calculations for adsorption energies. This is reasonable considering that edge reconstruction13,34 also contributes greatly to the scatter (additional details in the ESI†). | ||
Plotting the hydrogen adsorption free energy for the stable structures under reaction conditions (ΔGH) as a function of ΔGS, we find that the ΔGS extends beyond the simple compensation effect with ΔGH–S and is also able to describe hydrogen adsorption at the various S and H coverages. Since ΔGH is used as a descriptor for the HER activity of the catalyst, the HER activity would then be entirely determined by how strongly the dopant metal binds S on the edge. The trends are preserved between Fig. 6A and B because higher S coverages simply lead to an overall weakening of the S–metal binding, which in turn strengthens the H–S binding. This effect simply decreases the slope of the line in Fig. 5A. The success of ΔGS in describing the trends at the stable coverage suggests that although the correct coverage is crucial in accurately determining the ΔGH for a given doped edge, the trends are relatively insensitive to the exact coverages. This means that ΔGS can act as a descriptor for the trends in binding strength on the doped edges regardless of the target reaction conditions. This leads to a general guideline for tuning the reactivity of MoS2: a stronger binding metal dopant leads to weaker adsorbate binding on the S, and a more noble metal dopant will lead to stronger adsorbate binding on the S.
Note that the existence of S vacancies for some of the doped edges and the possibility of H biding on the metal does not pose a problem for the scaling lines, since hydrogen preferentially binds to the S in those cases. The edges with lower S coverage at the same conditions indicate weaker binding directly to the metal, which corresponds to stronger and preferred binding to the S. This is indeed what our results show (stable structures shown in the ESI†).
The ΔGH–S and ΔGH values for both the pristine S-edge and the pristine M-edge on MoS2 and WS2 (values taken from previous studies) scale alongside the doped MoS2 S-edges, which suggests the negative linear correlation between ΔGS and ΔGH is general for transition metal sulfide edges, regardless of the exact local structure. Values of ΔGS in the range of −4 eV to −2 eV display the most thermo-neutral ΔGH. Out of all the doped structures, this represents the region where S is bound the most strongly, and hence, where it is the most stable against desorption as H2S. The optimal doped MoS2 HER catalysts are thus also expected to be the most stable ones under reaction conditions. Spread in the data results from reconstruction of the S atoms in the edge upon H adsorption, which is especially pronounced for the S-edge of pristine WS2 and MoS2, which have a full coverage of S-dimers at the edge at θS = 1.0 ML. This phenomena as well as its energetic contributions have been discussed in detail previously.51,57 Further information related to edge reconstruction is included in the ESI.†
Although we have focused on the 100% doped S-edge so far, the simple picture formulated by the thermodynamic descriptor ΔGS could easily be extended to systems where there is partial doping of the S-edge or doping on the Mo-edge. Since both edges appear to follow the same scaling lines for ΔGSvs. ΔGH, metal dopants that bind S stronger or weaker than Mo should also shift up or down the scaling line, respectively. Similarly, partial doping of either edge by a transition metal should simply lead to ΔGS that is intermediate between the pristine MoS2 edge and that of the 100% transition metal doped edge. Indeed, it has been previously reported that when the concentration of Co dopants is varied, the S–metal binding strength should vary continuously between the pure MoS2 S-edge and the Co-doped S-edge.21
We also note that although the lowest energy configuration of hydrogen was always found to be on a sulfur site, other key reaction intermediates could bind directly to the metal instead, even without the presence of a vacancy. This was shown previously for CO adsorption onto Ni-doped MoS2 for the electrochemical reduction of CO2.19 For such cases ΔGS would be expected to directly describe the binding strength of the adsorbate, instead of indirectly through the sulfur binding. This then presents an additional compensation effect where the strengthening of one reaction intermediate on the S could lead to the weakening of another reaction intermediate on the metal.
The hydrogen coverage dependence of ΔGH
The change in the differential H adsorption free energy (ΔGH) as a function of the H coverage (Fig. 6) sheds light on why a large portion of the doped MoS2 catalysts is predicted to be active HER catalysts. Unlike transition metal surfaces,58 the differential energy of H adsorption changes significantly with increasing coverage even before reaching a full monolayer. The reason for this is that for the doped MoS2 edges, the weakening in H binding results partly from reorganization of the S atoms at the edge upon H adsorption51,57 rather than just adsorbate–adsorbate repulsion (some more information in the ESI†). As long as ΔGH of the first H on the edge is slightly below 0 eV, the ΔGH at subsequently higher coverages will approach or cross thermo-neutral. This is shown for the pristine Mo-edge, and the Mn, Ni, Nb, and Re doped S-edges in Fig. 6. Similar to the transition metals, the coverage effect is more pronounced for surfaces with weaker binding. For doped edges that bind H too strongly (Pd doped MoS2 for example), ΔGH will be far from thermo-neutral even at the highest coverage, whereas for doped edges that bind H too weakly (Re doped MoS2 for example), the higher coverages will only have H binding that is further weakened. The majority of doped edges fall somewhere in between and have some coverage of H where ΔGH is within 0.2 eV from thermo-neutral.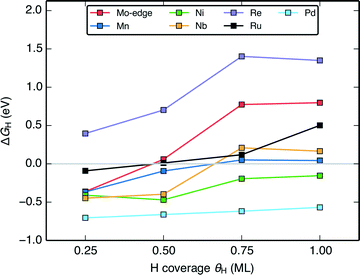 | ||
| Fig. 6 Plot of the variation of the differential H adsorption free energy (ΔGH) with respect to H coverage (θH) of several doped MoS2 S-edges. The gray line indicates where ΔGH = 0 eV. | ||
This presents an important caveat for the design of MoS2 catalysts for other electrochemical reactions where HER is an unwanted competing reaction. The favourable range of ΔGH for MoS2 based catalysts could mean that HER will present issues for selectivity.
Conclusions
In summary, DFT calculations have been used to investigate the trends in the structure and reactivity of doped MoS2, where it was found that a wide range of H and S coverages could be achieved. We showed that ΔGH can almost be continuously tuned to create an optimal catalyst for HER. Through the negative scaling between ΔGS (the characteristic S–metal binding at the edge) and ΔGH, we provide an explanation for the variation: promoting the S-edge with a more reactive metal will lead to weaker H binding, and a less reactive metal will lead to stronger H binding. The success of the ΔGS descriptor highlights the central role of the edge-most metal in determining structure and activity. Our results provide a simple descriptor-based guideline for the design of MoS2 catalysts where the dopant metal is chosen to weaken or strengthen key intermediates. We have shown previously that the negative linear scaling between chalcogen (S or Se) binding and H binding on the edge is general for several transition metal dichalcogenides,34 so the concepts developed here could be easily extended for the design of these other catalysts. Furthermore, since the adsorption of H has been shown to scale with the adsorption of other key reaction intermediates, our results can also be extended to other reactions.Detailed calculations involving the reaction barriers would be necessary to further validate the trends in HER activity. Future efforts will focus on elucidating the specific reaction mechanism for HER (either Volmer–Tafel or Volmer–Heyrovsky) on layered transition metal sulfides in general. This will be necessary in confirming our approach in screening the activity of these catalysts using the free energy of hydrogen adsorption ΔGH.
The scaling of ΔGH and ΔGS on doped MoS2 along with other layered transition metal sulfides also suggests that the compensation effect between the binding on the metal and on the S could be a general feature for these materials. The linear scaling relations suggest that certain features of the electronic structure could be exploited in order to further understand the reactivity of transition metal sulfides. Since ΔGH is determined through ΔGS, it is plausible that the d-states of the edge-most transition metal simultaneously determine the S coverage (through the S binding strength on the edge) as well as the adsorption properties onto S sites. However, the binding energies at the edge are often coupled to geometric rearrangements of the edge S atoms upon H adsorption1,51,57 and the various S and H coverages, which add an additional layer of complexity to the search. These ideas will be explored in future work.
Acknowledgements
We acknowledge support from the Center on Nanostructuring for Efficient Energy Conversion (CNEEC) at Stanford University, an Energy Frontier Research Center funded by the U.S. Department of Energy, Office of Basic Energy Sciences under award number DE-SC0001060. F.A.-P. and J.K.N acknowledge financial support from the U.S. Department of Energy (DOE), Office of Basic Energy Sciences to the SUNCAT Center for Interface Science and Catalysis. C.T. acknowledges support from the National Science Foundation Graduate Research Fellowship Program (GRFP) grant DGE-114747. K.C. acknowledges support from the Air Force Office of Scientific Research through the MURI program under AFOSR award no. FA9550-10-1-0572.Notes and references
- M. V. Bollinger, K. W. Jacobsen and J. K. Nørskov, Phys. Rev. B: Condens. Matter Mater. Phys., 2003, 67, 085410 CrossRef.
- M. Chhowalla, H. S. Shin, G. Eda, L.-J. Li, K. P. Loh and H. Zhang, Nat. Chem., 2013, 5, 263–275 CrossRef PubMed.
- H. Wang, H. Feng and J. Li, Small, 2014, 10, 2165–2181 CrossRef CAS PubMed.
- J. Yang and H. S. Shin, J. Mater. Chem. A, 2014, 2, 5979–5985 CAS.
- B. Hinnemann, P. G. Moses, J. L. Bonde, K. P. Jørgensen, J. H. Nielsen, S. Horch, I. Chorkendorff and J. K. Nørskov, J. Am. Chem. Soc., 2005, 127, 5308–5309 CrossRef CAS PubMed.
- T. F. Jaramillo, K. P. Jørgensen, J. L. Bonde, J. H. Nielsen, S. Horch and I. Chorkendorff, Science, 2007, 317, 100–102 CrossRef CAS PubMed.
- Y. Li, H. Wang, L. Xie, Y. Liang, G. Hong and H. Dai, J. Am. Chem. Soc., 2011, 133, 7296–7299 CrossRef CAS PubMed.
- J. Kibsgaard, Z. Chen, B. N. Reinecke and T. F. Jaramillo, Nat. Mater., 2012, 11, 963–969 CrossRef CAS PubMed.
- J. L. Bonde, P. G. Moses, T. F. Jaramillo, J. K. Nørskov and I. Chorkendorff, Faraday Discuss., 2008, 140, 219 RSC.
- A. B. Laursen, S. Kegnæs, S. Dahl and I. Chorkendorff, Energy Environ. Sci., 2012, 5, 5577–5591 CAS.
- Z. Chen, A. J. Forman and T. F. Jaramillo, J. Phys. Chem. C, 2013, 117, 9713–9722 CAS.
- H. I. Karunadasa, E. Montalvo, Y. Sun, M. Majda, J. R. Long and C. J. Chang, Science, 2012, 335, 698–702 CrossRef CAS PubMed.
- L. S. Byskov, J. K. Nørskov, B. S. Clausen and H. Topsøe, J. Catal., 1999, 187, 109–122 CrossRef CAS.
- M. V. Bollinger, J. V. Lauritsen, K. W. Jacobsen, J. K. Nørskov, S. Helveg and F. Besenbacher, Phys. Rev. Lett., 2001, 87, 196803 CrossRef CAS.
- J. Kibsgaard, J. V. Lauritsen, E. Lægsgaard, B. S. Clausen, H. Topsøe and F. Besenbacher, J. Am. Chem. Soc., 2006, 128, 13950–13958 CrossRef CAS PubMed.
- S. Helveg, J. Lauritsen, E. Lægsgaard, I. Stensgaard, J. K. Nørskov, B. S. Clausen, H. Topsøe and F. Besenbacher, Phys. Rev. Lett., 2000, 84, 951–954 CrossRef CAS.
- L. S. Byskov, J. K. Nørskov, B. S. Clausen and H. Topsøe, Catal. Lett., 2000, 64, 95–99 CrossRef.
- J. V. Lauritsen, M. V. Bollinger, E. Lægsgaard, K. W. Jacobsen, J. K. Nørskov, B. S. Clausen, H. Topsøe and F. Besenbacher, J. Catal., 2004, 221, 510–522 CrossRef CAS PubMed.
- K. Chan, C. Tsai, H. A. Hansen and J. K. Nørskov, ChemCatChem, 2014, 6, 1899–1905 CrossRef CAS.
- M. Asadi, B. Kumar, A. Behranginia, B. A. Rosen, A. Baskin, N. Repnin, D. Pisasale, P. Phillips, W. Zhu, R. Haasch, R. F. Klie, P. Král, J. Abiade and A. Salehi-Khojin, Nat. Commun., 2014, 5, 4470 Search PubMed.
- P. Raybaud, J. Hafner, G. Kresse, S. Kasztelan and H. Toulhoat, J. Catal., 2000, 190, 128–143 CrossRef CAS.
- P. G. Moses, B. Hinnemann, H. Topsøe and J. K. Nørskov, J. Catal., 2009, 268, 201–208 CrossRef CAS PubMed.
- J. Kibsgaard, A. Tuxen, K. G. Knudsen, M. Brorson, H. Topsøe, E. Lægsgaard, J. V. Lauritsen and F. Besenbacher, J. Catal., 2010, 272, 195–203 Search PubMed.
- D. Merki, H. Vrubel, L. Rovelli, S. Fierro and X. Hu, Chem. Sci., 2012, 3, 2515–2525 RSC.
- H. Toulhoat, P. Raybaud, S. Kasztelan, G. Kresse and J. Hafner, Catal. Today, 1999, 50, 629–636 CrossRef CAS.
- A. Travert, H. Nakamura, R. A. van Santen, S. Cristol, J.-F. Paul and E. Payen, J. Am. Chem. Soc., 2002, 124, 7084–7095 CrossRef CAS PubMed.
- M. Sun, A. E. Nelson and J. Adjaye, Catal. Today, 2005, 105, 36–43 CrossRef CAS PubMed.
- E. Krebs, B. Silvi and P. Raybaud, Catal. Today, 2008, 130, 160–169 CrossRef CAS PubMed.
- C. Shi, H. A. Hansen, A. C. Lausche and J. K. Nørskov, Phys. Chem. Chem. Phys., 2014, 16, 4720–4727 RSC.
- S. Trasatti, J. Electroanal. Chem. Interfacial Electrochem., 1971, 33, 351–378 CrossRef CAS.
- R. Parsons, Trans. Faraday Soc., 1958, 54, 1053–1063 RSC.
- J. K. Nørskov, T. Bligaard, Á. Logadóttir, J. R. Kitchin, J. G. Chen, S. Pandelov and U. Stimming, J. Electrochem. Soc., 2005, 152, J23–J26 CrossRef PubMed.
- J. Greeley and M. Mavrikakis, Nat. Mater., 2004, 3, 810–815 CrossRef CAS PubMed.
- C. Tsai, K. Chan, F. Abild-Pedersen and J. K. Nørskov, Phys. Chem. Chem. Phys., 2014, 16, 13156–13164 RSC.
- R. Michalsky, Y.-J. Zhang and A. A. Peterson, ACS Catal., 2014, 1274–1278 CrossRef CAS.
- J. V. Lauritsen, J. Kibsgaard, G. H. Olesen, P. G. Moses, B. Hinnemann, S. Helveg, J. K. Nørskov, B. S. Clausen, H. Topsøe, E. Lægsgaard and F. Besenbacher, J. Catal., 2007, 249, 220–233 CrossRef CAS PubMed.
- H. Schweiger, P. Raybaud and H. Toulhoat, J. Catal., 2002, 212, 33–38 CrossRef CAS.
- H. Schweiger, P. Raybaud, G. Kresse and H. Toulhoat, J. Catal., 2002, 207, 76–87 CrossRef CAS.
- S. Cristol, J. F. Paul, E. Payen, D. Bougeard, S. Clemendot and F. Hutschka, J. Phys. Chem. B, 2002, 106, 5659–5667 CrossRef CAS.
- A. A. Peterson, F. Abild-Pedersen, F. Studt, J. Rossmeisl and J. K. Nørskov, Energy Environ. Sci., 2010, 3, 1311 CAS.
- M. Pourbaix, Atlas D'equilibres Electrochimiques, Gauthier-Villars, Paris, 1963 Search PubMed.
- H. A. Hansen, J. Rossmeisl and J. K. Nørskov, Phys. Chem. Chem. Phys., 2008, 10, 3722–3730 RSC.
- Z. Chen, D. Cummins, B. N. Reinecke, E. Clark, M. K. Sunkara and T. F. Jaramillo, Nano Lett., 2011, 11, 4168–4175 CrossRef CAS PubMed.
- Á. Logadóttir, T. H. Rod, J. K. Nørskov, B. Hammer, S. Dahl and C. Jacobsen, J. Catal., 2001, 197, 229–231 CrossRef.
- T. Bligaard, J. K. Nørskov, S. Dahl, J. Matthiesen, C. H. Christensen and J. Sehested, J. Catal., 2004, 224, 206–217 CrossRef CAS PubMed.
- P. Giannozzi, S. Baroni, N. Bonini, M. Calandra, R. Car, C. Cavazzoni, D. Ceresoli, G. L. Chiarotti, M. Cococcioni, I. Dabo, A. Dal Corso, S. de Gironcoli, S. Fabris, G. Fratesi, R. Gebauer, U. Gerstmann, C. Gougoussis, A. Kokalj, M. Lazzeri, L. Martin-Samos, N. Marzari, F. Mauri, R. Mazzarello, S. Paolini, A. Pasquarello, L. Paulatto, C. Sbraccia, S. Scandolo, G. Sclauzero, A. P. Seitsonen, A. Smogunov, P. Umari and R. M. Wentzcovitch, J. Phys.: Condens. Matter, 2009, 21, 395502 CrossRef PubMed.
- J. Wellendorff, K. T. Lundgaard, A. Møgelhøj, V. Petzold, D. D. Landis, J. K. Nørskov, T. Bligaard and K. W. Jacobsen, Phys. Rev. B: Condens. Matter Mater. Phys., 2012, 85, 235149 CrossRef.
- M. Dion, H. Rydberg, E. Schröder, D. C. Langreth and B. I. Lundqvist, Phys. Rev. Lett., 2004, 92, 246401 CrossRef CAS PubMed.
- T. Thonhauser, V. R. Cooper, S. Li, A. Puzder, P. Hyldgaard and D. C. Langreth, Phys. Rev. B: Condens. Matter Mater. Phys., 2007, 76, 125112 CrossRef.
- G. Román-Péréz and J. M. Soler, Phys. Rev. Lett., 2009, 103, 096102 CrossRef.
- C. Tsai, F. Abild-Pedersen and J. K. Nørskov, Nano Lett., 2014, 14, 1381–1387 CrossRef CAS PubMed.
- T. Böker, R. Severin, A. Müller, C. Janowitz, R. Manzke, D. Voß, P. Krüger, A. Mazur and J. Pollmann, Phys. Rev. B: Condens. Matter Mater. Phys., 2001, 64, 235305 CrossRef.
- F. Jellinek, G. Brauer and H. Müller, Nature, 1960, 185, 376–377 CrossRef CAS.
- B. Hammer and J. K. Nørskov, Surf. Sci., 1995, 343, 211–220 CrossRef CAS.
- H. Toulhoat and P. Raybaud, J. Catal., 2003, 216, 63–72 CrossRef CAS.
- N. Guernalec, C. Geantet, T. Cseri, M. Vrinat, H. Toulhoat and P. Raybaud, Dalton Trans., 2010, 39, 8420–8422 RSC.
- L. S. Byskov, M. V. Bollinger, J. K. Nørskov, B. S. Clausen and H. Topsøe, J. Mol. Catal. A: Chem., 2000, 163, 117–122 CrossRef CAS.
- E. Skúlason, V. Tripkovic, M. E. Björketun, S. Gudmundsdóttir, G. S. Karlberg, J. Rossmeisl, T. Bligaard, H. Jónsson and J. K. Nørskov, J. Phys. Chem. C, 2010, 114, 18182–18197 Search PubMed.
Footnote |
| † Electronic supplementary information (ESI) available: Detailed discussion of the methods used to determine the stable edge structure; the structures of all edge configurations considered in this study. See DOI: 10.1039/c4cy01162g |
| This journal is © The Royal Society of Chemistry 2015 |

