Crystallinity control of TiO2 hollow shells through resin-protected calcination for enhanced photocatalytic activity†
Hongyan
Liu
ab,
Ji Bong
Joo
ac,
Michael
Dahl
a,
Lishun
Fu
a,
Zhengzhi
Zeng
b and
Yadong
Yin
*a
aDepartment of Chemistry, University of California, Riverside, CA 92521, USA. E-mail: yadong.yin@ucr.edu
bKey Laboratory of Nonferrous Metal Chemistry and Resources Utilization of Gansu Province, College of Chemistry and Chemical Engineering, Lanzhou University, Lanzhou 730000, P. R. China. E-mail: liuhy2010@lzu.edu.cn
cGreenhouse Gas Laboratory, Korea Institute of Energy Research (KIER), Deajeon, 305-343, Republic of Korea
First published on 9th October 2014
Abstract
We report a novel resin-protected calcination process for preparing hollow TiO2 nanoshells with controllable crystallinity and phase. This method involves coating a template core with TiO2 and then a protection layer through sol–gel processes and then crystallization of the TiO2 shell by calcination. Through a systematic study on the crystallization behaviour of the TiO2 hollow shells with variation in core template and outer protection layer, we find that the grain growth and phase transformation of TiO2 is determined by several parameters such as the protection material, core composition, and calcination conditions. In particular, the use of a crosslinked polymer as the protection layer for calcination, enables the production of TiO2 shells with high crystallinity and controllable anatase–rutile mixed phases, which show significantly enhanced photocatalytic activity compared to those produced by SiO2-protected calcination. The photocatalytic activity could be further improved by improving the water dispersity of TiO2 shells through base treatment. With the ease of achieving photocatalytic activity comparable to commercial Degussa-P25 TiO2, it is expected that the TiO2 shells with controllable crystallinity and phase could be further engineered by incorporating more active components for producing highly active composite photocatalysts.
Broader contextEfficient conversion of solar energy into usable chemical or electrical energy is highly desirable to create a sustainable and environmentally friendly society. Titania is regarded as one of the most effective and environmentally benign photocatalysts which, upon light irradiation, can create electron–hole pairs to initiate secondary reactions. Since 1970s, it has been widely used for photocatalytic water splitting and photodegradation of various pollutants. Among many forms of titania materials, mesoporous hollow nanoshells have been found advantageous in catalytic applications because they possess high active surface area, reduced diffusion resistance, and improved accessibility. Tailored synthesis of titania hollow nanoshells is believed to provide many new opportunities for designing advanced photocatalysts. In this article, we report that a resin overcoat allows effective control over the crystallization of the amorphous titania shells during calcination, and produces hollow titania nanoshells with high crystallinity, controllable anatase–rutile mixed phases, excellent water dispersity, and therefore enhanced photocatalytic activity towards the degradation of organic molecules. |
Introduction
TiO2 is one of the most widely studied semiconducting oxide materials with a number of advantageous characteristics including low cost, low toxicity, and high chemical and optical stability,1,2 and has a wide range of applications including bio-separation,3,4 sensing,5 energy storage,6–8 solar energy conversion,9–11 and catalysis.12–14 Since the first discovery of its photocatalytic activity under UV light, TiO2 has also been widely studied as a photocatalyst in applications such as water splitting and purification.15,16 Recent research efforts have been made to control the morphology of nanostructured TiO2 materials, for example, by producing nanotubes,17–20 mesoporous thin films,21 porous networks,22 spherical particles,23–25 single crystals,26 and clusters,15 for enhancing the performance of the catalysts in solar energy conversion. Among various TiO2 materials, porous hollow particles possess attractive features such as relatively large active surface area, reduced diffusion resistance, improved accessibility, tunable crystallinity, and high catalytic activity. It can also be integrated with other active components to form composite catalysts with significantly enhanced performance. Therefore, it has been considered as one of the potential candidates for TiO2 based photocatalysis and dye-sensitized solar cells.27–29 Extensive research efforts have been devoted to the tailored synthesis of TiO2 hollow shells for enhancing catalytic activity,30–34 with particular focus on controlling the phase composition, degree of crystallinity, and surface area.35,36 Recently, we have synthesized mesoporous hollow TiO2 shells with high surface areas through a SiO2-protected calcination process.37 The presence of a thin SiO2 layer can effectively inhibit the grain growth of TiO2 during high temperature calcination, resulting in hollow shells with high surface areas. However, the TiO2 hollow shells exhibit relatively low photocatalytic activity because of the small grain size (∼5 nm). The inhibition is believed to result from the silicate species penetrating into the TiO2 matrix and preventing the grain growth. In order to increase the crystallinity of TiO2 shells while maintaining the shell morphology, we have further developed a “partial etching and recalcination” process.38 This process could increase the anatase grain size in a controllable manner while still yielding highly dispersible mesoporous shells, and therefore achieve high photocatalytic activity. However, it also has an apparent drawback in the complicated synthetic procedure including multiple steps of coating, etching, and calcination.To reduce the inhibition effect of our original protected calcination method, it is desired to replace SiO2 with another material that is more flexible and can provide sufficient space for the growth and phase change of the TiO2 layer. Additional requirements are that this material should be easily deposited on the TiO2 surface through simple procedures, and conveniently removed if needed. Our choice of material is resorcinol–formaldehyde (RF) resin, which is a crosslinked polymer that can be coated on the surface of many inorganic nanostructures through a similar sol–gel process.39 This phenolic resin can be easily converted to carbon or removed by calcination in different atmospheres.40,41 Compared to SiO2 protection, the RF resin layer is expected to influence the crystallization kinetics differently, and therefore provide new opportunities for controlling the crystallinity and phases of the TiO2 shells.
Through systematic study on the crystallization behaviour of TiO2 shells produced with cores and protecting shells of different compositions (SiO2vs. RF) and under different calcination conditions, we show here that a layer of RF could not only well maintain the TiO2 shell morphology during high temperature calcination but also allow well controlled crystallization and phase transformation of the shells. The resulting TiO2 shells exhibit high crystallinity, controllable anatase–rutile mixed phases, and excellent water dispersity after additional base treatment, and therefore show significantly enhanced photocatalytic activity towards the degradation of dye molecules.
Experimental section
Chemicals
Tetraethyl orthosilicate (TEOS, 99%), poly(vinyl pyrrolidone) (PVP, Mw ∼ 40![[thin space (1/6-em)]](https://www.rsc.org/images/entities/char_2009.gif) 000), ammonium hydroxide (NH3·H2O, 28% by weight in water), resorcinol, and cetyltrimethyl-ammonium bromide (CTAB, 98%) were purchased from Sigma-Aldrich. Ethanol and formaldehyde (37%) were obtained from Fisher. Tetrabutyl orthotitanate (TBOT, 99%) was purchased from Fluka. All chemicals were used as received without further purification. De-ionized water was used throughout the experiments.
000), ammonium hydroxide (NH3·H2O, 28% by weight in water), resorcinol, and cetyltrimethyl-ammonium bromide (CTAB, 98%) were purchased from Sigma-Aldrich. Ethanol and formaldehyde (37%) were obtained from Fisher. Tetrabutyl orthotitanate (TBOT, 99%) was purchased from Fluka. All chemicals were used as received without further purification. De-ionized water was used throughout the experiments.
Synthesis
![[thin space (1/6-em)]](https://www.rsc.org/images/entities/char_2009.gif) 000, 0.2 g) overnight to allow for the adsorption of PVP onto the TiO2 surface. The particles were then separated from solution by centrifugation, and re-dispersed in 23 mL of ethanol. The solution of SiO2@TiO2 was mixed with water (4.3 mL), TEOS (0.8 mL), and aqueous ammonia (28%, 0.62 mL). After stirring for 4 h, the resulting SiO2@TiO2@SiO2 particles were centrifuged, washed three times with ethanol and dried under vacuum.
000, 0.2 g) overnight to allow for the adsorption of PVP onto the TiO2 surface. The particles were then separated from solution by centrifugation, and re-dispersed in 23 mL of ethanol. The solution of SiO2@TiO2 was mixed with water (4.3 mL), TEOS (0.8 mL), and aqueous ammonia (28%, 0.62 mL). After stirring for 4 h, the resulting SiO2@TiO2@SiO2 particles were centrifuged, washed three times with ethanol and dried under vacuum.
![[thin space (1/6-em)]](https://www.rsc.org/images/entities/char_2009.gif) 000, 0.2 g) overnight to allow for the adsorption of PVP onto the TiO2 surface. The particles were then separated from solution by centrifugation and re-dispersed in 23 mL of ethanol. The RF@TiO2 colloid was sequentially mixed with water (4.3 mL), TEOS (0.8 mL) and aqueous ammonia (28%, 0.62 mL). After stirring for 4 h, the resulting RF@TiO2@SiO2 particles were centrifuged, washed three times with ethanol and dried under vacuum.
000, 0.2 g) overnight to allow for the adsorption of PVP onto the TiO2 surface. The particles were then separated from solution by centrifugation and re-dispersed in 23 mL of ethanol. The RF@TiO2 colloid was sequentially mixed with water (4.3 mL), TEOS (0.8 mL) and aqueous ammonia (28%, 0.62 mL). After stirring for 4 h, the resulting RF@TiO2@SiO2 particles were centrifuged, washed three times with ethanol and dried under vacuum.
Characterization
The sample morphology was characterized by transmission electron microscopy (TEM, Tecnai12). Crystal phases were determined by X-ray diffraction analysis (XRD) using a Bruker D8 Advance Diffractometer with Cu-Kα radiation (λ = 1.5406 Å). Thermogravimetric analysis (TGA) data was collected using a Seiko SSC 5200 TG/DTA thermal analysis apparatus. Zeta potential measurements were performed using a Beckman Coulter Delsa Nano C Zeta Potential Analyzer.Catalytic activity tests
The photocatalytic activity was evaluated by degradation of Rhodamine B (RhB) as a function of time. Before the photocatalytic test was initiated, the catalyst was first irradiated under UV light for 30 min to remove any residual organic contaminants. The catalyst (5 mg) was dispersed in an aqueous RhB solution (25 mL, 2 × 10⁻⁵ M) in a 50 mL reactor cell and the solution was stirred in dark conditions for 30 min to ensure adsorption of the dye. A 300 W Hg lamp with a 365 nm filter was used as the source of excitation (Xujiang XPA-7). The concentration of RhB was measured using a UV-vis spectrophotometer (HR2000CG-UV-NIR, Ocean Optics). The concentration of RhB in the reaction media, measured by the intensity of the absorption peak at 553 nm, was followed as a function of time in order to study the kinetics of the reaction.Results and discussion
The hollow TiO2 nanostructures in this study were synthesized by a templating and protected calcination procedure, as shown in Scheme 1. In general, this method involves the sequential coating of template cores with an amorphous TiO2 layer followed by the addition of a protection layer through sol–gel processes, calcination, and selective removal of the template and protection layer or directly calcination to finally produce hollow TiO2 shells.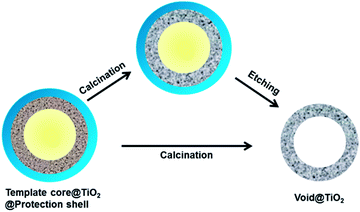 | ||
| Scheme 1 The strategy for the synthesis of mesoporous TiO2 hollow shells by using a templating method. | ||
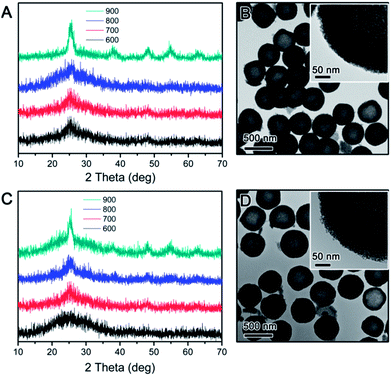
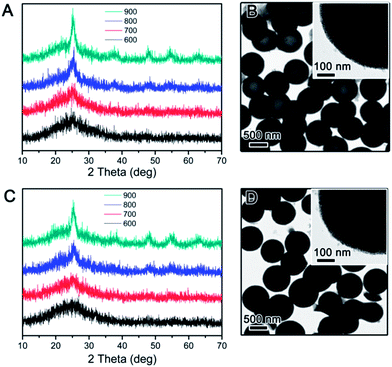
The crystallization behaviour of the TiO2 hollow structure with SiO2-protection was firstly investigated for comparison. As reported in our previous work, the hollow TiO2 shell was synthesized by SiO2-protected calcination followed by base etching of SiO2@TiO2@SiO2 core–shell–shell nanostructures.37 XRD was used to determine the crystalline phase of all TiO2 hollow shells calcined in air or N2 at different temperatures. As shown in Fig. 1A, hollow TiO2 shells prepared by silica-protected calcination at relatively low temperature (e.g. 600 °C) under air conditions show broad XRD peaks between 20° and 30° indicating low crystallinity anatase phase. When the calcination temperature was raised, intensity and sharpness of the XRD peaks increased indicating improved crystallinity. In particular, the XRD pattern of hollow TiO2 shells calcined at 900 °C shows obvious peaks at 2θ = 25.3, 37.8, 48.1, 54 and 55° which are attributed to the (101), (004), (200), (105) and (211) planes of crystalline structure of anatase TiO2, respectively. The crystallization of TiO2 hollow shells calcined under N2 also showed a similar trend (Fig. 1C). As shown in Fig. 1B and D, the hollow TiO2 samples prepared by calcination at 900 °C under either air or N2 show a highly mesoporous structure. In high magnification images of each particle (insets in Fig. 1B and D), it can be easily noticed that the shells consist of small crystal grains (ca. 3–4 nm). The average anatase grain sizes calculated from the widths of the anatase (101) peak using the Scherrer formula are limited to ∼4.5 nm even at considerably a high calcination temperature of 900 °C. As discussed in our previous work, this is mainly due to the inhibition of TiO2 crystallization by the impregnated silicate species, which are believed to penetrate into the TiO2 network during coating of the outer silica layer and act as a physical barrier preventing the growth of TiO2 grains during calcination.37,38
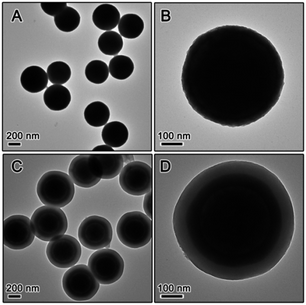
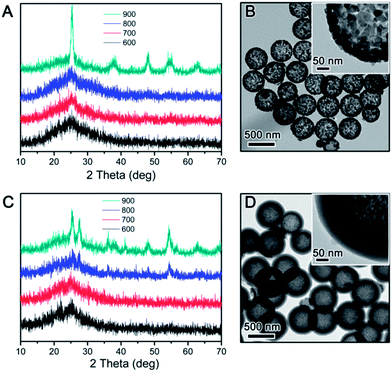
The use of RF resin as the protection layer leads to different inhibition effect than the case of silica. During silica coating, the hydrolysis of TEOS initially produces small silicate oligomers which can easily penetrate into the porous titania shell, and then interconnects into more rigid network through condensation. In the case of RF, its growth starts as a three-dimensional crosslinked network so its penetration into the titania shell is not as substantial as silica. In addition, compared to most polymers, the RF resin is more flexible as its crosslinking density is lower than condensed silica, making its barrier effect to be less than silica. The expected less limitation to the grain growth in the TiO2 shell is in fact beneficial to photocatalysis: as pointed out in our previous studies, high crystallinity rather than high surface area is more important in determining the photocatalytic activity of TiO2. In order to study the inhibition effect of RF, we coated an RF shell layer on the surface of the pre-synthesized SiO2@TiO2. High temperature calcination of the resulting SiO2@TiO2@RF multiple layer nanostructure under air or inert atmosphere removed the RF layer or converted it into carbon, respectively. The successful coating of SiO2 particles with TiO2 and then RF layer could be clearly confirmed by TEM observation. As shown in Fig. 2, the typical thickness of the TiO2 shell is ∼50 nm, and RF ∼ 60 nm. The as-prepared SiO2@TiO2@RF sample was firstly calcined at different temperatures in air. The crystalline phase and crystallinity of the samples calcined were investigated by XRD. As shown in Fig. 3A, below 800 °C, the crystallization of TiO2 was not substantial, very similar to the case with silica protection. However, when the sample was calcined at 900 °C, sharp diffraction peaks appeared, indicating the formation of large anatase grains in the TiO2 shell. It can be noticed that the samples consistently displayed a dominant anatase phase at all calcination temperatures. As shown in the representative TEM image in Fig. 3B, TiO2 shells prepared by RF protection and calcination at 900 °C under air followed by NaOH etching, have a well maintained hollow structure, discernible mesoporosity, and large TiO2 grains in the shell layer. The average grain size is about 12 nm as calculated from the XRD, indicating significantly higher crystallinity compared to the above case of SiO2-protected calcination.
For comparison, we also calcined the SiO2@TiO2@RF composite under inert environment to induce TiO2 crystallization and simultaneous carbonization of RF. As shown in Fig. 3C, when the calcination temperature was relatively low, it showed a similar trend to the above cases, with broad diffraction peaks indicating low crystallinity. But when the calcination temperature reached 800 °C, new peaks were seen at 2θ = 27.4, 36.2, 38.0, 41.1 and 54.2° corresponding to the (110), (101), (111), (210) and (211) planes of the rutile phase, respectively. At even higher calcination temperature, e.g. 900 °C, the peaks related to both anatase and rutile phases became sharper due to enhanced TiO2 crystallization. The average grain size calculated based on the anatase (101) and rutile (110) peaks for the sample calcined at 900 °C under N2 environment is about 8.6 nm for anatase and 14.9 nm for rutile. As shown in the TEM image in Fig. 3D, the sample after removing the inner SiO2 core by aqueous NaOH showed a hollow double shell structure consisting of a porous TiO2 shell and a dense carbon layer with empty inner void space.
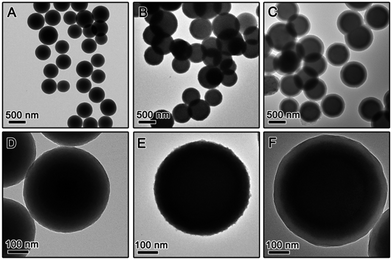
While it is now clear that the outer protective shell layer can have significant influence on crystallization of the TiO2 shell during calcination, it is also reasonable to suspect that core materials might have some effect on it. To study this we also synthesized core–shell particles by changing the core to RF and produced RF@TiO2@SiO2 and RF@TiO2@RF core–shell particles. Fig. 4 shows the TEM images of the samples evolving from RF to RF@TiO2@RF composite spheres by stepwise coating processes. In the case of the RF@TiO2@SiO2 composite spheres, calcination in air followed by base etching produced hollow TiO2 shells, with their XRD patterns and TEM images shown in Fig. 5A and B. Similar to the case of SiO2@TiO2@SiO2 (Fig. 1A and B), calcination at relatively low temperatures in air produced mesoporous hollow anatase shells with broad XRD peaks which sharpened as the calcination temperature increased.
The crystallization behaviour showed a similar trend when the atmosphere was switched from air to inert N2. Only when the calcination temperature increased to 900 °C, considerably large grains (5.6 nm vs. 5 nm in air) were produced. As shown in Fig. 5D, the major difference was in the morphology: the final product after base etching displays a carbon@TiO2 yolk–shell nanostructure. As expected, the RF polymer resin was carbonized when calcined under inert atmosphere, producing a carbon core with reduced size. Close observation (inset image in Fig. 5D) also confirmed highly mesoporous nature of the anatase shells.
It seems to be reasonable to conclude now that the composition of cores does not have significant effect on the crystallization of TiO2 shells. Our study indicated that the outer protecting layer, on the other hand, has a dominant effect on the crystallization of TiO2. When the TiO2 shell was covered with an RF shell, crystallization was found to be highly dependent on the calcination temperature and the final samples showed a mixture of anatase and rutile crystal phases.
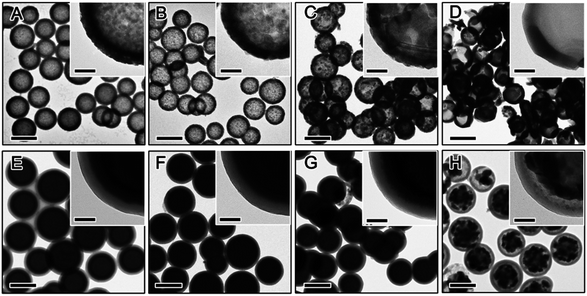
The crystalline grain growth, phase change, and structural integrity of final TiO2 shells obtained by calcination of RF@TiO2@RF samples at different temperatures and under different environments were investigated by XRD and TEM. Fig. 6 displays the general morphologies and compares the development of the crystalline grain of TiO2. Under air, both the inner RF core and the outer RF shell were burned out at high temperature, producing hollow TiO2 shells (Fig. 6A–D). It can be easily noticed that the final TiO2 shell samples calcined below 700 °C can maintain the hollow morphology well, while half of the particles appeared broken when the calcination temperature reached 800 °C. Direct observation based on the TEM images indicated that hollow TiO2 shells obtained by calcination at 500 °C showed the smallest crystal grain (Fig. 6A) and the grain size increased substantially with increasing calcination temperature (Fig. 6B–D).
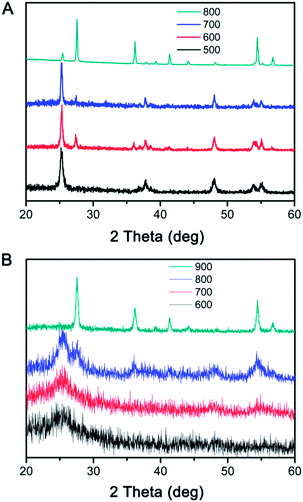
When the RF@TiO2@RF samples were calcined under N2, both the inner RF core and outer RF shell were converted into carbon, resulting in a C@TiO2@C structure. By heating to 800 °C in argon, a 48% weight loss was observed in the TGA measurement (Fig. S1†). Due to the presence of both the carbon core and shell, the contrast between the TiO2 layer and carbon layers became small, making it difficult to see the detailed morphology of the sandwiched TiO2 layer. However, it is still safe to conclude that the overall core–shell morphology did not significantly change until the sample was calcined under N2 at 900 °C, when the TiO2 shells collapsed into large crystal grains enclosed by the outer carbon shells. The crystallization of TiO2 upon calcination of the RF@TiO2@RF sample at different temperatures under different conditions have been further studied by XRD analysis. As shown in Fig. 7A, when the RF@TiO2@RF composite was calcined in air at a relatively low temperature, such as 500 °C, it already showed strong diffraction peaks indicating well developed anatase grains. As the calcination temperature increased to 600 °C, anatase peaks became shaper and rutile peaks started to emerge. When the calcination temperature was increased to 800 °C, the XRD pattern consists primarily of sharp peaks of rutile phase. The relative ratio of the rutile phase was estimated as ca. 0, 19.4, 7.8, and 87.3% for TiO2 samples calcined at 500, 600, 700 and 800 °C under air, respectively, by using the Spurr equation.45 The percentage of rutile in the sample calcined at 600 °C was higher than that at 700 °C, which can be explained by the fact that at around 600 °C, the residue carbon induces a slightly reducing atmosphere which enhances the formation of oxygen vacancies, thereby promoting the phase transformation to rutile.46 Directly heating to 700 °C, on the other hand, consumed all the carbon rapidly, as confirmed by the TGA analysis in air (Fig. S1†), and therefore could not produce sufficient vacancies for phase transformation. The average anatase grain sizes of the TiO2 samples were calculated at approximately 17.4, 30.9, 34.1, and 39.7 nm for samples calcined at 500, 600, 700 and 800 °C under air, respectively. The rutile grain size of samples calcined at 600, 700, and 800 °C were estimated at 26.9, 38.5, and 48.1 nm, respectively. As evidenced by the TEM image in Fig. 6D, when calcined at 800 °C in air, TiO2 crystallizes substantially during calcination and produces crystal grains with sizes beyond the thickness of the original shells, and as such, some broken shells were observed. It is worth noting that compared with conditions for producing crystalline TiO2 shells in previous systems, this RF-protected calcination method offers the lowest calcination temperature (500 °C) that can lead to highly crystallized anatase phase and well-maintained shell morphology. To check the influence of the calcination time, the RF@TiO2@RF sample was calcined in air at 500 °C for 2 h, 4 h, and 8 h, and the corresponding XRD patterns were shown in Fig. S2.† The crystallinity was improved with the increasing calcination time. However, the products only exhibit anatase phase even after 8 h of calcination, suggesting that the calcination temperature impact more on the phase transformation than the calcination time. As a general conclusion obtained from our previous works, the large grain size is beneficial to the photocatalytic activities of the TiO2 hollow shells, which will be further discussed in the photocatalysis section below.
When the calcination took place under N2, the final C@TiO2@C composite showed different crystallization behavior (Fig. 7B). The samples calcined at relatively low temperatures (e.g. 600 or 700 °C) displayed a very broad peak indicating poorly crystallized anatase phase. As the calcination temperature increased to 800 °C, the anatase peaks were considerably strengthened and a few weak peaks corresponding to the rutile phase also appeared. The grain sizes of the TiO2 were estimated at approximately 3.9 nm for anatase and 8.1 nm for rutile. When the temperature reached 900 °C, only very sharp peaks of rutile phase were observed. We believe at such high calcination temperature (900 °C), it is possible that the anatase domains grow quickly and lead to an efficient transformation to the rutile phase.47,48 The rutile grain size of the sample calcined at 900 °C was estimated at 23.8 nm, which is consistent with TEM observations in Fig. 6H.
It can be easily noticed that the RF@TiO2@RF sample showed different trends of TiO2 crystallization as compared to SiO2@TiO2@RF (Fig. 3). While SiO2@TiO2@RF showed low anatase crystallinity at relatively low calcination temperature (500 °C), RF@TiO2@RF sample possesses significantly higher anatase crystallinity under the same calcination condition. Although the RF-protected TiO2 shells showed improved anatase crystallinity with increasing calcination temperatures, the degree of crystallinity enhancement is much more significant with RF@TiO2@RF. In particular, at 800 °C under air, the shell obtained from the RF@TiO2@RF sample consisted of rutile as the main crystalline phase, while only low crystalline anatase phase was obtained in the case of SiO2@TiO2@RF. The crystallization behaviour of TiO2 was also found to be very different when the calcination was carried out under N2. Both RF-protected TiO2 shells showed low anatase crystallinity upon low temperature calcination (600 or 700 °C). However, the sample from RF@TiO2@RF showed more obvious anatase and rutile peaks than SiO2@TiO2@RF when calcined at 800 °C. As the calcination temperature increased even further (900 °C), RF@TiO2@RF sample showed pure rutile phase with high crystallinity while SiO2@TiO2@RF still showed anatase–rutile mixed phases with low crystallinity. By combining the above observations, it can be concluded that TiO2 crystallization kinetics of RF@TiO2@RF sample is much faster than that of SiO2@TiO2@RF. Apparently, with the RF outer protection layer, the composition of the inner cores does have big impact on the crystallization behaviour of the TiO2 layer. There seems to be a contradictory between the two cases with SiO2 and RF as the outer protection layers, which however could be explained as follows. As pointed out previously, when the outer protection layer is silica, the incorporation of silicate species into the TiO2 layer effectively prevents the fast crystallization and phase change of TiO2, regardless of the core compositions. When the outer protection layer is RF, its penetration into the TiO2 layer is much less significant so that the crystallization and phase change of TiO2 is much easier than that with SiO2 protection. In this case, the flexibility of RF and its volume shrinkage during carbonization provide extra space needed for fast TiO2 grain growth and phase transformation. Therefore, TiO2 crystallization is more favourable, especially when the core is made of RF. If the core is SiO2, due to its considerable solubility in water, a small amount of silicate species is present in the solution and can be incorporated into the TiO2 shell during its coating, thus leading to some inhibition effect to the grain growth and phase change of the TiO2 during calcination. In short, with the RF as the outer protection layer, it is possible to produce highly crystalline anatase, mixed anatase–rutile, or pure rutile phase by simply controlling the calcination temperatures.
Table 1 is a summary of the characterization of TiO2 hollow structures obtained from different calcination conditions. It can be noticed that the TiO2 hollow structure prepared by SiO2 protected calcination exhibits anatase phase at all calcination temperatures tested. However, with RF protected calcination, it is easier for the hollow TiO2 shell to form rutile phase. Again, if silica is coated on the surface of TiO2 shell, it can be concluded that the outer SiO2 layer has much more significant effect on the limitation of grain growth of the TiO2, while the core effect is minor. However, when an RF layer is coated on the surface of TiO2, the core materials show a more pronounced influence on TiO2 crystallization. Since calcination of RF@TiO2@RF at different temperatures under air leads to well-maintained structural integrity, controllable crystalline properties as well as reasonably high crystallinity, we will mainly focus our subsequent discussion of the photocatalytic activity on this composite. The samples will be denoted as RTR-x, with x being the calcination temperature.
| Composites | Atmosphere | 500 °C | 600 °C | 700 °C | 800 °C | 900 °C |
|---|---|---|---|---|---|---|
| SiO2@TiO2@SiO2 | Air | Anatase (1.2 nm) | Anatase (1.8 nm) | Anatase (1.9 nm) | Anatase (4.6 nm) | |
| N2 | Anatase (1.6 nm) | Anatase (1.8 nm) | Anatase (2.1 nm) | Anatase (4.7 nm) | ||
| SiO2@TiO2@RF | Air | Anatase (1.3 nm) | Anatase (1.6 nm) | Anatase (4.1 nm) | Anatase (12.5 nm) | |
| N2 | Anatase (1.5 nm) | Anatase (1.8 nm) | Anatase–rutile (5.5/13.1 nm) | Anatase–rutile (8.6/14.9 nm) | ||
| RF@TiO2@SiO2 | Air | Anatase (1.1 nm) | Anatase (2.8 nm) | Anatase (4.4 nm) | Anatase (5.6 nm) | |
| N2 | Anatase (1.1 nm) | Anatase (1.6 nm) | Anatase (4.2 nm) | Anatase (5.0 nm) | ||
| RF@TiO2@RF | Air | Anatase (17.4 nm) | Anatase–rutile (30.9/26.9 nm) | Anatase–rutile (34.1/38.5 nm) | Anatase–rutile (39.7/48.1 nm) | |
| N2 | Anatase (1.4 nm) | Anatase (2.1 nm) | Anatase–rutile (3.9/8.1 nm) | Rutile (23.8 nm) |
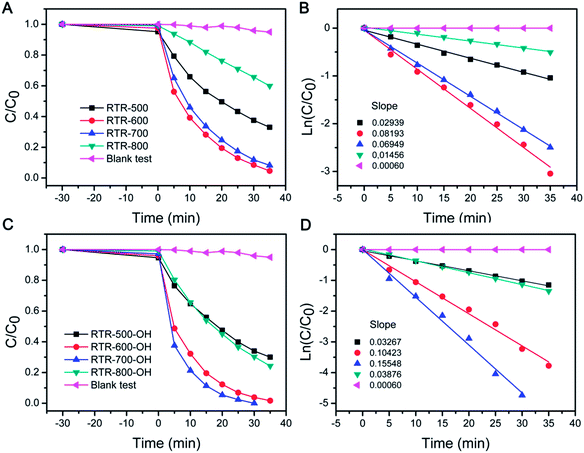
We tested UV-driven degradation of RhB by using the sample set of RTR-x for evaluating photocatalytic activity. The performance of the photocatalysts employed in this work toward RhB degradation was determined by monitoring the intensity change of the 553 nm peak (Fig. S3†) versus time, as summarized in Fig. 8A. Before UV irradiation, the reaction media containing the catalyst and RhB was stirred in the dark for 30 min to ensure adsorption of RhB on the surface of catalyst. All of the RTR-x hollow shell catalysts have a similar adsorption capacity in the range of 1–6%. In the blank test, RhB was only degraded by 5% over 35 min. However, degradation was significantly improved when RTR-x catalysts were employed in the reaction system. As shown in Fig. 8A, RTR-600 and RTR-700 showed relatively higher activity than RTR-500 and RTR-800. The relative photocatalytic activity of the catalysts for RhB degradation follows the order: RTR-600 ≥ RTR-700 > RTR-800 > RTR-500. It is apparent that the catalytic activity continuously increases as the calcination temperature was increased from 500 °C to 600–700 °C. By combining XRD data (Fig. 7A), one can notice that the performance enhancement is mainly due to the increase in crystallinity and formation of an anatase–rutile mixed phase composite. The formation of rutile can improve the photocatalysis by absorbing a broader range of light, due to the smaller band gap of rutile, and by improving the charge separation efficiency. However, when calcination temperature was too high (800 °C), the catalytic activity decreased. As we have pointed out in our previous studies, many factors, such as degree of crystallinity, crystalline phase, surface area and dispersity, play a role in the enhancement of photocatalytic activity over TiO2 photocatalysts.38 From Fig. 8A, it is clear that high crystallinity with anatase–rutile mixed phase is helpful for the enhancement of photocatalytic activity. However, as the calcination temperature is increased to 800 °C, metastable anatase crystals grow and transform into large rutile crystals which are less active in UV-driven photocatalysis. In addition, it should be noticed that high temperature calcination (800 °C) also led to significant grain growth, smaller surface area, and severe condensation of the surface –OH groups to Ti–O–Ti bonds and therefore low solution dispersity.
The data were also plotted in semilogarithmic form in order to calculate the first-order reaction rate constants (k). As shown in Fig. 8B, RTR-600 and RTR-700 showed relatively higher k values (0.081 min−1 for RTR-600 and 0.073 min−1 for RTR-700, respectively) than RTR-500 (0.030 min−1). This dramatic enhancement is likely from the high anatase crystallinity and the presence of anatase–rutile mixed phase. Although anatase has generally shown the highest photocatalytic activity,49,50 previous studies have suggested that the presence of a small amount of rutile in an anatase sample may promote the catalytic activity.51–53 This has also been confirmed in commercially available Degussa P25 TiO2, which consists of 80% anatase and 20% rutile, and is generally accepted to exhibit exceptionally better photocatalytic efficiency compared to other TiO2 forms. Generally it is explained that the high activity of P25 was mainly attributed to the mixed phase composition and the high anatase crystallinity, which would favour light adsorption of low energy range of UV, separation of photogenerated charge carriers, as well as a large specific surface area.54 The low k value of RTR-800 (0.015 min−1) also proves that a structure consisting of primarily rutile phase, exhibits relatively low activity.
The activity of the hollow TiO2 from SiO2-protection was also investigated for comparison (Fig. S4†). The samples are denoted as STS-x indicating hollow TiO2 samples prepared by calcining SiO2@TiO2@SiO2 particles to the desired temperature of x °C under air, followed by NaOH etching. The k value increased continuously as the calcination temperature rose to 900 °C (k = 0.0487 min−1), similar to the results we reported previously.35 However, it is apparent that TiO2 hollow shells from the RF-protected calcination show higher activity than the SiO2 protected samples when the calcination temperatures are the same. Specifically, the hollow TiO2 shells with anatase–rutile mixed phase and high crystallinity (RTR-600 and RTR-700) prepared by RF-protected calcination under air show superior performance.
Although our RTR samples showed enhanced photocatalytic performance toward RhB degradation, it should be noted that they may not exhibit the maximum activity because they have lower dispersibility than STS samples. For STS samples, the final step of base etching produces a high density of OH groups on the TiO2 surface and ensures high water dispersity. In contrast, high temperature calcination of the RTR samples removes RF layer and induces severe condensation of surface –OH groups, leading to a decrease in the number of polar groups on the TiO2 surface and therefore reduced water dispersity. As particle dispersity determines the effective surface of the catalysts in solution, it is also one of the important characteristics that can influence photocatalytic activity. In order to address the dispersity issue, the RTR samples were further treated by a NaOH solution (2.5 M), and denoted as RTR-x-OH. The zeta potential values (Table S1†) of the TiO2 shells dispersed in deionized water were found to be ca. −38, −46 and −32 mV for the RTR-500-OH, RTR-600-OH, and RTR-700-OH, respectively. Compared to the values of −33, −32 and −16 mV for the RTR-500, RTR-600, and RTR-700, respectively, it is clear that all the samples were more negatively charged after NaOH treatment. The high density of negative charges on the surface of the etched samples may contribute to their water dispersibility and eventually benefit their photocatalytic performance. As shown in Fig. 8C, much shorter time was needed to complete the degradation of RhB for all NaOH treated RTR samples than those untreated ones (Fig. 8A). In particular, RTR-700-OH showed dramatically enhanced activity compared to RTR-700. In order to compare reaction kinetics, we also re-plotted the reaction results to semilogarithmic forms (Fig. 8D). Again, the activity of all the RTR samples was significantly improved after NaOH treatment. The relative photocatalytic activity of the RTR-x-OH samples follows the order: RTR-700-OH > RTR-600-OH > RTR-800-OH > RTR-500-OH. The k values of all the samples have been summarized in Fig. 9, where it is obvious that the sample RTR-700-OH has the highest k value (k = 0.155 min−1) for photocatalytic RhB degradation. Further, this sample shows comparable activity with commercial P25-TiO2 catalyst (Fig. S5†). We have also evaluated the cycling performance of RTR-700-OH (Fig. S6†). After each decomposition reaction for 25 min, the catalyst was separated and washed, and then used for around of reaction. The activity of RTR-700-OH only decreased slightly and 83% RhB decolorization could still be achieved after five runs. Considering the sample loss due to centrifugation during each recycling process, it is reasonable to conclude that the catalyst can maintain its high activity after multiple uses. These results generally suggest that a great overall catalytic performance of titania based catalysts could benefit from the enhanced crystallinity, the formation of an anatase–rutile mixed phase, and the good water dispersity.
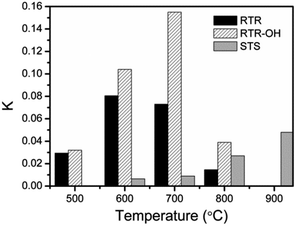 | ||
| Fig. 9 Comparison of the photocatalytic activity of different TiO2 hollow shells towards photocatalytic degradation of RhB. | ||
Conclusions
We show in this work a coating of crosslinked polymer could not only maintain the TiO2 shell morphology during high temperature calcination but also allow well controlled crystallization and phase transformation of the shells. The resulting TiO2 shells possess high crystallinity, a controllable anatase–rutile mixed phase, and excellent water dispersity after additional base treatment, and therefore show significantly enhanced photocatalytic activity towards the degradation of RhB molecules. Compared with the silica protected calcination method that we reported previously, the advantageous characteristics of the RF protection could be attributed to the flexibility of the polymer, its minimal penetration into the TiO2, and its shrinkage during calcination, together providing sufficient spaces for grain growth and phase change. With the ease of achieving photocatalytic activity comparable to commercial P25 TiO2, the TiO2 shells with controllable crystallinity and phase may offer more opportunities for future engineering by incorporating additional active components such as plasmonic nanoparticles for producing composite photocatalysts with further enhanced activity. We also believe that the “RF-protected calcination” strategy developed here should be a general and effective method for controlling the crystallinity of other catalysts with porous shell morphology for improving catalytic activity.Acknowledgements
Financial support for this project was provided by the U.S. Department of Energy (DE-FG02-09ER16096). Liu acknowledges the fellowship support by the China Scholarship Council (CSC) and the National Natural Scientific Foundation of China (NSFC-21201092).Notes and references
- A. Kudo and Y. Miseki, Chem. Soc. Rev., 2009, 38, 253–278 RSC.
- D. P. Macwan and P. N. Dave, J. Mater. Sci., 2011, 46, 3669–3686 CrossRef CAS.
- Z. Lu, M. Ye, N. Li, W. Zhong and Y. Yin, Angew. Chem., Int. Ed., 2010, 49, 1862–1866 CrossRef CAS PubMed.
- Z. Lu, J. Duan, L. He, Y. Hu and Y. Yin, Anal. Chem., 2010, 82, 7249–7258 CrossRef CAS PubMed.
- H. G. Moon, Y.-S. Shim, H. W. Jang, J.-S. Kim, K. J. Choi, C.-Y. Kang, J.-W. Choi, H.-H. Park and S.-J. Yoon, Sens. Actuators, B, 2010, 149, 116–121 CrossRef CAS PubMed.
- S. Ding, J. S. Chen, Z. Wang, Y. L. Cheah, S. Madhavi, X. Hu and X. W. Lou, J. Mater. Chem., 2011, 21, 1677–1680 RSC.
- X. Quan, S. Yang, X. Ruan and H. Zhao, Environ. Sci. Technol., 2005, 39, 3770–3775 CrossRef CAS.
- J. S. Chen, D. Luan, C. M. Li, F. Y. C. Boey, S. Qiao and X. W. Lou, Chem. Commun., 2010, 46, 8252–8254 RSC.
- U. Bach, D. Lupo, P. Comte, J. E. Moser, F. Weissörtel, J. Salbeck, H. Spreitzer and M. Grätzel, Nature, 1998, 395, 583–585 CrossRef CAS PubMed.
- S. Wang, L. Yi, J. E. Halpert, X. Lai, Y. Liu, H. Cao, R. Yu, D. Wang and Y. Li, Small, 2012, 8, 265–271 CrossRef CAS PubMed.
- J. Du, X. Lai, N. Yang, J. Zhai, D. Kisailus, F. Su, D. Wang and L. Jiang, ACS Nano, 2011, 5, 590–596 CrossRef CAS PubMed.
- M. Ye, Q. Zhang, Y. Hu, J. Ge, Z. Lu, L. He, Z. Chen and Y. Yin, Chem.–Eur. J., 2010, 16, 6243–6250 CrossRef CAS PubMed.
- H. J. Yun, H. Lee, J. B. Joo, N. D. Kim and J. Yi, J. Nanosci. Nanotechnol., 2011, 11, 1688–1691 CrossRef CAS PubMed.
- N. Yang, Y. Liu, H. Wen, Z. Tang, H. Zhao, Y. Li and D. Wang, ACS Nano, 2013, 7, 1504–1512 CrossRef CAS PubMed.
- Q. Zhang, J. B. Joo, Z. Lu, M. Dahl, D. Q. L. Oliveira, M. Ye and Y. Yin, Nano Res., 2011, 4, 103–114 CrossRef CAS PubMed.
- A. Fujishima and K. Honda, Nature, 1972, 238, 37–38 CrossRef CAS.
- M. Law, L. E. Greene, J. C. Johnson, R. Saykally and P. D. Yang, Nat. Mater., 2005, 4, 455–459 CrossRef CAS PubMed.
- S. P. Albu, A. Ghicov, J. M. Macak, R. Hahn and P. Schmuki, Nano Lett., 2007, 7, 1286–1289 CrossRef CAS PubMed.
- K. Zhu, N. R. Neale, A. Miedaner and A. J. Frank, Nano Lett., 2007, 7, 69–74 CrossRef CAS PubMed.
- G. K. Mor, K. Shankar, M. Paulose, O. K. Varghese and C. A. Grimes, Nano Lett., 2006, 6, 215–218 CrossRef CAS PubMed.
- S. S. Soni, M. J. Henderson, J.-F. Bardeau and A. Gibaud, Adv. Mater., 2008, 20, 1493–1498 CrossRef CAS.
- D. G. Shchukin and R. A. Caruso, Adv. Funct. Mater., 2003, 13, 789–794 CrossRef CAS.
- J. Li, C. Tang, D. Li, H. Haned and T. Ishigaki, J. Am. Ceram. Soc., 2004, 87, 1358–1361 CrossRef CAS PubMed.
- W. Ho, J. C. Yu and S. Lee, Chem. Commun., 2006, 1115–1117 RSC.
- Z. Zheng, B. Huang, X. Qin, X. Zhang, Y. Dai, M. Jiang, P. Wang and M. Whangbo, Chem.–Eur. J., 2009, 15, 12576–12579 CrossRef CAS PubMed.
- H. G. Yang, C. H. Sun, S. Z. Qiao, J. Zou, G. Liu, S. C. Smith, H. M. Cheng and G. Q. Lu, Nature, 2008, 453, 638–641 CrossRef CAS PubMed.
- J. H. Pan, X. Zhang, A. J. Du, D. D. Sun and J. O. Leckie, J. Am. Chem. Soc., 2008, 130, 11256–11257 CrossRef CAS PubMed.
- Y. Kondo, H. Yoshikawa, K. Awaga, M. Murayama, T. Mori, K. Sunada, S. Bandow and S. Iijima, Langmuir, 2008, 24, 547–550 CrossRef CAS PubMed.
- Z. Dong, H. Ren, C. M. Hessel, J. Wang, R. Yu, Q. Jin, M. Yang, Z. Hu, Y. Chen, Z. Tang, H. Zhao and D. Wang, Adv. Mater., 2014, 26, 905–909 CrossRef CAS PubMed.
- H. Wang, M. Miyauchi, Y. Ishikawa, A. Pyatenko, N. Koshizaki, Y. Li, L. Li, X. Li, Y. Bando and D. Golberg, J. Am. Chem. Soc., 2011, 133, 19102–19109 CrossRef CAS PubMed.
- T. H. Eun, S. Kim, W. Jeong, S. Jeon, S. Kim and S. Yang, Chem. Mater., 2009, 21, 201–203 CrossRef CAS.
- Y. Hu, J. Ge, Y. Sun, T. Zhang and Y. Yin, Nano Lett., 2007, 7, 1832–1836 CrossRef CAS PubMed.
- H. Zhang, G. Du, W. Lu, L. Cheng, X. Zhu and Z. Jiao, CrystEngComm, 2012, 14, 3793–3801 RSC.
- X. Lai, J. E. Halpert and D. Wang, Energy Environ. Sci., 2012, 5, 5604–5618 CAS.
- G. Tian, H. Fu, L. Jing, B. Xin and K. Pan, J. Phys. Chem. C, 2008, 112, 3083–3089 CAS.
- S. Ardizzone, C. L. Bianchi, G. Cappelletti, S. Gialanella, C. Pirola and V. Ragaini, J. Phys. Chem. C, 2007, 111, 13222–13231 CAS.
- J. B. Joo, Q. Zhang, I. Lee, M. Dahl, F. Zaera and Y. Yin, Adv. Funct. Mater., 2012, 22, 166–174 CrossRef CAS.
- J. B. Joo, Q. Zhang, M. Dahl, I. Lee, J. Goebl, F. Zaera and Y. Yin, Environ. Sci., 2012, 5, 6321–6327 CAS.
- N. Li, Q. Zhang, J. Liu, J. Joo, A. Lee, Y. Gan and Y. Yin, Chem. Commun., 2013, 49, 5135–5137 RSC.
- K. P. Gierszal and M. Jaroniec, J. Am. Chem. Soc., 2006, 128, 10026–10027 CrossRef CAS PubMed.
- D. Carriazo, M. C. Gutiérrez, M. L. Ferrer and F. D. Monte, Chem. Mater., 2010, 22, 2711–2719 CrossRef.
- W. Stöber, A. Fink and E. Bohn, J. Colloid Interface Sci., 1968, 26, 62–69 CrossRef.
- Q. Zhang, T. Zhang, J. Ge and Y. Yin, Nano Lett., 2008, 8, 2867–2871 CrossRef CAS PubMed.
- J. Liu, S. Z. Qiao, H. Liu, J. Chen, A. Orpe, D. Y. Zhao and G. Q. Lu, Angew. Chem., Int. Ed., 2011, 50, 5947–5951 CrossRef CAS PubMed.
- R. A. Spurr and H. Myers, Anal. Chem., 1957, 29, 760–762 CrossRef CAS.
- D. A. H. Hanaor and C. C. Sorrell, J. Mater. Sci., 2011, 46, 855–874 CrossRef CAS.
- Y. Hu, H. L. Tsai and C. L. Huang, Mater. Sci. Eng., A, 2003, 344, 209–214 CrossRef.
- H. Zhang and J. F. Banfield, J. Mater. Chem., 1998, 8, 2073–2076 RSC.
- M. A. Fox and M. T. Dulay, Chem. Rev., 1993, 93, 341–357 CrossRef CAS.
- A. L. Linsebigler, G. Lu and J. T. Yates, Chem. Rev., 1995, 95, 735–758 CrossRef CAS.
- D. Tsukamoto, Y. Shiraishi, Y. Sugano, S. Ichikawa, S. Tanaka and T. Hirai, J. Am. Chem. Soc., 2012, 134, 6309–6315 CrossRef CAS PubMed.
- Y. Zhang, J. Chen and X. Li, Catal. Lett., 2010, 139, 129–133 CrossRef CAS.
- Z. Liu, X. Zhang, S. Nishimoto, M. Jin, D. A. Tryk, T. Murakami and A. Fujishima, Langmuir, 2007, 23, 10916–10919 CrossRef CAS PubMed.
- J. Yu, H. Yu, B. Cheng, M. Zhou and X. Zhao, J. Mol. Catal. A: Chem., 2006, 253, 112–118 CrossRef CAS PubMed.
Footnote |
| † Electronic supplementary information (ESI) available: additional TGA, XRD, and zeta potential analyses, UV-vis absorption spectra showing UV-degradation of RhB, catalytic activity of STS, and comparison of photocatalytic activity of RTR-700 with P25. See DOI: 10.1039/c4ee02618g |
| This journal is © The Royal Society of Chemistry 2015 |

