A low content Au-based catalyst for hydrochlorination of C2H2 and its industrial scale-up for future PVC processes†
Kai
Zhou
a,
Jinchao
Jia
a,
Chunhua
Li
b,
Hao
Xu
a,
Jun
Zhou
b,
Guohua
Luo
*a and
Fei
Wei
*a
aBeijing Key Laboratory of Green Chemical Reaction Engineering and Technology, Department of Chemical Engineering, Tsinghua University, Beijing 100084, China. E-mail: luoguoh@tsinghua.edu.cn; wf-dce@tsinghua.edu.cn; Fax: +86-10-62772051; Tel: +86-10-62788994
bTianye (Group) Co., Ltd, Shihezi, Xinjiang 832000, China
First published on 28th August 2014
Abstract
China has the world's largest polyvinyl chloride (PVC) production capacity, comprising over 20 Mt a−1 and occupying 41% of the world production capacity. However, the production of the PVC monomer, vinyl chloride monomer (VCM), faces unsustainable development due to mercury problems. Over 70% of VCM in mainland China is synthesized through hydrochlorination of C2H2 catalyzed by HgCl2. Mercury and its compounds escaping from the reactors have high chronic toxicity, which is harmful to the environment and to people's health. Therefore, developing a novel mercury-free catalyst is crucial for maintaining a green production of PVC in China. This paper shows a novel low content Au-based catalyst by complexing Au with thiocyanate (–SCN). This chemical complex significantly decreases the electrode potential of Au3+ from 0.926 V to 0.662 V, and hence reduces the probability of its reduction by C2H2. The catalyst preserves a high turnover frequency of 5.9 s−1 based on Au, and over 3000 h testing of a 4 t a−1 pilot-trial shows its promising reactivity (>95%) and selectivity (>99%). Compared with the conventional HgCl2 catalyst, this novel Au catalyst has better reactivity, stability, environmental friendliness and lower toxicity, making it promising for the sustainable development of China's PVC industry.
Introduction
Polyvinyl chloride (PVC) is the second most widely used general resin because of its advanced features. The production capacity of PVC increases 5.8% per year globally,1 while in China the capacity has been increasing over 10% annually since 2003 (Fig. S1(a)†). Two methods are currently employed industrially to produce the PVC monomer, vinyl chloride monomer (VCM). One method is pyrolysis of dichloroethane which is synthesized through additional reactions between C2H4 and Cl2 (Fig. S2†). The other is called the calcium carbide method through hydrochlorination of C2H2 catalyzed by HgCl2:C2H2 + HCl → CH2![[double bond, length as m-dash]](https://www.rsc.org/images/entities/char_e001.gif) CHCl ΔH = −124.8 kJ mol−1 CHCl ΔH = −124.8 kJ mol−1 |
Fig. S3† shows that the global net PVC production capacity is 50.9 Mt a−1 in 2012, of which China holds a 41% share. As the world's largest PVC producing country, China has over 13 Mt a−1 PVC synthesized from the calcium carbide method,2 and this route dominates more than 70% of the gross PVC production in China (Fig. S1(b)†). Due to the low heat transfer efficiency in fixed bed reactors, hot spots over 200 °C are easily formed, hence accelerating high volatility mercuric chloride run-off. It is estimated that production of 1.0 t of PVC consumes 1.02–1.41 kg HgCl2 catalyst (HgCl2 content: 10–12 wt%), while over 25% HgCl2 fails to be reused during the recycling, thereby causing chronic poisoning. Facing the harmful pollution of HgCl2, the development of novel Hg-free catalysts is extremely urgent for establishing a sustainable PVC industry in China. Recently, green Hg-free catalysts, which are mainly heterogeneous catalysts (e.g. Au/C,3–14 Cu–Bi/SiO2,15 Au–Cu/C,16 Au–Co/C,10 CNx,17–20 Au–Cu–SCN/C21), have been widely studied for the hydrochlorination of C2H2.
Over the past few centuries, gold has been valued as a symbol of wealth owing to its rareness and seeming inertness. Thus, the discovery that gold is an active promoter of many fundamental reactions has excited numerous researchers. Gold in a cationic form (Au3+/Au+) is electrophilic and active for nucleophilic attack. Gold cations coordinate preferentially to alkenes or alkynes, making it possible to catalyze all related kinds of reactions ranging from partial oxidation of hydrocarbons to the hydrogenation of unsaturated carbonyl compounds under appropriate conditions,8,22–24 such as the oxidation of CH4 and CO, water gas shift, methanol esterification, olefin hydrogenation and hydrochlorination, and so on.5,7,11,25–31 Therefore Au has great potential for energy-efficient green chemistry applications,32–34 such as hydrochlorination of C2H2 to produce VCM. After comparing the catalytic activity of certain kinds of metal chloride catalysts,11,13,14,35–38 Hutchings’ group has already found that AuCl3 possesses the best reactivity. Thereafter, highly efficient catalysts in the form of Au/C3–7 were reported and the feasibility was proved to substitute toxic HgCl2 catalysts.
However, the present noble-metal catalysts still face great challenges for industrial applications, mainly because of their high cost (e.g. 1.0 wt% Au content,10,39 shown in Fig. S4†) and fast deactivation.40 To overcome these shortcomings, several ideas were developed, such as adding Cu into the Au catalyst to reduce the Au loading down to 0.5 wt%,16 or co-feeding oxidizing gases like NO with the reactants to eliminate the deactivation. Although significant improvement has been achieved, the balance between Au loading and reactivity remains unreached.
Meanwhile, Hg-free non-precious metal catalysts have been investigated for decades in the academic field. The mono-metal catalyst SnCl2/C or the bimetallic catalyst BiCl3–CuCl2/SiO2 and the ternary metal catalyst SnCl2–BiCl3–CuCl/C have acceptable conversion and selectivity;41–43 unfortunately, the higher volatility and the more severe coke than HgCl2 terminate their industrial applications.
In addition, N-doped carbon materials have been proved to be efficient catalysts for this process recently;19 however, the industrial scale-up needs further research. In summary, it is expected to create a novel and more efficient nanostructured catalyst, which embodies a balance of economy, activity, selectivity and stability, for challenging industrialized applications of green catalysis. Au, as a biocompatible non-toxic metal with outstanding properties, can be molded upon the novel hydrochlorination process as long as loading is further lower than the present level of 0.5 wt%.
Here we report a novel Au-complexing catalyst with thiocyanate (–SCN) for hydrochlorination of C2H2 with 0.25 wt% Au loading. The cost of the Au-complexing catalyst was only approximately 25% of the cost of Hutchings’ catalyst, making it comparable with the cost of HgCl2/C and cheap enough for industrial use. The reason for introducing –SCN as a complexing ligand was that the electric potential of Au(SCN)4− (0.662 V) is significantly lower than that of similar AuCl4− (0.926 V) or AuBr4− (0.802 V) as shown in Table 1; therefore the reduction rate of Au3+ to Au0 by C2H2 can be significantly slowed down. It should be noted that although Au(CN)2− has the lowest electric potential, its fatal toxicity forbids its use in this system. Compared with –CN, –SCN and its related compounds have lower toxicity and better environmental friendliness, and can be applied in large quantities.
| Half-reaction | Electric potential (V) |
|---|---|
| Au3+ + 3e− = Au | 1.520 |
| AuCl4− + 2e− = AuCl2− + 2Cl− | 0.926 |
| AuBr4− + 2e− = AuBr2− + 2Br− | 0.802 |
| Au(SCN)4− + 2e− = Au(SCN)2− + 2SCN− | 0.623 |
| Au(SCN)4− + 3e− = Au + 4SCN− | 0.662 |
| AuBr2− + e− = Au + 2Br− | 0.960 |
| AuI2− + e− = Au + 2I− | 0.576 |
| Au(CN)2− + e− = Au + 2CN− | −0.596 |
| Au(SCN)2− + e− = Au + 2SCN− | 0.690 |
Experimental results and density functional theory (DFT) study indicate that the reduction of Au3+ is the main factor of deactivation, and the combination of –SCN and Au protects Au3+ from reduction by C2H2. A pilot-trial on a scale of 4 t a−1 was operated over 3000 h and showed the satisfactorily high reactivity (>95%) and selectivity (>99%) of VCM under gas hourly space velocity (GHSV, C2H2 based) of 30 h−1, a big step for future industrial applications.
Results and discussion
Lab-scale analysis
All tested catalysts’ names, chemical compositions, deactivation rates, selectivities and test times are collected in Table 2. The catalyst loading 0.50 wt% Au with HAuCl4 as the active precursor was named Catal. A. The catalyst loading 0.50 wt% Au and 0.50 wt% KSCN with HAuCl4 and KSCN as precursors was abbreviated as Catal. AS. The catalyst with HAuCl4, KSCN and CuCl2 as precursors was denoted as Catal. ACS, and Au loading was according to prefix description. The catalyst with HAuCl4, KCl and CuCl2 as precursors was called Catal. ACK (n(Au)![[thin space (1/6-em)]](https://www.rsc.org/images/entities/char_2009.gif) :
:![[thin space (1/6-em)]](https://www.rsc.org/images/entities/char_2009.gif) n(Cu)
n(Cu)![[thin space (1/6-em)]](https://www.rsc.org/images/entities/char_2009.gif) :
:![[thin space (1/6-em)]](https://www.rsc.org/images/entities/char_2009.gif) n(K) = 1
n(K) = 1![[thin space (1/6-em)]](https://www.rsc.org/images/entities/char_2009.gif) :
:![[thin space (1/6-em)]](https://www.rsc.org/images/entities/char_2009.gif) 5
5![[thin space (1/6-em)]](https://www.rsc.org/images/entities/char_2009.gif) :
:![[thin space (1/6-em)]](https://www.rsc.org/images/entities/char_2009.gif) 20, Au loading was 0.25 wt%). The catalyst with HAuCl4 and CuCl2 as precursors was named Catal. AC (n(Au)
20, Au loading was 0.25 wt%). The catalyst with HAuCl4 and CuCl2 as precursors was named Catal. AC (n(Au)![[thin space (1/6-em)]](https://www.rsc.org/images/entities/char_2009.gif) :
:![[thin space (1/6-em)]](https://www.rsc.org/images/entities/char_2009.gif) n(Cu) = 1
n(Cu) = 1![[thin space (1/6-em)]](https://www.rsc.org/images/entities/char_2009.gif) :
:![[thin space (1/6-em)]](https://www.rsc.org/images/entities/char_2009.gif) 5, Au loading was 0.25 wt%). All the catalysts were prepared by the incipient-wetness impregnation method.
5, Au loading was 0.25 wt%). All the catalysts were prepared by the incipient-wetness impregnation method.
| Catalyst name | Chemical composition | Deactivation rateb (% min−1) | Selectivity (%) | GHSV (h−1) |
|---|---|---|---|---|
| a We only present the composition of the optimized Catal. ACS here due to too many compositions in optimization. b Deactivation rate is defined as the value of the loss of conversion per minute during the deactivation stage, which is given by r = −ΔConversion (%)/Δt (min). | ||||
| Catal. A | 0.50 wt% Au | 0.047 | >99 | 1200 |
| Catal. AS | 0.50 wt% Au | — | >99 | 1200 |
| 0.50 wt% KSCN | ||||
| Catal. ACS | 0.25 wt% Au | 0.014 | >99 | 1200 |
| 1.62 wt% Cu | ||||
| 2.46 wt% KSCN | 0.008 | 360 | ||
| Catal. ACK | 0.25 wt% Au | 0.015 | >99 | 360 |
| 1.62 wt% Cu | ||||
| 1.89 wt% KCl | ||||
| Catal. AC | 0.25 wt% Au | 0.017 | >99 | 360 |
| 1.62 wt% Cu | ||||
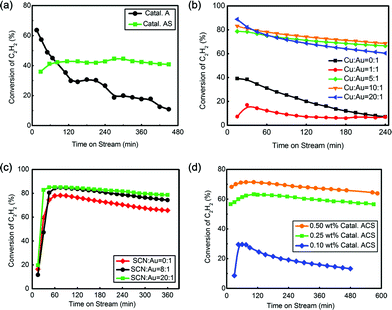
Fig. 1(a) shows that Catal. A had a good initial reactivity (40%) but too high deactivation rate (0.047% min−1). After coordination of –SCN, Catal. AS showed poorer initial reactivity (36%) but more promising stability than Catal. A, indicating actual promotion of –SCN in catalytic reactivity. To promote the catalytic performance of Au catalyst, Cu was introduced into this system.44,45 The optimized ratio of Cu![[thin space (1/6-em)]](https://www.rsc.org/images/entities/char_2009.gif) :
:![[thin space (1/6-em)]](https://www.rsc.org/images/entities/char_2009.gif) Au was determined by reactivity analysis as shown in Fig. 1(b). When the ratio of n(Cu)
Au was determined by reactivity analysis as shown in Fig. 1(b). When the ratio of n(Cu)![[thin space (1/6-em)]](https://www.rsc.org/images/entities/char_2009.gif) :
:![[thin space (1/6-em)]](https://www.rsc.org/images/entities/char_2009.gif) n(Au) increased from 0
n(Au) increased from 0![[thin space (1/6-em)]](https://www.rsc.org/images/entities/char_2009.gif) :
:![[thin space (1/6-em)]](https://www.rsc.org/images/entities/char_2009.gif) 1 to 5
1 to 5![[thin space (1/6-em)]](https://www.rsc.org/images/entities/char_2009.gif) :
:![[thin space (1/6-em)]](https://www.rsc.org/images/entities/char_2009.gif) 1, the reactivity reached the best at n(Cu)
1, the reactivity reached the best at n(Cu)![[thin space (1/6-em)]](https://www.rsc.org/images/entities/char_2009.gif) :
:![[thin space (1/6-em)]](https://www.rsc.org/images/entities/char_2009.gif) n(Au) = 5
n(Au) = 5![[thin space (1/6-em)]](https://www.rsc.org/images/entities/char_2009.gif) :
:![[thin space (1/6-em)]](https://www.rsc.org/images/entities/char_2009.gif) 1; however, with a ratio higher than 5
1; however, with a ratio higher than 5![[thin space (1/6-em)]](https://www.rsc.org/images/entities/char_2009.gif) :
:![[thin space (1/6-em)]](https://www.rsc.org/images/entities/char_2009.gif) 1, no apparent reactivity increase was observed. Because the catalyst with n(Cu)
1, no apparent reactivity increase was observed. Because the catalyst with n(Cu)![[thin space (1/6-em)]](https://www.rsc.org/images/entities/char_2009.gif) :
:![[thin space (1/6-em)]](https://www.rsc.org/images/entities/char_2009.gif) n(Au) = 5
n(Au) = 5![[thin space (1/6-em)]](https://www.rsc.org/images/entities/char_2009.gif) :
:![[thin space (1/6-em)]](https://www.rsc.org/images/entities/char_2009.gif) 1 had a relatively lower deactivation rate, 5
1 had a relatively lower deactivation rate, 5![[thin space (1/6-em)]](https://www.rsc.org/images/entities/char_2009.gif) :
:![[thin space (1/6-em)]](https://www.rsc.org/images/entities/char_2009.gif) 1 was selected as the optimized ratio in the following evaluation. The optimization of –SCN content was also implemented by increasing the ratio of n(SCN)
1 was selected as the optimized ratio in the following evaluation. The optimization of –SCN content was also implemented by increasing the ratio of n(SCN)![[thin space (1/6-em)]](https://www.rsc.org/images/entities/char_2009.gif) :
:![[thin space (1/6-em)]](https://www.rsc.org/images/entities/char_2009.gif) n(Au) from 0
n(Au) from 0![[thin space (1/6-em)]](https://www.rsc.org/images/entities/char_2009.gif) :
:![[thin space (1/6-em)]](https://www.rsc.org/images/entities/char_2009.gif) 1 to 40
1 to 40![[thin space (1/6-em)]](https://www.rsc.org/images/entities/char_2009.gif) :
:![[thin space (1/6-em)]](https://www.rsc.org/images/entities/char_2009.gif) 1. As shown in Fig. 1(c), when the ratio increased from 0
1. As shown in Fig. 1(c), when the ratio increased from 0![[thin space (1/6-em)]](https://www.rsc.org/images/entities/char_2009.gif) :
:![[thin space (1/6-em)]](https://www.rsc.org/images/entities/char_2009.gif) 1 to 20
1 to 20![[thin space (1/6-em)]](https://www.rsc.org/images/entities/char_2009.gif) :
:![[thin space (1/6-em)]](https://www.rsc.org/images/entities/char_2009.gif) 1, –SCN had a significant effect in preserving reactivity; however, no notable promotion was found when the ratio continued to increase (Fig. S5†), and a ratio of 20
1, –SCN had a significant effect in preserving reactivity; however, no notable promotion was found when the ratio continued to increase (Fig. S5†), and a ratio of 20![[thin space (1/6-em)]](https://www.rsc.org/images/entities/char_2009.gif) :
:![[thin space (1/6-em)]](https://www.rsc.org/images/entities/char_2009.gif) 1 was selected as the best value. Au loading was also investigated. The conversion of C2H2 decreased with decreasing Au content but the 0.25 wt% Catal. ACS (0.014% min−1) had a similar deactivation rate with 0.50 wt% Catal. ACS (0.013% min−1) and higher conversion than 0.10 wt% Catal. ACS. Comprehensively, 0.25 wt% Catal. ACS was selected as the optimized catalyst for our reaction system, abbreviated as Catal. ACS (0.25 wt% Au, n(Au)
1 was selected as the best value. Au loading was also investigated. The conversion of C2H2 decreased with decreasing Au content but the 0.25 wt% Catal. ACS (0.014% min−1) had a similar deactivation rate with 0.50 wt% Catal. ACS (0.013% min−1) and higher conversion than 0.10 wt% Catal. ACS. Comprehensively, 0.25 wt% Catal. ACS was selected as the optimized catalyst for our reaction system, abbreviated as Catal. ACS (0.25 wt% Au, n(Au)![[thin space (1/6-em)]](https://www.rsc.org/images/entities/char_2009.gif) :
:![[thin space (1/6-em)]](https://www.rsc.org/images/entities/char_2009.gif) n(Cu)
n(Cu)![[thin space (1/6-em)]](https://www.rsc.org/images/entities/char_2009.gif) :
:![[thin space (1/6-em)]](https://www.rsc.org/images/entities/char_2009.gif) n(SCN) = 1
n(SCN) = 1![[thin space (1/6-em)]](https://www.rsc.org/images/entities/char_2009.gif) :
:![[thin space (1/6-em)]](https://www.rsc.org/images/entities/char_2009.gif) 5
5![[thin space (1/6-em)]](https://www.rsc.org/images/entities/char_2009.gif) :
:![[thin space (1/6-em)]](https://www.rsc.org/images/entities/char_2009.gif) 20) in the next narration.
20) in the next narration.
Transmission electron microscopy (TEM) characterization (Fig. S6(a)†) showed that the detected particles in Catal. ACS were almost smaller than 10 nm, and X-ray diffraction (XRD) patterns (Fig. S10(c)†) of the fresh catalyst had no visible diffraction peaks of crystals, supposing good dispersion of active components. The scanning electron microscopy (SEM) image in Fig. S6(b)† is in good agreement with TEM and XRD detection. It has been confirmed previously that the introduction of Cu facilitates the dispersion of Au.44–46 The above characterization demonstrated well that the employment of thiocyanate (–SCN) had no negative influence on ion dispersion.
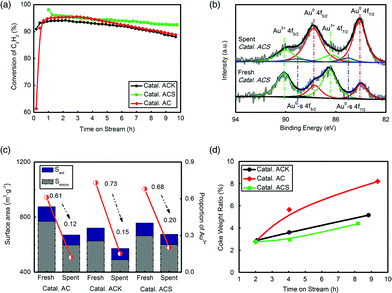
Three catalysts, Catal. ACS, Catal. ACK and Catal. AC, were evaluated to test their catalytic reactivity. 10 h testing in Fig. 2(a) shows that Catal. ACS had the lowest deactivation rate. The K had no apparent effect in inhibiting deactivation, but –SCN had a significant role in reactivity preservation. To find the stated changes of Au in the catalyst, X-ray photoelectron spectroscopy (XPS, ESCALAB 250Xi, Al Kα source) was systematically employed. The XPS data of Au were well fitted by decomposing the spectrum into Au 4f5/2 and Au 4f7/2 peaks. The binding energies at 89.8 ± 0.1 eV and 86.4 ± 0.1 eV were attributed to the Au3+ oxidation states, and those at 87.6 ± 0.1 eV and 83.9 ± 0.1 eV were attributed to the Au0 metal states.47–49 The amount of Au+ species was neglected because no observed peaks belonged to Au+ species. The most important feature of the XPS spectra was possibly that, in the preparation, small metallic gold clusters (hereafter labelled Au0-s) were also formed, the binding energy of which was ca. 1 eV higher than the Au 4f binding energy of the majority of the Au0 species.48,50 However, we considered the Au0-s species to be nothing more than a spectator species, since the reduced catalysts also contained these Au0-s nano-clusters and were inactive. Fig. 2(b) shows that the fresh Catal. ACS possessed more Au3+, and as the catalyst became inactive, Au3+ generally transformed into Au0 or Au0-s by reduction. Quantification of the Au species on the 3 catalysts’ surface was given by integrating the corresponding peaks’ area of Au 4f7/2 (Fig. 2(c) and Table S1†). Former studies indicated that the reduction of Au3+ led to catalyst deactivation,7,35 and the positive correlation of Au3+ proportion with C2H2 conversion in Catal. ACS here coincided with that. By comparison, Catal. ACS (from ca. 68% to ca. 20%) had better preservation of Au3+ than Catal. AC (from ca. 61% to ca. 12%) and Catal. ACK (from ca. 73% to ca. 15%).
BET analysis showed that the three catalysts’ surface areas all decreased after evaluation. The loss of micro surface dominated, which indicated that coke accumulated mainly in micropores. Similarly, Catal. ACS (Smicro from 663.8 m2 g−1 to 600.3 m2 g−1) had a better anti-coke ability than Catal. AC (Smicro from 768.9 m2 g−1 to 596.4 m2 g−1) and Catal. ACK (Smicro from 626.3 m2 g−1 to 489.6 m2 g−1). The coke rate test further confirmed this conclusion by recording the change of catalysts’ weight during the reaction.
Conventionally, Hg-based catalysts are too volatile to be stabilized in the catalysts over 200 °C. As a result, thermal stability is considered a very important factor for Hg-free catalysts. Au and Cu in Catal. ACS were decided using both an inductively coupled plasma optical emission spectrometer (ICP-OES) and XPS analysis. The two metals’ content showed no apparent changes, proving their good thermal stability. The minor difference in metal content between XPS and ICP was attributed to their different distribution tendencies on the surface or in the body of the substrate (Table 3). Au content derived from XPS was relatively lower than that from ICP, which meant that Au preferred to anchor in abundant micropores rather than on the surface. Cu had similar contents in the two analyses, showing its uniform loading in the catalyst.
| Measurement method | Catalyst type | Au (%) | Cu (%) | K (%) |
|---|---|---|---|---|
| XPS | Fresh catalyst | 0.16 | 0.41 | 1.11 |
| Spent catalyst | 0.15 | 0.41 | 1.05 | |
| ICP | Fresh catalyst | 0.23 | 0.41 | 1.08 |
| Spent catalyst | 0.21 | 0.40 | 0.97 |
Experimental results showed good catalytic promotion of –SCN; however, its mechanism needed further study. XPS measurements were conducted to check the S species. As shown in Fig. S7,† the binding energy of –R–S in Catal. ACS (163.0 eV) was 0.5 eV higher than that in KSCN (162.5 eV),51–53 which might be attributed to the electron transfer from S to Au. To exclude the possible effect of S2−, a catalyst with the name of Catal. ACS′ (0.25 wt% Au, n(HAuCl4)![[thin space (1/6-em)]](https://www.rsc.org/images/entities/char_2009.gif) :
:![[thin space (1/6-em)]](https://www.rsc.org/images/entities/char_2009.gif) n(CuCl2)
n(CuCl2)![[thin space (1/6-em)]](https://www.rsc.org/images/entities/char_2009.gif) :
:![[thin space (1/6-em)]](https://www.rsc.org/images/entities/char_2009.gif) n(Na2S) = 1
n(Na2S) = 1![[thin space (1/6-em)]](https://www.rsc.org/images/entities/char_2009.gif) :
:![[thin space (1/6-em)]](https://www.rsc.org/images/entities/char_2009.gif) 5
5![[thin space (1/6-em)]](https://www.rsc.org/images/entities/char_2009.gif) :
:![[thin space (1/6-em)]](https://www.rsc.org/images/entities/char_2009.gif) 20) was employed for comparison. As shown in Fig. S8,†Catal. ACS′ had poorer reactivity and stability than Catal. ACS, which confirmed the conclusion that the interaction of –SCN and Au improved the reactivity performance.
20) was employed for comparison. As shown in Fig. S8,†Catal. ACS′ had poorer reactivity and stability than Catal. ACS, which confirmed the conclusion that the interaction of –SCN and Au improved the reactivity performance.
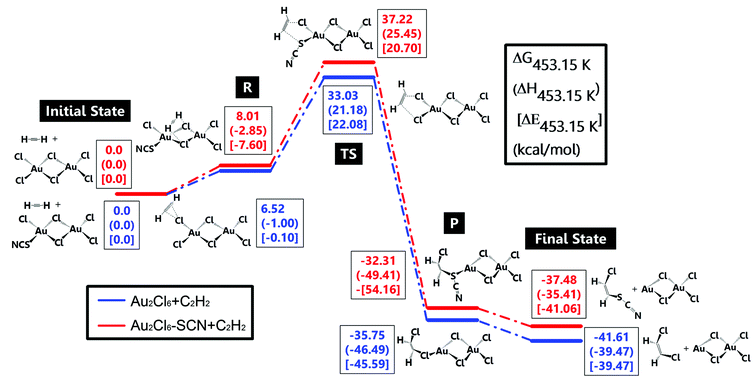
A detailed DFT study was also conducted here to discuss the role of –SCN in reactivity preservation. Jinli Zhang et al.40 studied the reaction and deactivation mechanism of Au2Cl6 and speculated that reduction of Au3+ from C2H2 might be the key factor of deactivation. Therefore, we compared the reduction possibility of Au2Cl6 and Au2Cl5–SCN, where the latter one was thought to be the primary structure of complexing. Two reaction paths for C2H2 hydrochlorination are shown in Fig. 3. Au2Cl6/Au2Cl5–SCN and C2H2 without any interaction were chosen as the initial state. As C2H2 moved closely towards Au2Cl6/Au2Cl5–SCN, the C atom in C2H2 began to interact with Cl in Au2Cl6/Au2Cl5–SCN. The stable adsorption structures of C2H2–Au2Cl6/Au2Cl5–SCN were defined to be reactants ‘R’. It should be noted that C2H2 preferred to interact with the Cl atom at the top position in the Au2Cl5–SCN (Fig. S9(a)†) and with Cl at the side in the Au2Cl6 (Fig. S9(b)†). The energy also showed a slight difference between each other: C2H2–Au2Cl5–SCN (8.01 kcal mol−1) was 1.49 kcal mol−1 higher than C2H2–Au2Cl6 (6.52 kcal mol−1). As C in the C2H2 went on interacting with the Au catalyst, it derived a Cl atom and formed bonds with it, which were called products ‘P’. The ‘final state’ referred to the desorbed hydrocarbon derivatives and the deactivated catalyst without any interaction. The transition state ‘TS’ showed that the energy of C2H2–Au2Cl5–SCN (Fig. S9(c),† 37.22 kcal mol−1) was 4.19 kcal mol−1 higher than C2H2–Au2Cl6 (Fig. S9(d),† 33.03 kcal mol−1), which could not be ignored. Besides, the energy barrier (energy between ‘TS’ and ‘R’) in C2H2–Au2Cl5–SCN was 2.7 kcal mol−1 higher than that in C2H2–Au2Cl6, proving the low possibility of SCN-complexing catalyst to deactivate. Having significant steric effects and similar chemical properties as halogen might be the reason why –SCN had better stability promotion than –Cl. We could imagine that when Au complexed with more –SCN, it would possess more anti-reduction ability. The detailed energy change in this DFT study is listed in Tables S3 and S4.† The DFT study showed the promising effect in anti-reduction by C2H2; however, the other promotion of SCN-complexing in anti-deactivation should be further studied.
The reactivity of Catal. ACS was measured using the value of turnover frequency (TOF). The Au nanoparticles had a mean diameter of 6.3 nm by counting hundreds of particles according to the TEM analysis (see Fig. 4(a)). Following the calculation procedure of the Hutchings group's method,7 the TOF was 5.9 s−1, which was different from the linear relationship as Fig. 4(b) shows. Although the effect of Cu in activity should not be ignored, its contribution was relatively poor;3–7 the main role of Cu in promoting the catalyst's activity is to promote the dispersion; therefore the calculation excluded the influence of Cu.
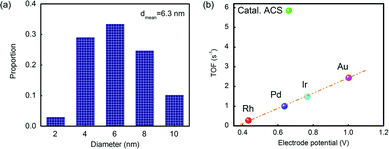 | ||
| Fig. 4 (a) The statistics of the particles’ diameter in Catal. ACS; (b) correlation between initial C2H2 conversions versus the standard electrode potential of Catal. ACS and various other metals.38 Potentials are obtained from the reduction potentials of the chloride salts (RhCl6)3−, PdCl2, (IrCl6)3− and (AuCl4)− to the corresponding metals. | ||
Scaling up trial
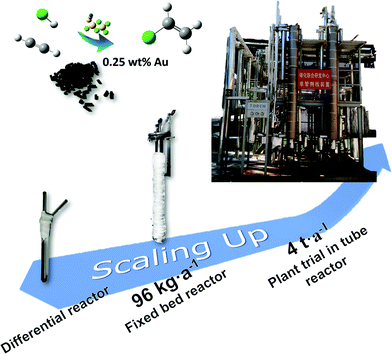
The industrial performance of Catal. ACS was evaluated under 96 kg a−1 and 4 t a−1 scale trials (VCM weight based). In a 96 kg a−1 scale fixed bed reactor, 60 g catalyst was synthesized following the same preparation procedures in the lab. During 200 h testing, the conversion and selectivity were above 95% and 99%, respectively. Three types of spent catalysts in different locations of the reactor, the upper layer, the middle layer and the bottom layer (Fig. S10(a)†), were collected to understand the deactivation rule. XRD patterns in Fig. S10(c)† show that the peaks indicating Au particles became sharper and higher from the bottom to the upper layer. Combined with the reactivity evaluation in Fig. S10(d),† we could conclude that increasing size of Au particles caused less utilization ratio of Au, which was thought to be a sign of deactivation.Although the catalyst showed advanced ability in inhibiting coke accumulation, coke might still affect the catalyst performance during the evaluation. The spent catalysts had visible decrease in the surface area (Fig. S11†), while the values from different layers had slight differences, which might be attributed to the limited evaluation time. Hutchings et al.54 tried to verify by-products through collecting reaction products in a chloroform trap at the outlet of the reactor and found haloalkane. However, the coke was not further studied before. To check the coke species, gas chromatography-mass spectrometry (GC-MS) was employed. Cyclohexane was applied as the solvent to soak the crushed catalysts for hours at room temperature. The supernatant was used to quantify the ratio of coke species. As shown in Fig. S12,† coke in three layers was mainly aromatic hydrocarbon or derivatives of aromatic hydrocarbons. The hydrocarbons containing benzene rings were not so volatile, and it might be accumulated and covered on the surface. In addition, derivatives of aromatic hydrocarbons containing O and N were also found. The oxygen might come from the catalyst or reaction gases. When the feeding gases passed through the catalyst layers, the contained O was consumed gradually. The presence of N-containing compounds was thought to be originating from decomposition of –SCN, a sign of deactivation of the catalyst.
Neither Au-particles growth nor loss of N was a direct indication of deactivation. Therefore, to find out a more essential factor of reactivity, a pilot-trial with 4 t a−1 scale was further evaluated. This trial has been running for over 3000 h.
The flow chart of the process is shown in Fig. S13.† 4.6 L of catalyst was filled in the single tube fixed bed reactor. Three pipelines deliver N2, HCl and reactant gases (C2H2 and HCl, Q(C2H2)![[thin space (1/6-em)]](https://www.rsc.org/images/entities/char_2009.gif) :
:![[thin space (1/6-em)]](https://www.rsc.org/images/entities/char_2009.gif) Q(HCl) = 1.0
Q(HCl) = 1.0![[thin space (1/6-em)]](https://www.rsc.org/images/entities/char_2009.gif) :
:![[thin space (1/6-em)]](https://www.rsc.org/images/entities/char_2009.gif) 1.1 L h−1
1.1 L h−1![[thin space (1/6-em)]](https://www.rsc.org/images/entities/char_2009.gif) :
:![[thin space (1/6-em)]](https://www.rsc.org/images/entities/char_2009.gif) L h−1) respectively, and their flow rates are controlled by mass flowmeters. Gases need warming up by going through preheaters before entering into the reactor. The catalyst's temperature is recorded by 13 thermocouples (named T101–T113) distributed in the reactor with 30 cm distance vertically between each other.
L h−1) respectively, and their flow rates are controlled by mass flowmeters. Gases need warming up by going through preheaters before entering into the reactor. The catalyst's temperature is recorded by 13 thermocouples (named T101–T113) distributed in the reactor with 30 cm distance vertically between each other.
The pre-treatment was operated following drying and activation procedures. N2 and HCl, which played the roles of drying and activation, respectively, were fed into the reactor in order under the GHSV of 60 h−1 for 4 h separately at 130 °C. After that, the reaction began and mixed reactant gases were input throughout the catalyst layers under the GHSV of 60 h−1. During the reaction, the space velocity increased generally from 20 h−1 to 30 h−1 by increasing the flow rate (Fig. 5(a)). After 3000 h evaluation, the conversion was still above 95% and the selectivity tested by a flame ionization detector (FID) was always above 99% (Fig. 5(b) and Table S5†), which showed that complexing –SCN enabled the catalyst with a long lifespan and good catalytic performance.
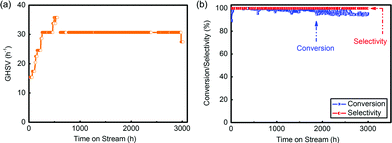 | ||
| Fig. 5 (a) GHSV during the evaluation of the pilot-trial analysis; (b) conversion and selectivity in this 3000 h evaluation. | ||
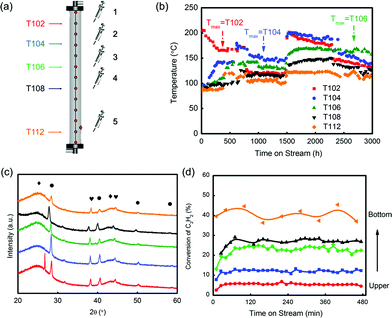
During the evaluation, temperatures were recorded in five selected layers, which were T102, T104, T106, T108 and T112 (Fig. 6(a) and (b)). In the beginning, the temperature in layer 1 (labelled as T102) had the highest temperature, and it dropped linearly from 200 °C. As the reaction continued over 500 h, T104 in layer 2 generally became higher than T102 and became the highest. It was found that after 2500 h testing, the hot spot shifted to T106, which was in the middle position of the reactor. The catalyst in layer 5 (T112) had the lowest temperature at all times, suggesting a less intense reaction in this position. The spent catalysts in five different layers were selected to verify the deactivation rule for hydrochlorination of C2H2. As shown in Fig. 6(c), the XRD patterns of the spent catalysts were similar to that of the test in the fixed bed reactor, which obeyed the conclusion that Au particles grew larger from the bottom layer to the upper layer. Besides, the five spent catalysts had significant difference in reactivity as shown in Fig. 6(d). Under the evaluation conditions of 180 °C and 360 h−1, the catalyst in layer 5 had around 40% conversion while the one in layer 1 had only 4% conversion. That is to say, catalysts’ deactivation became more severe from the bottom to the upper layer.
The BET test showed that the surface area of the five spent catalysts (the distance of layers 1–5 from the reactor top is 30, 90, 150, 210 and 330 cm, respectively) decreased from layer 5 to layer 1 as shown in Fig. S14,† but the differences in the values were not significant, showing that the loss of surface area was not likely the key factor of deactivation.
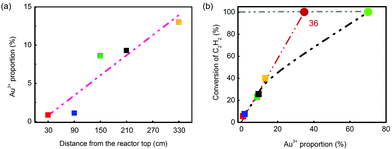
Au species of the five spent catalysts were quantified by XPS spectra of Au 4f7/2, and three species, Au0, Au3+ and Au0-s, were identified (Table 4). The value of Au3+/(Au3+ + Au0 + Au0-s) was defined as Au3+ proportion, which increased from the catalyst in layer 1 (0.86%) to that in layer 5 (13.0%). ICP analysis, which had good precision, was applied to detect Au content. Repeated analysis showed lower than 5% error with each other, and the Au content was listed in Table S6.† Using these Au contents, the correlation of Au3+ content with conversion of C2H2 was also calculated and listed in Table S7.† According to the converted C2H2 and Au content, it was clear that the value of n(C2H2)converted/n(Au3+) remained almost constant at 3.3 s−1, while the value of n(C2H2)converted/n(Au) had no such consistency. The unusual data in layers 1 and 2 might be from the low conversion of C2H2 or unestimated factors of grain size. It should be noted that the value of n(C2H2)converted/n(Au3+) was different from the TOF value due to lack of consideration of particle distribution in its calculation.
| Layer | Species | Position (eV) | Area | Au3+/(Au3+ + Au0 + Au0-s) |
|---|---|---|---|---|
| 1 | Au0 4f7/2 | 84.15 | 118.36 | 0.86% |
| Au3+4f7/2 | 86.52 | 1.2 | ||
| Au0-s | 84.93 | 20.22 | ||
| 2 | Au0 4f7/2 | 84.22 | 183.64 | 1.1% |
| Au3+4f7/2 | 86.37 | 2.81 | ||
| Au0-s | 84.9 | 74.42 | ||
| 3 | Au3+4f7/2 | 86.42 | 25.63 | 8.6% |
| Au0 4f7/2 | 84.25 | 226.81 | ||
| Au0-s | 84.95 | 38.80 | ||
| 4 | Au0 4f7/2 | 84.27 | 127.55 | 9.3% |
| Au3+4f7/2 | 86.5 | 15.43 | ||
| Au0-s | 84.95 | 22.40 | ||
| 5 | Au0 4f7/2 | 84.24 | 310.47 | 13.0% |
| Au3+4f7/2 | 86.51 | 57.70 | ||
| Au0-s | 84.79 | 89.35 |
Apart from that, the Au3+ proportion (the Au3+ content was nearly the same) was correlated with catalyst positions and conversion of C2H2. Fig. 7 shows that both sets of data had very good linearity, which indicated that Au3+ was similarly the most essential factor of reactivity in converting C2H2 into VCM. However, the conversion of fresh catalyst did not obey the rule (Fig. 7(b)); that might be attributed to over-rich Au3+ cations. The critical point could be derived from the intersection of the extension cord of data points and the line of 100% conversion, which was 36%. That is to say, to totally convert the C2H2, 36% Au3+ is enough in 0.25 wt% Catal. ACS. However, it should be noted here that this conclusion was only derived from Catal. ACS and may not be suitable for other catalysts as the catalysts’ accessory ingredients or complexing ligand would together affect their performance. Therefore, possessing high Au3+ proportion (68%) in the fresh one, the catalyst could continue to reduce the usage of Au to a further low value, which was a very good sign of its applications in the chlor-alkali industry.
Conclusions
Overall, we have outlined how the outstanding properties of the thiocyanate-complexed Au catalyst, a biocompatible non-toxic metal, can be molded upon new processes based on the hydrochlorination. The optimized catalyst loading of only 0.25 wt% Au has good reactivity and low deactivation rate (0.014% min−1 at GHSV = 1200 h−1) with a TOF value as high as 5.9 s−1. As a complexing ligand, –SCN can interact with Au cations and reduce the electric potential of Au cations significantly from 0.926 V to 0.662 V. A DFT study shows that complexing increases the energy barrier of the reaction with C2H2 and prevents Au catalyst from quickly deactivating. As a result, the catalytic reactivity and stability are promoted effectively. The scaling up trial proves that the deactivation is a linear process, the loss of Au3+ rather than coke being the main factor. Over 3000 h 4 t a−1 industrial testing shows the catalyst's promising performance with >95% conversion and >99% selectivity, which well meets applications in the chlor-alkali industry. The green and efficient catalytic process provides an applicable core-catalyst for sustainable development of PVC in China.Experimental
Catalyst preparation
The catalyst was prepared by the impregnation method. HAuCl4·H2O (M = 357.80 g mol−1) and CuCl2·2H2O (M = 170.48 g mol−1, Sinopharm Chemical Reagent Co., Ltd, Beijing) were employed as the precursors of active components. Columnar coconut shell charcoal, one type of carbon, was selected as the catalyst substrate because its abundant surface functional groups can facilitate the dispersion of metal cations. The substrate features 3 mm mean diameter, 15 mm mean length and ca. 0.44 g mL−1 packing density. The complexing ligand (–SCN) supplier in the form of KSCN (M = 97.18 g mol−1, Beijing Chemical Works) was introduced to coordinate Au cations.The typical preparation of the catalyst proceeded as follows: first, the carbon substrate was impregnated in aqua regia for 10 h, washed with deionized water 3 times and then dried at 120 °C for 10 h as a pretreatment for further use. HAuCl4·H2O and CuCl2·2H2O were weighed ca. 0.045 g and 0.268 g respectively and then dissolved in 17.5 mL deionized water to form an aqueous solution. 10 g pretreated carbon substrate was mixed with the aqua solution and 5 mL 0.5 M KSCN solution was added into the mixture dropwise under continuous stirring. The paste formed was ground at 60 °C for 2 h and dried at 120 °C for 9 h in static air. The catalyst was preserved in dry surroundings at room temperature after preparation. To facilitate the evaluation in differential reactors, the catalyst was milled and sieved into 30–60 mesh, with an average particle size of 380 μm and a packing density of 0.48 g mL−1.
Catalytic evaluation
The catalytic behavior was tested in fixed bed reactors in different scales according to the usage of the catalyst. As shown in Fig. 8, the U-shaped silica tube with 6 mm inner diameter loaded with 0.15 g catalyst was applied in the lab-scale test, and the fixed bed reactors with 30 mm and 80 mm inner diameters were applied to load 60 g and 2.5 kg catalyst, respectively, for progressively scaling-up tests.Typically, the evaluation operations were conducted with the following procedures. 0.15 g catalyst was weighed and filled in the silica tube. By continuously feeding N2, the catalyst was heated at 120 °C and dried for 15 min. Activation was started by feeding HCl at 180 °C for 15 min. Both GHSV of N2 and HCl were selected as 120 h−1 (volume based). The reaction was carried out after activation at 1 atm and 180 °C. The reactants were fed with a mixed flow comprising HCl![[thin space (1/6-em)]](https://www.rsc.org/images/entities/char_2009.gif) :
:![[thin space (1/6-em)]](https://www.rsc.org/images/entities/char_2009.gif) C2H2
C2H2![[thin space (1/6-em)]](https://www.rsc.org/images/entities/char_2009.gif) :
:![[thin space (1/6-em)]](https://www.rsc.org/images/entities/char_2009.gif) H2 = 1.1
H2 = 1.1![[thin space (1/6-em)]](https://www.rsc.org/images/entities/char_2009.gif) :
:![[thin space (1/6-em)]](https://www.rsc.org/images/entities/char_2009.gif) 1.0
1.0![[thin space (1/6-em)]](https://www.rsc.org/images/entities/char_2009.gif) :
:![[thin space (1/6-em)]](https://www.rsc.org/images/entities/char_2009.gif) 0.083 with 1200 h−1 GHSV of C2H2. It should be noted that the feeding time of N2 and HCl in the plant trial and the GHSV of C2H2 were determined according to the evaluation scale.
0.083 with 1200 h−1 GHSV of C2H2. It should be noted that the feeding time of N2 and HCl in the plant trial and the GHSV of C2H2 were determined according to the evaluation scale.
Analysis and characterization
The catalytic activity and selectivity of the catalyst were evaluated by conversion of C2H2 collected at the outlet of the reactor, and the product was sampled every 15 min, which was analysed via gas chromatography (GC, Tianmei, GC-7890 T). The column was selected from Beijing Analysis Instrument Co., Ltd with the type GDX-301. The selectivity of VCM was monitored by the FID through a capillary column (Agilent, DB-1) each hour. SEM (JEOL JSM-7401, at 3.0 kV) and TEM (JEOL JEM-2010, at 120.0 kV) were utilized to examine the micromorphology and detailed structures of the catalyst before and after the reaction. The Brunauer–Emmett–Teller (BET) specified surface areas of the samples were measured by N2 adsorption/desorption at liquid-N2 temperature using an Autosorb-IQ2-MP-C system. Before measurements, the sample was degassed at 300 °C until a manifold pressure of 2 mmHg was reached. The elemental composition and chemical state of elements were analyzed by XPS (ESCALAB 250Xi, Al Kα source). XRD (D8 ADVANCE diffractometer) was applied to reveal information about the crystal structure, chemical composition, and physical properties of the compositions. To further understand the element composition in the catalyst, ICP-OES (IRIS Intrepid II XSP) was employed.DFT study methods
All calculations were carried out using the Gaussian 03 program package.40,55 The geometrical optimizations of the reactants, products, intermediates and transition states were performed using Becke's three-parameter exchange functional,56 and the nonlocal correlation functional of Lee, Yang, and Parr57 (B3LYP) with the 6-31G(d) basis set for all atoms except Au, which was described by the Lanl2dz pseudo-potential basis set. Harmonic vibrational frequency calculations were performed at the same level in order to confirm various stationary points as either a minimum or a transition structure (TS). Intrinsic reaction coordinate (IRC)58,59 calculations were carried out to confirm the connection of each TS to its corresponding reactants and products. All charge analyses reported were calculated by natural bond orbital (NBO) analysis.60 The discussed energies are relative Gibbs free energies (ΔG453.15 K) under reaction conditions. The relative enthalpies (ΔH453.15 K) and ZPE corrected electronic energies (ΔE0 K) are also provided for reference.Acknowledgements
This work was supported by the Natural Scientific Foundation of China (no. 736004), the Ministry of Science and Technology of China (project no. 2008BAB41B02) and the National High Technology Research and Development Program of China (project no. 2012AA062901). We also greatly appreciate help on plant trial support from Mr Jiangkun Si, Mr Wenhu Hu and Mr Rui Xia and the help on DFT study by Ms Silei Xiong from the School of Chemical Engineering, Purdue University, U.S.A.Notes and references
- A. Gennadios, M. A. Hanna and L. B. Kurth, Lebensm.-Wiss. Technol., 1997, 30, 337–350 CrossRef CAS.
- J. Bing and C. Li, Polyvinyl Chloride, 2011, 39, 1–8 Search PubMed.
- G. J. Hutchings and R. Joffe, Appl. Catal., 1986, 20, 215–218 CrossRef.
- G. J. Hutchings, Catal. Today, 2002, 72, 11–17 CrossRef CAS.
- M. Conte, C. J. Davies, D. J. Morgan, T. E. Davies, A. F. Carley, P. Johnston and G. J. Hutchings, Catal. Sci. Technol., 2013, 3, 128–134 CAS.
- G. J. Hutchings, Top. Catal., 2008, 48, 55–59 CrossRef CAS.
- M. Conte, C. J. Davies, D. J. Morgan, T. E. Davies, D. J. Elias, A. F. Carley, P. Johnston and G. J. Hutchings, J. Catal., 2013, 297, 128–136 CrossRef CAS PubMed.
- A. S. K. Hashmi and M. Buehrle, Aldrichimica Acta, 2010, 43, 27–33 CAS.
- M. Zhu, L. Kang, Y. Su, S. Zhang and B. Dai, Can. J. Chem., 2013, 91, 120–125 CrossRef CAS.
- H. Zhang, B. Dai, X. Wang, W. Li, Y. Han, J. Gu and J. Zhang, Green Chem., 2013, 15, 829–836 RSC.
- G. J. Hutchings, J. Catal., 1985, 96, 292–295 CrossRef CAS.
- B. Nkosi, N. J. Coville, G. J. Hutchings, M. D. Adams, J. Friedl and F. E. Wagner, J. Catal., 1991, 128, 366–377 CrossRef CAS.
- B. Nkosi, N. J. Coville and G. J. Hutchings, J. Chem. Soc., Chem. Commun., 1988, 71–72 RSC.
- B. Nkosi, N. J. Coville and G. J. Hutchings, Appl. Catal., 1988, 43, 33–39 CrossRef CAS.
- K. Zhou, J. C. Jia, X. G. Li, X. D. Pang, C. H. Li, J. Zhou, G. H. Luo and F. Wei, Fuel Process. Technol., 2013, 108, 12–18 CrossRef CAS PubMed.
- S. J. Wang, B. X. Shen and Q. L. Song, Catal. Lett., 2010, 134, 102–109 CrossRef CAS.
- X. Li, X. Pan and X. Bao, J. Energy Chem., 2014, 23, 131–135 CrossRef CAS.
- X. Li, Y. Wang, L. Kang, M. Zhu and B. Dai, J. Catal., 2014, 311, 288–294 CrossRef CAS PubMed.
- K. Zhou, B. Li, Q. Zhang, J. Q. Huang, G. L. Tian, J. C. Jia, M. Q. Zhao, G. H. Luo, D. S. Su and F. Wei, ChemSusChem, 2014, 7, 723–728 CrossRef CAS PubMed.
- X. Li, X. Pan, L. Yu, P. Ren, X. Wu, L. Sun, F. Jiao and X. Bao, Nat. Commun., 2014, 5, 3688 Search PubMed.
- K. Zhou, W. Wang, F. Wei, J. K. Si, C. H. Li and J. Zhou, CN102631942, 2012 Search PubMed.
- X. Zhang, H. Shi and B.-Q. Xu, J. Catal., 2011, 279, 75–87 CrossRef CAS PubMed.
- A. S. K. Hashmi and G. J. Hutchings, Angew. Chem., Int. Ed., 2006, 45, 7896–7936 CrossRef PubMed.
- C. Marco and H. Graham, Modern Gold Catalyzed Synthesis, Wiley-VCH Verlag GmbH & Co. KGaA, 2012 Search PubMed.
- R. J. H. Grisel, P. J. Kooyman and B. E. Nieuwenhuys, J. Catal., 2000, 191 Search PubMed.
- M. Haruta and M. Date, Appl. Catal., A, 2001, 222 Search PubMed.
- A. Wittstock, V. Zielasek, J. Biener, C. M. Friend and M. Baeumer, Science, 2010, 327 Search PubMed.
- N. Yi, R. Si, H. Saltsburg and M. Flytzani-Stephanopoulos, Energy Environ. Sci., 2010, 3 Search PubMed.
- X. Zhang, H. Shi and B. Q. Xu, J. Catal., 2011, 279, 75–87 CrossRef CAS PubMed.
- M. Haruta, T. Kobayashi, H. Sano and N. Yamada, Chem. Lett., 1987, 405–408 CrossRef CAS.
- R. M. Finch, N. A. Hodge, G. J. Hutchings, A. Meagher, Q. A. Pankhurst, M. R. H. Siddiqui, F. E. Wagner and R. Whyman, Phys. Chem. Chem. Phys., 1999, 1, 485–489 RSC.
- N. Dimitratos, J. A. Lopez-Sanchez and G. J. Hutchings, Top. Catal., 2009, 52 Search PubMed.
- B. K. Min and C. M. Friend, Chem. Rev., 2007, 107 Search PubMed.
- L. Prati, P. Spontoni and A. Gaiassi, Top. Catal., 2009, 52 Search PubMed.
- B. Nkosi, M. D. Adams, N. J. Coville and G. J. Hutchings, J. Catal., 1991, 128, 378–386 CrossRef CAS.
- S. A. Mitchenko, E. V. Khomutov, A. A. Shubin and I. P. Beletskaya, Kinet. Catal., 2004, 45, 391–393 CrossRef CAS.
- K. Shinoda, Chem. Lett., 1975, 219–220 CrossRef CAS.
- M. Conte, A. F. Carley, G. Attard, A. A. Herzing, C. J. Kiely and G. J. Hutchings, J. Catal., 2008, 257, 190–198 CrossRef CAS PubMed.
- H. Zhang, B. Dai, X. Wang, L. Xu and M. Zhu, J. Ind. Eng. Chem., 2012, 18, 49–54 CrossRef CAS PubMed.
- J. Zhang, Z. He, W. Li and Y. Han, RSC Adv., 2012, 2, 4814–4821 RSC.
- F. Liu, F. Wei, G. L. Li, Y. Cheng, L. Wang, G. H. Luo, Q. Li, Z. Qian, Q. Zhang and Y. Jin, Ind. Eng. Chem. Res., 2008, 47, 8582–8587 CrossRef CAS.
- X. B. Wei, H. B. Shi, W. Z. Qian, G. H. Luo, Y. Jin and F. Wei, Ind. Eng. Chem. Res., 2009, 48, 128–133 CrossRef CAS.
- J. J. Jia, X. G. Li, G. H. Luo, K. Zhou and F. Wei, Chin. J. Process Eng., 2012, 12, 510–515 CAS.
- C. L. Bracey, P. R. Ellis and G. J. Hutchings, Chem. Soc. Rev., 2009, 38, 2231–2243 RSC.
- S. Wang, B. Shen and Q. Song, Catal. Lett., 2010, 134, 102–109 CrossRef CAS.
- M. Conte, A. F. Carley, G. Attard, A. A. Herzing, C. J. Kiely and G. J. Hutchings, J. Catal., 2009, 266, 164–164 CrossRef CAS PubMed.
- Q. Fu, H. Saltsburg and M. Flytzani-Stephanopoulos, Science, 2003, 301, 935–938 CrossRef CAS PubMed.
- C. N. R. Rao, V. Vijayakrishnan, H. N. Aiyer, G. U. Kulkarni and G. N. Subbanna, J. Phys. Chem., 1993, 97, 11157–11160 CrossRef CAS.
- T. Matsumoto, P. Nickut, T. Sawada, H. Tsunoyama, K. Watanabe, T. Tsukuda, K. Al-Shamery and Y. Matsumoto, Surf. Sci., 2007, 601, 5121–5126 CrossRef CAS PubMed.
- T. V. Choudhary and D. W. Goodman, Top. Catal., 2002, 21, 25–34 CrossRef CAS.
- M. Kozlowski, Fuel, 2004, 83, 259–265 CrossRef CAS PubMed.
- R. Pietrzak, T. Grzybek and H. Wachowska, Fuel, 2007, 86, 2616–2624 CrossRef CAS PubMed.
- G. Gryglewicz, P. Wilk, J. Yperman, D. V. Franco, I. I. Maes, J. Mullens and L. C. VanPoucke, Fuel, 1996, 75, 1499–1504 CrossRef CAS.
- M. Conte, A. F. Carley, C. Heirene, D. J. Willock, P. Johnston, A. A. Herzing, C. J. Kiely and G. J. Hutchings, J. Catal., 2007, 250, 231–239 CrossRef CAS PubMed.
- M. J. Frisch, Gaussian 03, Revision E.01, Gaussian, Inc., Pittsburgh, PA, 2004 Search PubMed.
- A. D. Becke, J. Chem. Phys., 1993, 98, 5648–5652 CrossRef CAS PubMed.
- C. T. Lee, W. T. Yang and R. G. Parr, Phys. Rev. B: Condens. Matter, 1988, 37, 785–789 CrossRef CAS.
- C. Gonzalez and H. B. Schlegel, J. Chem. Phys., 1989, 90, 2154–2161 CrossRef CAS PubMed.
- C. Gonzalez and H. B. Schlegel, J. Phys. Chem., 1990, 94, 5523–5527 CrossRef CAS.
- E. D. Glendening, J. K. Badenhoop, A. E. Reed, J. E. Carpenter and F. Weinhold, NBO 4.M, University of Wisconsin, Theoretical Chemistry Institute, Madison, WI, 1999 Search PubMed.
Footnote |
| † Electronic supplementary information (ESI) available. See DOI: 10.1039/c4gc00795f |
| This journal is © The Royal Society of Chemistry 2015 |

