Characterization and biodegradation behavior of bio-based poly(lactic acid) and soy protein blends for sustainable horticultural applications
Shengzhe
Yang
a,
Samy A.
Madbouly
*ab,
James A.
Schrader
c,
Gowrishankar
Srinivasan
d,
David
Grewell
d,
Kenneth G.
McCabe
c,
Michael R.
Kessler
 e and
William R.
Graves
c
aDepartment of Materials Science and Engineering, Iowa State University, Ames, IA, USA. E-mail: Madbouly@iastate.edu
bDepartment of Chemistry, Faculty of Science, Cairo University, Orman-Giza, Egypt
cDepartment of Horticulture, Iowa State University, Ames, IA, USA
dDepartment of Agriculture and Biosystems Engineering, Iowa State University, Ames, IA, USA
eSchool of Mechanical and Materials Engineering, Washington State University, Pullman, WA, USA
First published on 16th September 2014
Abstract
Adipic anhydride-plasticized soy protein (SP.A) was blended with poly(lactic acid) (PLA) at two concentrations (50/50 and 33/67) and was evaluated for use as a sustainable replacement for petroleum plastic in horticulture crop containers. Following the discovery that SP.A/PLA blends provide additional functions above that of petroleum plastic for this application, the present study evaluates the biodegradation behavior of these materials in soil and describes the substantial improvements in sustainability that result from the additional functions (intrinsic fertilizer and root improvement of plants) and the end-of-life option of biodegradation. After being buried in soil for designated time intervals, the residual degraded samples were analyzed to determine morphological and thermal properties at sequential stages of biodegradation. Samples were characterized by scanning electron microscopy (SEM), dynamic mechanical analysis (DMA), differential scanning calorimetry (DSC), and thermogravimetric analysis (TGA). The results indicated that there was a compatible system between SP.A and PLA in the melt. Incorporation of SP.A accelerated the biodegradation rate of this binary blend significantly compared with pure PLA. Prior to the degradation process, both the glass transition temperatures and melting temperatures of the blends containing SP.A decreased as the concentration of the soy protein increased. With increasing degradation time of the blended samples in soil, the glass transition temperatures increased in the early stages of biodegradation then decreased, a trend associated with the decrease in the molecular weight of the blends as a result of biodegradation. In addition, the thermal stability of blends increased gradually with increasing degradation time, suggesting faster biodegradation loss of the soy component of the SP.A/PLA blends. These results support the use of soy-based polymer blends for horticulture crop containers and provide data for evaluating their use as sustainable materials for other potential applications.
Introduction
Growing concern regarding the environmental costs of products made from fossil carbon has prompted the development, evaluation, and use of sustainable, bio-based alternatives to petroleum-based polymers. Bio-based polymers and composites have been widely considered for use in agricultural, industrial, and medical applications due to their excellent biocompatibility and biodegradability.1–14 The amount of single-use plastic consumed in agricultural systems is extensive, an issue that has generated a strong desire to develop biorenewable products that can satisfy the needed function, then biodegrade in soil under natural field conditions.15 In the United States alone, the container-crops horticulture industry uses over 4 billion single-use petroleum-based plant containers per year, a number that amounts to over 750![[thin space (1/6-em)]](https://www.rsc.org/images/entities/char_2009.gif) 000 metric tons of non-renewable, non-degradable material, 98% of which is disposed in landfills.16 Because of soil contaminates after use and risks of transferring pathogens to the next crop cycle, plastic plant containers are rarely re-used or recycled. This practice represents a serious problem with sustainability related to the consumption of finite resources and the environmental burden of large amounts of non-degradable solid waste.17
000 metric tons of non-renewable, non-degradable material, 98% of which is disposed in landfills.16 Because of soil contaminates after use and risks of transferring pathogens to the next crop cycle, plastic plant containers are rarely re-used or recycled. This practice represents a serious problem with sustainability related to the consumption of finite resources and the environmental burden of large amounts of non-degradable solid waste.17
Among the renewable bio-based polymers, Poly(lactic acid) (PLA) is one of the most promising commercially available polymers on the market. The common method for production of commercial PLA is the ring-opening polymerization with metal catalysts of lactides that are typically derived from starch fermentation. Compared to the production of fossil-based polymers, the production of PLA has been shown by life cycle assessment to consume less material resources and non-renewable energy, to generate a significantly lower amount of greenhouse gas emissions, and to release a lower amount of acidic emissions.18,19 PLA is a highly versatile thermoplastic material that possesses high biocompatibility and bio-absorbability,20 making it attractive for bio-disposable plastic products. PLA is considered biodegradable by many definitions and can degrade into water, carbon dioxide, and other small molecules under compost conditions;21 however, the biodegradation rate of PLA is relatively slow and its commercial cost is presently greater than that of traditional petroleum-based plastics. Modifying PLA by creating blends or composite materials may help resolve these issues.22
Blending PLA with other natural polymers can be an effective method for toughening the material or improving its properties. For example, studies have examined the processing and properties of PLA blends with polyethylene oxide, poly(ε-caprolactone), and aliphatic polyesters.23–25 Others have found that PLA can be blended with biodegradable polymers and fillers, such as starch, corn stover, or soy protein to substantially reduce the cost of material.26,27 Soy protein is a natural protein material isolated from soybean, which is one of the major agricultural crops in the U.S. There are three main types of high-protein commercial products processed from soybean: soy flour (approximately 50% protein), soy protein concentrate (SPC) (approximately 70% protein), and soy protein isolate (SPI) (at least 90% protein). From an industry perspective, SPI serves an important role as an initial ingredient for many food products, and it has been widely studied due to its low cost, ample availability, and biodegradability. However, SPI cannot be blended directly with PLA because of the weak interfacial bonding between the two components and the high processing temperature of PLA. Plasticizers such as glycerol must be included to lower the melting temperature of PLA, and water is needed as a solvent for SPI. Many of the cyclic anhydrides, such as maleic anhydride (MA), phthalic anhydride (PA), tetrahydrophthalic anhydride (THPA), have been used as the plasticizer for soy protein based plastics.28 In this study, adipic anhydride (AA) was included in the raw soy polymer to enhance the compatibilization and miscibility of soy/PLA blends, and the soy material used was a 50/50 mixture of SPI and soy flour to form the soy protein adipic anhydride (SP.A).
The objective of this study was to evaluate, compare, and characterize blends of SP.A and PLA that were designed for use in eco-friendly plant containers that can degrade in landscape and garden soils, thereby eliminating the need for disposal. Along with characterization of these blends and evaluation of their function in the model application, we provide a thorough discussion of the sustainability of these materials for use in horticulture containers and other applications that could end their life cycle through biodegradation. Of specific interest are the added functions of containers made from SP.A/PLA blends that provide a source of intrinsic, natural fertilizer and improve the root morphology of plants compared to those grown in containers made of standard petroleum-based polypropylene.
Neat PLA and two blends of SP.A/PLA (50/50 and 33/67 by weight) were characterized for morphological and thermal properties, and were evaluated to determine the effects of blend composition and biodegradation time on their material properties. We hypothesized that mixing SP.A with PLA would be an effective way to decrease the production cost of PLA-based polymer, to increase the rate of biodegradation compared with neat PLA, and to achieve a blended material with properties that could fulfil the functions required for container-crop horticulture, then could degrade to indiscernible organic matter in soil. Very little has been reported on soy-protein plastics or the biodegradation behavior of SP.A/PLA blends degraded in agricultural soil in situ. In this work, we used scanning electron microscopy (SEM) to investigate the morphologies of neat PLA and SP.A/PLA blends at different stages of biodegradation, and used dynamic mechanical analysis (DMA), differential scanning calorimetry (DSC), and thermogravimetric analyzer (TGA) to characterize the thermal properties of neat PLA and SP.A/PLA blends at different stages of biodegradation and SP.A/PLA blended at two weight-percentage ratios.
Experimental section
Materials and processing
PLA (3001D) was supplied by NatureWorks LLC with specific gravity 1.24 g cm−3, melt flow index 22 g/10 min (210 °C), and average molecular weight (Mw) 136![[thin space (1/6-em)]](https://www.rsc.org/images/entities/char_2009.gif) 000 g mol−1. The SP.A was made from SPI and soy flour provided by Solae Company, St. Louis, MO. Soy protein polymers do not flow well at elevated temperatures and pressures because of their high level of inter- and intra-molecular hydrogen bonding. Therefore, soy protein must be properly plasticized to improve molecular mobility and reduce the pressure required to initiate flow when being processed. Water and low molecular weight polyols such as glycerol function as good plasticizers for soy protein during melt processing. Also, sodium sulfite can facilitate cleavage of disulfide bonds and can decrease the crosslinked structure of soy protein. The detailed formulation for the SP.A polymer was soy protein isolate (26%), soy flour (26%), water (31%), glycerin (8%), phthalic anhydride (4%), adipic anhydride (4%), sodium sulfite (1%), and potassium sorbate (<1%). For the blended materials, SP.A and PLA were first dried in a vacuum oven for 6 hours at 80 °C, then were compounded on a Leistritz twin-screw extruder (Leistritz Micro18, L/D ratio 30, American Leistritz Corp., Somerville, NJ) to produce plastic extrudate that was pelletized with a pellet mill (Scheer Bay Inc. WI). To evaluate the effectiveness of the SP.A/PLA blends in the model application and to assess their biodegradation in soil, prototype 4.5′′ horticulture containers (top diameter of 11.5 cm, height of 9.7 cm, and volume of 680 cm3) of the PLA, SP.A/PLA, and control (polypropylene) materials were injection molded on an 85-ton JSW injection-molding machine.
000 g mol−1. The SP.A was made from SPI and soy flour provided by Solae Company, St. Louis, MO. Soy protein polymers do not flow well at elevated temperatures and pressures because of their high level of inter- and intra-molecular hydrogen bonding. Therefore, soy protein must be properly plasticized to improve molecular mobility and reduce the pressure required to initiate flow when being processed. Water and low molecular weight polyols such as glycerol function as good plasticizers for soy protein during melt processing. Also, sodium sulfite can facilitate cleavage of disulfide bonds and can decrease the crosslinked structure of soy protein. The detailed formulation for the SP.A polymer was soy protein isolate (26%), soy flour (26%), water (31%), glycerin (8%), phthalic anhydride (4%), adipic anhydride (4%), sodium sulfite (1%), and potassium sorbate (<1%). For the blended materials, SP.A and PLA were first dried in a vacuum oven for 6 hours at 80 °C, then were compounded on a Leistritz twin-screw extruder (Leistritz Micro18, L/D ratio 30, American Leistritz Corp., Somerville, NJ) to produce plastic extrudate that was pelletized with a pellet mill (Scheer Bay Inc. WI). To evaluate the effectiveness of the SP.A/PLA blends in the model application and to assess their biodegradation in soil, prototype 4.5′′ horticulture containers (top diameter of 11.5 cm, height of 9.7 cm, and volume of 680 cm3) of the PLA, SP.A/PLA, and control (polypropylene) materials were injection molded on an 85-ton JSW injection-molding machine.
Effectiveness in the model application
Early results with horticulture containers made from blends of soy protein and PLA revealed added functions of these materials compared to standard containers made with petroleum-based plastic. Along with their ability to biodegrade in soil after use, the soy/PLA blends supply an intrinsic source of fertilizer during plant culture and improve the root structure of plants.29 Experiments to evaluate and compare the effectiveness of prototype horticulture containers made from advanced formulations of soy-based polymers (SP.A/PLA blends) and a petroleum-based control (PP) were performed under standard greenhouse conditions and were designed to quantify container performance (appearance and durability), plant quality, quality of root morphology, and reduction in fertilizer required. Results for container performance, plant quality, and root morphology were means of blind ratings by two experienced horticulturists (on a scale of 0 to 100, with 100 being best and 0 being worst) and were ascribed to experimental units that received the same standard amount of fertilizer during their crop cycle. Results for fertilizer reduction quantified how much less fertilizer was needed in SP.A/PLA containers to grow plants of the same quality as a control (PP) container that was provided with a standard rate of synthetic fertilizer. Marigold and tomato plants were grown in all experiments. Results for quality of root morphology were for tomato only, because the growth rate of marigold was insufficient to enable ratings.Biodegradation experiments
Biodegradation experiments were conducted in soil medium at the Horticulture Research Station near Gilbert, IA. The soil type was Clarion loam, a fine-loamy, mixed, superactive, mesic Typic Hapludolls. The biodegradability of the samples was investigated using one-fourth injection molded plant container pieces, cut from prototype containers. The weighed samples were prepared by placing each in a non-degradable mesh bag and burying them 10 cm below the soil surface and 0.5 m apart in a randomized complete block design. The mean soil temperature was 21.1 °C, and the soil plot was irrigated evenly with approximately 2.5 cm of water once a week. A subset of degraded samples was removed from the soil every 4 weeks for up to 24 weeks, and samples were washed with water under gentle agitation, wiped clean with a soft, dry paper tissue, and then dried at 33 ± 5 °C and 26% Relative Humidity for 9 days. After drying, the specimens were held for 24 hours in the same laboratory environment where the initial weights were measured in order to reach equilibrium with ambient humidity, and were then re-weighed. The percentage weight loss (Wloss%) of each sample was calculated by eqn (1),30 | (1) |
Scanning electron microscopy
The surface morphology of neat PLA and SP.A/PLA blends with weight percent ratios of 33/67 and 50/50 were examined using SEM after six sequential durations of biodegradation in soil (0, 8, 12, 16, 20, and 24 weeks). The measured samples were fixed on the SEM holders after sputter coating with a thin gold layer. The prepared samples were characterized using an FEI Quanta 250 field emission scanning electron microscope (FE-SEM) at 10.00 kV under high vacuum.DMA measurements
The dynamic mechanical analysis (DMA) was performed with a DMA Q800 dynamic mechanical analyzer from TA Instruments (New Castle, DE). After biodegradation treatments, all samples were measured with a film-tension mode of 1 Hz. Rectangular-shaped specimens of 1.2 mm thick and 8.3 mm wide were used for the analysis. The samples were cooled under nitrogen atmosphere and held isothermally for 2 min at −50 °C before the temperature was increased to 140 °C at a rate of 3 °C min−1.DSC measurements
Differential scanning calorimetry (DSC) measurements were performed using a thermal analyzer (TA Instrument Q20) to assess the effect of biodegradation on the thermal transition behavior of SP.A/PLA blends and to characterize the thermal properties of non-degraded samples of the blends and the separate base materials, SP.A and PLA. All DSC measurements were carried out in nitrogen atmosphere. The samples were quenched from room temperature to −50 °C, then heated from −50 °C to 200 °C at a heating rate of 20 °C min−1 to erase their anterior thermal history, equilibrated at 200 °C, and then cooled. Liquid nitrogen was used to quench the molten specimen until the temperature returned to −50 °C. After that, the samples were reheated to 200 °C at the same constant rate, measuring the second heating curves. The melting temperature (Tm) of all samples at different biodegradation stages was determined from the maximum of the endothermic melting peak. Samples of 5 mg were cut from the films and used for analysis.TGA measurements
The thermal stability of SP.A/PLA blends at different biodegradation stages was investigated by using a Q50 thermogravimetric analyzer (TGA) from TA Instruments. The samples were heated from room temperature to 850 °C at a heating rate of 20 °C min−1. The experiment was run with nitrogen as the purge gas. Samples of 10 mg each were used for this test.Results and discussion
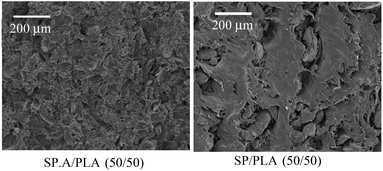
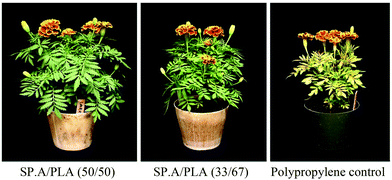
Adipic anhydride (AA) performed very well as a plasticizing agent for soy-protein polymer. Fig. 1 shows SEM micrographs of the soy/PLA (50/50) blend with AA incorporated at 4% by weight (labeled SP.A/PLA) and without AA (labeled SP/PLA). It is apparent that AA plays a significant role in improving the homogeneity of the blend; i.e., the blend of soy/PLA with AA is more homogenous than that without AA. This behavior is attributed to the function of anhydride molecules, which have high affinity for hydroxyl groups and react with the hydroxyl sites on the protein molecules to reduce their polarity and affinity for water, leading to a reduction in the hydrophilic character of the protein. In addition, the anticipated synergetic effects of this chemistry facilitates linking and attachment of plasticizer molecules (e.g. glycerol) to the protein molecule. Other chemical additives in the formulation, such as potassium sorbate, function as general anticoagulants. It is conceptualized that the use of anticoagulants simultaneously with anhydrides increases reactive efficiency with protein side groups. Therefore, decreasing the polarity of soy protein leads to improved compatibility between soy and the relatively low-polar PLA, as clearly seen in Fig. 1.The SP.A/PLA polymer blends performed very well in trials evaluating their effectiveness in horticulture crop containers, and results confirmed and quantified the added functions reported by Schrader et al.29 The fertilizer effects of horticulture containers made of SP.A/PLA are illustrated in Fig. 2, which shows plants grown in containers for 6 weeks and provided with 80% less synthetic fertilizer than is commonly used (100 ppm N for 2 weeks, then no fertilizer for 4 weeks). The appearance and structural integrity (container performance) of containers made of SPA/PLA scored slightly lower than those made of petroleum-based plastic over the 6-week greenhouse cycle (Fig. 2 and Table 1), due mainly to a blotchy appearance and slight loss of integrity from degradation originating on the inside of the containers. Of the two SP.A/PLA containers, the SP.A/PLA (33/67) performed better than SP.A/PLA (50/50) in terms of appearance and structural integrity. For all other measurements, the containers made of SP.A/PLA blended at 50/50 performed the best. When provided with a standard rate of fertilizer, plants grown in containers made of SP.A/PLA (50/50) showed the best plant quality and root quality, followed by those grown in containers made of SP.A/PLA (33/67) (Table 1). In the trial designed to quantify the reduction in fertilizer that can be achieved by using SP.A/PLA containers, it was found that the intrinsic fertilizer for containers made of SP.A/PLA blended at 50/50 and 33/67 can replace 80% and 50% of the synthetic fertilizer required for production of good-quality plants, respectively.
| Container material | Container performance | Plant quality | Root quality | Fertilizer reduction (%) |
|---|---|---|---|---|
| a Results for container performance, plant quality, and root quality are means of blind ratings by two experienced horticulturists (on a scale of 0 to 100, with 100 being best and 0 being worst). Results for fertilizer reduction are the percentage that fertilizer can be reduced in SP.A/PLA containers and still grow plants of the same quality as a control (PP) container that was provided with a standard rate of synthetic fertilizer. Results for quality of root morphology were for tomato only, because the growth rate of marigold was insufficient to enable ratings. | ||||
| Marigold | ||||
| SP.A/PLA (50/50) | 86 | 98 | 80 | |
| SP.A/PLA (33/67) | 94 | 88 | 50 | |
| Petroleum control (PP) | 100 | 77 | ||
| Tomato | ||||
| SP.A/PLA (50/50) | 86 | 96 | 98 | 80 |
| SP.A/PLA (33/67) | 92 | 74 | 91 | 50 |
| Petroleum control (PP) | 100 | 59 | 65 | |
Issues of environmental impact and sustainability are often complex, and the replacement of petroleum-based plastic with bioplastic in an application should not be assumed to be “ecofriendly” simply because the new material is biorenewable. The best evaluations of sustainability examine the environmental impact of an item from cradle-to-grave and consider all inputs, outputs, and processes. While a complete life cycle assessment is beyond the scope of this study, there is suitable information available for addressing the most important life-cycle issues in our model system of horticulture crop containers. As mentioned in the introduction section, the production of PLA has been shown by life cycle assessment to be more sustainable than that of petroleum-based polymers, especially in the areas of resource and energy consumption and in the release of greenhouse gases and acidic emissions.18,19 Grewell et al. has shown that horticulture containers made of pure PLA function the same as commercially available containers made of petroleum-based plastic.31 Based on this information, it is logical to conclude that the PLA portion of the SP.A/PLA composite is more sustainable than petroleum-based plastics for use in the plant container application. To our knowledge, detailed environmental-impact data for materials in the soy-based portion of the composite are not available, but basic data that quantifies and compares the energy requirements and global warming potential of soy-protein polymer and polypropylene are available through the Polymers Environmental Comparator (PEC).32 Based on the PEC database, production of basic soy-protein polymer consumes much less energy (82% less) and results in much lower global warming potential (48% less) than production of petroleum-based polypropylene, which is the current standard material for 4.5′′ horticulture containers. These data, while limited, suggest a significant improvement in sustainability attributable to the soy-based portion of SP.A/PLA composite containers, but an even greater improvement in sustainability may be provided by the fertilizer function of SP.A.
The intrinsic fertilizer provided by horticulture containers made of SP.A/PLA (50/50) can replace 80% of the synthetic fertilizer required by plants under standard application conditions (Table 1). Unlike synthetic nitrogen fertilizer, which is energy-intensive to produce,33 the fertilizer available from SP.A is produced by natural, biological nitrogen fixation in nodules on the roots of soybean plants, a process that is ultimately fueled by the sun through natural photosynthesis. Along with the reduction in fertilizer cost and labor to apply synthetic fertilizer, the improvement in sustainability facilitated by the plant-derived, nitrogen fertilizer is remarkable. In agronomic systems, the utilization of plant-derived nitrogen fertilizer uses 7.9 times less energy and causes 6.4 times less global-warming impact, 935 times less ozone depletion, and 1.8 times less acidifying emissions.34 The replacement of petroleum-based plastic with SP.A/PLA composites in this application can provide a substantial improvement in sustainability by both replacing the fossil-based polymer with a bio-renewable polymer that is biodegradable,18 and by greatly reducing environmental impact through its added function, its intrinsic bio-derived fertilizer that is provided at no extra cost and with no extra labor.
Cost is also an important factor in determining whether a new material can be adopted for a specific application. Based on current material prices and the weight of materials needed to form our prototype horticulture containers, the cost of a container made of SP.A/PLA (50/50), SP.A/PLA (33/67), pure PLA, or petroleum-based polypropylene would be 13.5, 14.4, 16.1, and 11.0 cents, respectively. Blending SP.A with PLA both reduces the cost of material and provides greater value with regard to the fertilizer function and root improvement of plants. While the cost of SP.A/PLA material is slightly greater than that of polypropylene at the present time, there are two factors that indicate that this small difference may not be significant. (1) The extra function provided by SP.A/PLA containers would justify the small amount of extra cost, and (2) economists specializing in horticultural strategies have determined that many consumers would be willing to pay 23 to 58 cents more per plant for horticulture products grown in sustainable, non-petroleum containers.35
Another consideration that concerns consumers is the potential impact on food supplies and prices that might result from using agricultural-based materials for plastic products. While detailed discussion of this complex issue is beyond the scope of this study, there are a few important characteristics of SP.A/PLA feedstocks that minimize the potential for competition with food. It is estimated that the current consumption of corn used to make PLA is less than 1/20th of 1% of the annual global corn crop, so there is little to no impact on food prices or supply at present.36 Regarding the future of PLA, NatureWorks LLC, the world's largest producer of PLA, is committed to the transition from current feedstocks to non-food, cellulosic raw materials.36 The feedstock for the soy portion of the SP.A/PLA blend will always be food related, in the broad sense of the term, but its impact on food supply and price will likely be minimal because of the strong flexibility of supply and demand that is central to the agriculture industry. Stated simply, as the demand for soy increases, farmers around the globe respond and produce more soybeans.37 In addition, the wide geographic range suitable for the culture of soybean (from the sub-tropics to latitudes greater than 50°) and its natural capacity for symbiotic nitrogen fixation, indicate broad potential for increased sustainable production.38
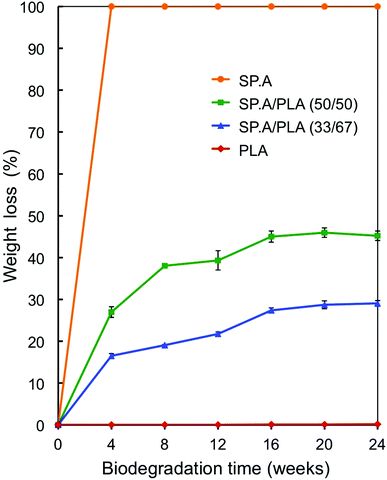
The effect of biodegradation on the weight loss of the pure SP.A and pure PLA as well as SP.A/PLA (33/67) and SP.A/PLA (50/50) blends in soil medium for durations from 0 to 24 weeks is presented in Fig. 3, and photographs of blend samples before and after 24 weeks of degradation time in soil are shown in Fig. 4. Pure SP.A biodegraded very quickly and was completely degraded (indiscernible from soil) after just 4 weeks in soil. As discussed by Schrader et al., the rapid degradation of pure SP.A precludes its use in horticulture containers without modification or blending with another polymer.29 One of our goals in this study was to decrease the biodegradation rate of SP.A by blending it with PLA (very slow biodegradation rate in soil). Our results demonstrate that the biodegradation rate of SP.A/PLA blends can be easily controlled by adjusting the blend composition, i.e. the higher the concentration of PLA the slower the rate of biodegradation (Fig. 3 and 4). While blends of SP.A/PLA at 50/50 and 33/67 showed ample durability for use in containers for nearly all greenhouse crops (Fig. 2 and Table 1), their moderate rate of biodegradation indicates the potential to end their life cycle as biodegraded organic matter in soil. After 24 weeks of biodegradation in soil, significant degradation and weight loss were observed for SP.A/PLA blends. The surfaces of the blended material became gray with shallow crevices and unevenly distributed black spots throughout the degradation process. Both blends of SP.A/PLA showed a high initial weight loss as a result of the relatively fast rate of decomposition of soy protein from the blends, results consistent with observations that nutrients such as proteins and amino acids generally biodegrade easily in soil.39,40 The sharp decrease in weight of samples (see Fig. 3) likely resulted from microbial activity (enzymatic degradation) and hydrolysis, which are the dominant processes for rapid biodegradation and continued weight loss.41–44 Blends of SP.A/PLA showed a much higher degradation rate than pure PLA, indicating that the biodegradation of PLA-based material can be significantly accelerated by increasing the amount of SP.A. Weight loss after 8 weeks of biodegradation in soil for the SP.A/PLA (50/50) blend was about twice that of SP.A/PLA (33/67) under identical biodegradation conditions, demonstrating that the loading of SP.A enhanced the biodegradation process of the blended material. It is likely that interfacial adhesion contributed to the coalescence of the two components and was another key factor accelerating the biodegradation rate of SP.A/PLA blends compared with that of pure PLA.45
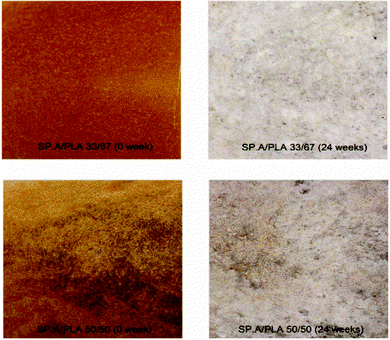 | ||
| Fig. 4 Photographs of injection-molded samples of SP.A/PLA (33/67) and SP.A/PLA (50/50) blends before and after 24 weeks of biodegradation time in soil. | ||
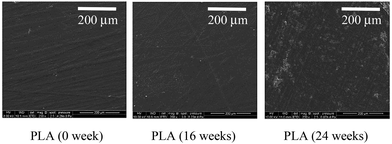
The biodegradation rate of pure PLA is very slow, and it can take several years for complete biodegradation in soil. The mechanisms involved in accelerating the biodegradation of the SP.A/PLA blended material likely include the improvement of nutrient ratios for microorganisms (especially the nitrogen to carbon ratio) over that of pure PLA and the increased surface area for microbe activity after degradation begins. After 24 weeks of biodegradation time in soil, we found that the remaining material from blended samples (SP.A/PLA at 50/50 or 67/33) were highly porous and very brittle compared to the pure PLA, which still had strong mechanical properties without any porous structure after 24 weeks (Fig. 5). These results suggest that the decrease in the mechanical properties of the blends after loss of all or most the SP.A from the blend might be related to biodegradation of the PLA component even though there is no detectable loss in weight of the PLA component over the 24 weeks. We have found that the weight loss of the SP.A/PLA (50/50) blends reached 54% after biodegradation for 1.5 years, while the degradation weight loss of pure PLA is only 0.2% under identical conditions. This demonstrates that SP.A improves the biodegradation of the SP.A/PLA blend more than the weight proportion of the SP.A component. Therefore, the early weight loss of the blend is due mainly to the degradation of SP.A, but degradation weight loss of the PLA component is increased by the SP.A, a result that is clearly evident after 1.5 years in soil.
We will also state here that we have performed trials with blends of SP.A/PLA that contained even higher concentrations of SP.A. For blends containing SP.A at greater than 50 wt%, we found that the degradation rate was very fast, but the mechanical properties of the horticulture containers made with these blends were not suitable for the application. The material was relatively brittle, lacked sufficient strength, and the water sensitivity increased substantially with increasing concentration of SP.A above 50%. While blends of SP.A/PLA with SP.A concentrations above 50% might be suitable for applications that are restricted to dry conditions, we found that the maximum concentration of SP.A should not be more than 50% for the current model application (horticulture containers).
Scanning electron microscopy (SEM) is a tool that is widely employed to investigate the internal structure and surface morphology of biodegradable polymers.46–50 The surface character of neat PLA was examined before and after degradation for up to 24 weeks in soil, and micrographs for samples at 0, 16, and 24 weeks of degradation time are shown in Fig. 5. A clean, smooth surface morphology was observed for pure PLA for soil-treatment durations up to 16 weeks, indicating that degradative damage was inconspicuous and minimal, especially in durations from 0 to 16 weeks. The micrographs of 8 and 12 weeks (not shown) exhibited very similar morphological characteristics compared to the undegraded PLA surfaces. After 24 weeks in soil, many gray spots appeared on the surface of neat PLA, demonstrating that PLA had degraded slightly, despite the relatively slow biodegradation rate.
The surface morphologies of SP.A/PLA (33/67) and SP.A/PLA (50/50) blends were also examined by SEM at different stages of biodegradation, and the resulting micrographs are shown in Fig. 6 and 7. Relatively smooth surface topographies were observed for non-degraded samples of SP.A/PLA, demonstrating strong interfacial adhesions of the two components. With increasing biodegradation time, numerous cracks and tiny corrosive holes appeared in the early stages of biodegradation process. The cracks became larger and holes became deeper as the degradation time increased, and the interior portions of the samples became exposed due to erosion of the surface regions. After 24 weeks of biodegradation, noticeably rough surfaces developed that were aggregated by small eroded regions and irregular pits. The phase structure of the SP.A/PLA blends changed from fine to coarse, resulting in prominent weight loss compared to neat PLA.
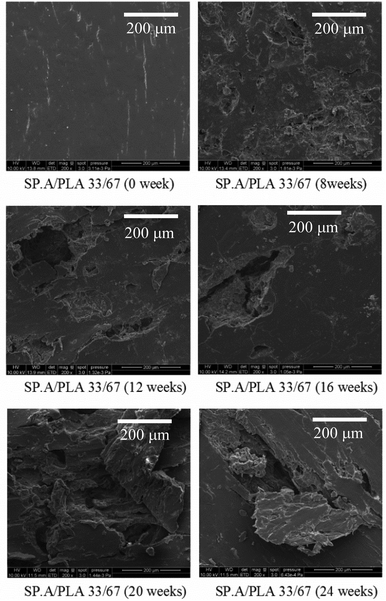 | ||
| Fig. 6 SEM micrographs of surface morphology for SP.A/PLA (33/67) blends before and after biodegradation in soil. | ||
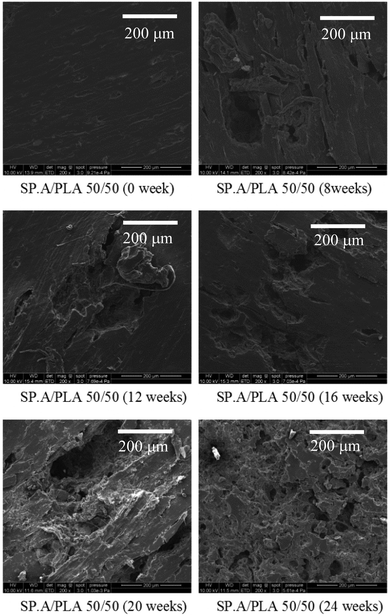 | ||
| Fig. 7 SEM micrographs of surface morphology for SP.A/PLA (50/50) blends before and after biodegradation in soil. | ||
As illustrated in Fig. 6 and 7, the SEM images of SP.A/PLA (33/67) and SP.A/PLA (50/50) differed, demonstrating that blend composition played a role in the degradation mechanisms of the two blends. Compared to the SP.A/PLA (33/67) blend, the surface of SP.A/PLA (50/50) exhibited more corrosive holes and disorderly erosive aggregates. SP.A positively affected the degradation patterns of SP.A/PLA blends, accelerating their biodegradation rate in soil. As seen in the results of Park et al., degradation of pure soy protein in the soil is very fast, with most of the weight loss occurring in the first week and nearly 95% of the original weight degrading within 5 weeks.51
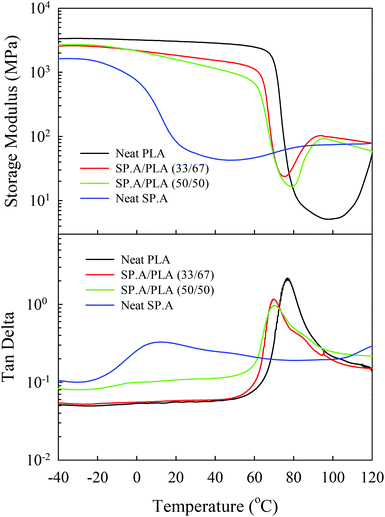
DMA measurements in the range of temperatures from −50 °C to 140 °C were used to characterize the dynamic mechanical properties of SP.A/PLA blends and to compare them with the properties of pure PLA and SP.A components. The variations in the storage modulus (E′) and loss tangent (tan![[thin space (1/6-em)]](https://www.rsc.org/images/entities/char_2009.gif) δ) of all materials are shown in Fig. 8. The storage modulus of the blends at both the glassy region and rubber region decreased as the amount of SP.A increased, a property that likely resulted from the influence of a low Tg component (SP.A) in partially miscible blends. The Tg of SP.A obtained from the temperature at the peak maximum of tan
δ) of all materials are shown in Fig. 8. The storage modulus of the blends at both the glassy region and rubber region decreased as the amount of SP.A increased, a property that likely resulted from the influence of a low Tg component (SP.A) in partially miscible blends. The Tg of SP.A obtained from the temperature at the peak maximum of tan![[thin space (1/6-em)]](https://www.rsc.org/images/entities/char_2009.gif) δ is approximately 60 °C lower than that of pure PLA. Specifically, the heat treatment was not expected to result in complete crystallinity because the amorphous regions can accelerate chain mobility with respect to the crystallization of PLA in the presence of amorphous SP.A.52,53 The pure PLA exhibited a sharper and higher loss tangent peak compared to SP.A/PLA blends and pure SP.A. In addition, the storage modulus of PLA declined sharply at approximately 65 °C, a temperature related to the glass relaxation processes (α-relaxation) of the amorphous regions in PLA. The glass transition temperature of the blends shifted systematically to lower temperatures with increasing SP.A loadings, demonstrating that the low Tg component (SP.A) accelerated the polymer chain mobility. After heating above 100 °C, the storage moduli of pure PLA increased again, corresponding to the appearance of the second relaxation process. For PLA, this phenomenon takes place because of the cold crystallization.54,55 At higher temperature, the crystalline region in the samples began to melt, therefore the storage moduli decreased again due to slippage of large-scale molecular chains.
δ is approximately 60 °C lower than that of pure PLA. Specifically, the heat treatment was not expected to result in complete crystallinity because the amorphous regions can accelerate chain mobility with respect to the crystallization of PLA in the presence of amorphous SP.A.52,53 The pure PLA exhibited a sharper and higher loss tangent peak compared to SP.A/PLA blends and pure SP.A. In addition, the storage modulus of PLA declined sharply at approximately 65 °C, a temperature related to the glass relaxation processes (α-relaxation) of the amorphous regions in PLA. The glass transition temperature of the blends shifted systematically to lower temperatures with increasing SP.A loadings, demonstrating that the low Tg component (SP.A) accelerated the polymer chain mobility. After heating above 100 °C, the storage moduli of pure PLA increased again, corresponding to the appearance of the second relaxation process. For PLA, this phenomenon takes place because of the cold crystallization.54,55 At higher temperature, the crystalline region in the samples began to melt, therefore the storage moduli decreased again due to slippage of large-scale molecular chains.
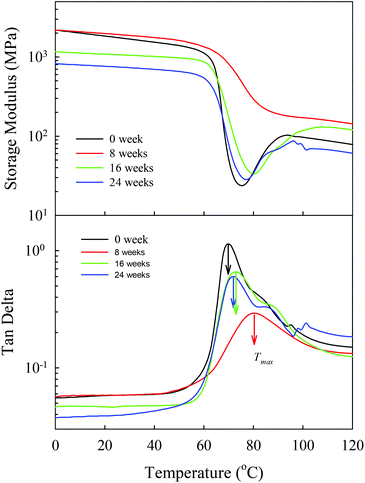
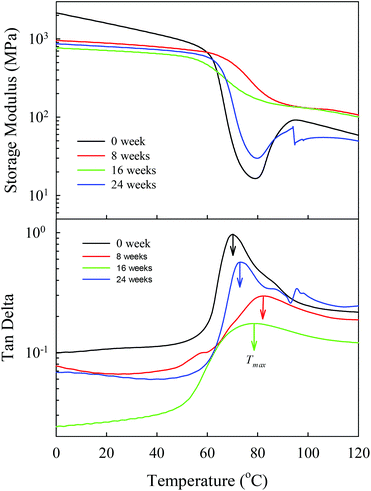
The effect of different biodegradation durations on the thermomechanical properties of the SP.A/PLA blends is presented in Fig. 9 and 10. Representative tan![[thin space (1/6-em)]](https://www.rsc.org/images/entities/char_2009.gif) δ and storage modulus (E′) curves as a function of temperature for biodegradation stages up to 24 weeks were obtained. Two relaxation processes were observed for soy-rich and PLA-rich phases at low and high temperature ranges, respectively. In general, the biodegradation process decreased the storage modulus of the SP.A/PLA blends (Fig. 9 and 10). With increasing degradation time in soil, the change in positions of tan
δ and storage modulus (E′) curves as a function of temperature for biodegradation stages up to 24 weeks were obtained. Two relaxation processes were observed for soy-rich and PLA-rich phases at low and high temperature ranges, respectively. In general, the biodegradation process decreased the storage modulus of the SP.A/PLA blends (Fig. 9 and 10). With increasing degradation time in soil, the change in positions of tan![[thin space (1/6-em)]](https://www.rsc.org/images/entities/char_2009.gif) δ peaks (PLA-rich phase) can be classified into two stages. In the early stage of the biodegradation process, most of the amorphous soy protein degraded, resulting in an increasing percentage of crystalline portions (PLA) in the blends. Therefore, a noticeable shift of α-relaxation peak to higher temperature occurred. After approximately 8 weeks, the second stage began, with gradual bioabsorption and removal of soy protein by microbial, chemical, and physical activities in the soil medium.56 The glass transition temperature of the samples shifted slightly toward lower temperatures, an occurrence likely associated with the decrease in molecular weight of the blends as a result of biodegradation. From this point, the SP.A/PLA (33/67) and SP.A/PLA (50/50) blends showed a similar trend, indicating that different biodegradation time intervals had a measurable impact on the thermomechanical properties of SP.A/PLA blends. In addition, the broad relaxation process in the low temperature range (−30 to 30 °C) for the soy-rich phase shifted slightly to lower temperatures with increasing biodegradation time.
δ peaks (PLA-rich phase) can be classified into two stages. In the early stage of the biodegradation process, most of the amorphous soy protein degraded, resulting in an increasing percentage of crystalline portions (PLA) in the blends. Therefore, a noticeable shift of α-relaxation peak to higher temperature occurred. After approximately 8 weeks, the second stage began, with gradual bioabsorption and removal of soy protein by microbial, chemical, and physical activities in the soil medium.56 The glass transition temperature of the samples shifted slightly toward lower temperatures, an occurrence likely associated with the decrease in molecular weight of the blends as a result of biodegradation. From this point, the SP.A/PLA (33/67) and SP.A/PLA (50/50) blends showed a similar trend, indicating that different biodegradation time intervals had a measurable impact on the thermomechanical properties of SP.A/PLA blends. In addition, the broad relaxation process in the low temperature range (−30 to 30 °C) for the soy-rich phase shifted slightly to lower temperatures with increasing biodegradation time.
Differential scanning calorimetry (DSC) was carried out to determine the temperatures and heat flow during thermal transitions of SP.A/PLA blends. Research has shown that second phase additives can substantially affect the crystallinity of binary polymer blends.57 The miscibility of blended polymers can be determined effectively by measuring the Tg of the blends.58,59 Polymer blends are miscible when their components exhibit one single composition-dependent Tg. As clearly seen in Fig. 11, the Tg of pure PLA (60 °C) is much higher than that of pure SP.A (1.5 °C). Only one Tg was observed for the each of concentrations of SP.A/PLA blends. In addition, the DSC measurement shows no evidence for a Tg related to the soy-rich phase in the low temperature range indicating that the two components are miscible. Table 2 compares the glass transition temperatures and melting temperatures of pure PLA, SP.A, and SP.A/PLA blends, showing that both the Tg and melting points of the blends containing SP.A decreased as the concentration of soy protein increased. These results also demonstrate that the percentage of crystalline region decreased due to the effects of the amorphous SP.A component, which effectively accelerated the segmental motion of the polymer chains in the blends. As expected, the DSC traces reflected the loss of molecular order, gelatinization, and enthalpic changes associated with the structure relaxations.60 The theoretical calculated Tgs of the blends based on Fox-Equation are also presented in Table 2. For the SP.A/PLA (33/67) blend, there is a good agreement between the Tg evaluated experimentally using DSC and that calculated theoretically based on Fox-Equation. However, for the SP.A/PLA (50/50) blend, the value of Tg from DSC is much higher than that calculated from Fox-Equation (see Table 2). This result suggests that the SP.A/PLA (50/50) blend is partially miscible.
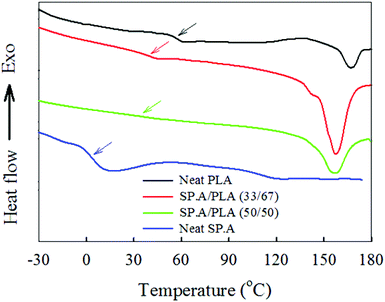 | ||
| Fig. 11 DSC heating scan for pure PLA and SP.A/PLA blends before degradation process. The DSC measurements were carried out at 20 °C min−1 heating rate (second heating run) under nitrogen atmosphere. | ||
| Neat PLA | SP.A/PLA (33/67) | SP.A/PLA (50/50) | Neat SP.A | |
|---|---|---|---|---|
| T g (°C)/Exp. | 60.17 | 40.03 | 39.72 | 1.5 |
| T g (°C)/Fox | 38.2 | 28.1 | ||
| T m (°C) | 169.31 | 157.52 | 156.79 |
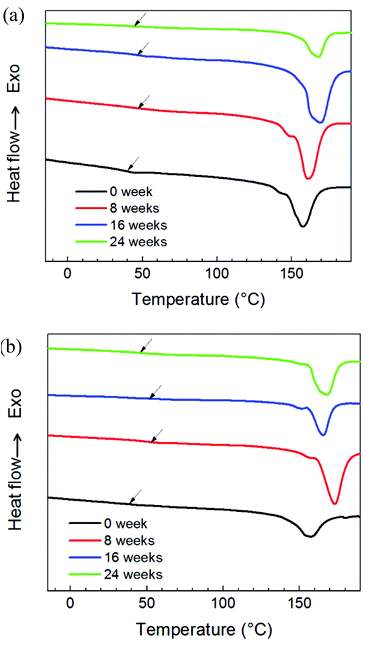
To analyze the morphological transformation of the SP.A/PLA (33/67) and SP.A/PLA (50/50) blends, and to better determine the Tg values during biodegradation, calorimetric scans were performed for samples degraded for different periods of time in soil. Results of the scans are displayed in Fig. 12. Non-degraded samples (0 week) exhibited relatively broad endothermic peaks. With increasing degradation time in soil, the endothermic peak intensity increased in the early stages of degradation and then decreased progressively, suggesting a complex series of changes over time. The changes caused by degradation were difficult to interpret because the separate contributions from PLA and SP.A degradation appeared to overlap, but some of these changes can be described by results of more than one of the analyses. Under soil conditions, the PLA underwent a complex but slow rate of degradation,61,62 which was evident from subtle indicators on the thermographs. The DSC results for glass transition and melting temperatures of the blends determined by using the program of heat-cool-heat are presented in Table 3. The results for Tg and Tm revealed similar trends related to the effects of degradation in soil, showing increases in both values related to the degradation of amorphous SP.A, a conclusion also confirmed by DMA results. After the first stage of biodegradation, Tg and Tm of the blends decreased slightly due to the reduction of molecular weight, confirming the loss of the soy protein component by degradation in soil.
| SP.A/PLA (33/67) | SP.A/PLA (50/50) | ||||
|---|---|---|---|---|---|
| T g (°C) | T m (°C) | T g (°C) | T m (°C) | ||
| 0 week | 40.03 | 157.52 | 0 week | 39.72 | 156.79 |
| 8 weeks | 48.84 | 160.98 | 8 weeks | 52.09 | 173.15 |
| 16 weeks | 48.23 | 168.43 | 16 weeks | 52.22 | 165.42 |
| 24 weeks | 43.32 | 167.33 | 24 weeks | 45.93 | 167.92 |
To investigate the effect of blend composition on thermal degradation behavior of SP.A/PLA blends before biodegradation in soil medium, thermogravimetric analyses were performed to evaluate mass change as a function of temperature (Fig. 13). Results of these analyses show that pure PLA and SP.A as well as SP.A/PLA blends exhibited different thermal degradation behavior. The temperature at initial weight loss was quite different for the samples before biodegradation, demonstrating that the incorporated SP.A significantly decreased the onset thermal stability of the SP.A/PLA blends (Fig. 13). This is consistent with the thermal decomposition behavior of soy protein reported in the literature.30,41,63
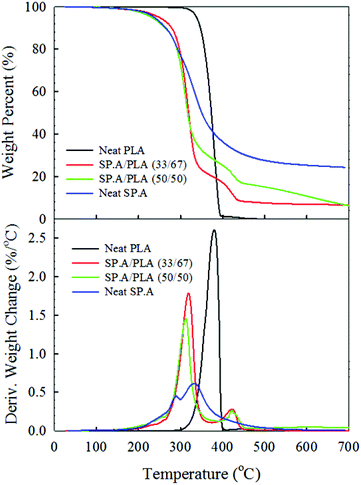 | ||
| Fig. 13 Comparison of thermal degradation and derivative weight change under nitrogen atmosphere for neat PLA, neat SP.A, SP.A/PLA (33/67), and SP.A/PLA (50/50) before biodegradation in soil. | ||
The duration of biodegradation may have a strong influence on the thermal degradation properties of SP.A/PLA blends. TGA was performed to investigate how biodegradation time affected thermal stability of samples (Fig. 14). The non-biodegraded samples underwent two major changes in thermal stability during TGA, but the samples that biodegraded in soil for 24 weeks showed only one change. SP.A/PLA samples held 24 weeks in soil showed a large reduction in mass that occurred with only one thermal-degradation stage. These results are similar to the thermal-degradation behavior of pure PLA, confirming the bioabsorption and loss of soy protein during biodegradation of SP.A/PLA blends in soil. Tables 4 and 5 compare the degradation temperatures of SP.A/PLA blends at different percentage weight loss. T5 and T10 denote the temperature at which the samples lost the initial 5% and 10% of their original mass, respectively. Regardless of the blend ratio of SP.A/PLA, T5 and T10 gradually and systematically increased with increasing biodegradation time in soil, and the temperature at half weight loss, T50, was roughly the same as the Tmax, the maximum degradation temperature. For both blends of SP.A/PLA, Tmax increased with increasing biodegradation time in soil, and Tmax for both blends after 24 weeks of biodegradation was nearly the same as that of pure PLA. PLA is more thermally stable than SP.A (see Fig. 13), however SP.A is highly biodegradable and degrades at a faster rate than PLA. Therefore, the concentration of PLA in the degrading SP.A/PLA sample increases as biodegradation progresses, and the partially biodegraded sample becomes more thermally stable than it was before biodegradation began. This conclusion is supported by the observable change in Tmax, which increased or shifted to higher temperature with increasing biodegradation time in soil. These results suggest that most of the SP.A component is lost through biodegradation in soil within 24 weeks.
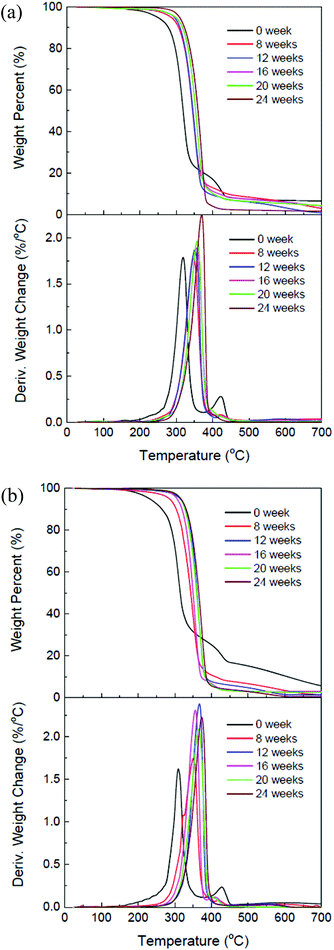 | ||
| Fig. 14 TGA profiles in nitrogen for (a) SP.A/PLA (33/67) and (b) SP.A/PLA (50/50) blends after different durations of biodegradation in soil. | ||
| T 5 (°C) | T 10 (°C) | T 50 (°C) | T max (°C) | |
|---|---|---|---|---|
| Neat PLA | 338.12 | 347.25 | 372.90 | 376.94 |
| SP.A/PLA (33/67) 0 week | 248.45 | 278.46 | 318.90 | 318.84 |
| SP.A/PLA (33/67) 8 weeks | 286.05 | 306.67 | 345.07 | 347.89 |
| SP.A/PLA (33/67) 12 weeks | 294.66 | 310.35 | 345.53 | 351.12 |
| SP.A/PLA (33/67) 16 weeks | 296.93 | 316.84 | 352.80 | 356.77 |
| SP.A/PLA (33/67) 20 weeks | 298.16 | 317.74 | 352.96 | 358.38 |
| SP.A/PLA (33/67) 24 weeks | 309.21 | 322.95 | 359.76 | 369.68 |
| T 5 (°C) | T 10 (°C) | T 50 (°C) | T max (°C) | |
|---|---|---|---|---|
| Neat PLA | 338.12 | 347.25 | 372.90 | 376.94 |
| SP.A/PLA (50/50) 0 week | 231.82 | 265.48 | 314.80 | 309.96 |
| SP.A/PLA (50/50) 8 weeks | 285.57 | 304.29 | 343.59 | 350.31 |
| SP.A/PLA (50/50) 12 weeks | 313.63 | 329.52 | 359.91 | 365.26 |
| SP.A/PLA (50/50) 16 weeks | 306.38 | 319.81 | 349.95 | 355.15 |
| SP.A/PLA (50/50) 20 weeks | 316.09 | 327.89 | 359.46 | 364.83 |
| SP.A/PLA (50/50) 24 weeks | 316.39 | 330.95 | 365.70 | 373.71 |
Conclusions
The added functions of soy/PLA blended bioplastics over that of petroleum plastic greatly improve sustainability in horticulture crop containers by providing intrinsic, natural fertilizer during plant production and by facilitating a low-impact end-of-life option of biodegradation in soil. Characterization of physical and thermal properties of these materials is essential in order to maximize their industrial potential for horticultural use and numerous other applications. Along with results demonstrating the effectiveness and sustainability of blended polymers of adipic anhydride-plasticized soy protein and PLA (SP.A/PLA blends) in our model application, this study characterizes the morphological and thermal properties of these materials during different stages of biodegradation in soil. We confirm that adipic anhydride can be used successfully as a plasticizer for soy-protein polymer to help facilitate melt blending with PLA. For all of the samples comparatively investigated by DSC, only one Tg was observed, suggesting a miscible system between SP.A and PLA in the melt, results also confirmed by DMA. SEM patterns revealed that SP.A accelerated the biodegradation rate of binary blends of SP.A/PLA compared to that of pure PLA under soil conditions. DMA investigations revealed changes in Tg of SP.A/PLA blends in response to biodegradation in soil, and thermomechanical properties of the blends were affected differently depending on the duration of biodegradation. We conclude that these changes in thermomechanical properties were related to a loss of the soy-protein component from the binary polymer and bioabsorption of the soy component by the soil medium. TGA curves showed that the thermal stability of the blends increased gradually with increasing biodegradation time in soil. Addition of SP.A to PLA could be a useful method for decreasing material costs and improving the biodegradability of PLA-based materials in soil. Utilization of SP.A/PLA blends for horticulture crop containers and other potential agricultural applications could provide a substantial improvement in sustainability by reducing the use of finite fossil-based materials, eliminating the need for disposal, and providing additional function over that of petroleum plastics. The natural fertilizer provided by horticulture containers made of SP.A/PLA can replace up to 80% of the synthetic fertilizer required for greenhouse crop production, an intrinsic feature that could greatly reduce environmental impact and strongly improve overall sustainability.Acknowledgements
This research was supported in part by the USDA Specialty Crops Research Initiative (USDA-SCRI project # IOW05306). We thank NatureWorks LLC. for providing PLA, and we thank Solae Company, St. Louis, MO for providing SPI and soy flour. We also thank Kyle Haubrich and Samuel Schrader for their technical assistance during prototype development, trial establishment, and data collection.References
- G. U. Raju and S. Kumarappa, Experimental study on mechanical properties of groundnut shell particle-reinforced epoxy composites, J. Reinf. Plast. Compos., 2011, 30(12), 1029–1037 CrossRef CAS PubMed
.
- H. N. Cheng and R. A. Gross, Green Polymer Chemistry: Biocatalysis and Biomaterials, Green Polym. Chem.: Biocatal. Biomater., 2010, 1043, 1–14 CAS
.
- J. D. Schiffman and C. L. Schauer, One-step electrospinning of cross-linked chitosan fibers, Biomacromolecules, 2007, 8(9), 2665–2667 CrossRef CAS PubMed
.
- V. Dornburg,
et al., Economics and GHG emission reduction of a PLA bio-refinery system - Combining bottom-up analysis with price elasticity effects, Resour., Conserv. Recycl., 2006, 46(4), 377–409 CrossRef PubMed
.
- N. Kawashima, M. Matsuo and M. Sugi, Role of bio-based polymers toward building a sustainable society - Through a business development of polylactic acid, LACEA((R)), Kobunshi Ronbunshu, 2005, 62(6), 233–241 CrossRef CAS
.
- A. K. Mohanty, M. Misra and L. T. Drzal, Sustainable bio-composites from renewable resources Opportunities and challenges in the green materials world, J. Polym. Environ., 2002, 10(1–2), 19–26 CrossRef CAS
.
- H. Kalita and N. Karak, Bio-based elastomeric hyperbranched polyurethanes for shape memory application, Iran. Polym. J., 2012, 21(4), 263–271 CrossRef CAS PubMed
.
- F. Julian,
et al., Bio-Based Composites from Stone Groundwood Applied to New Product Development, Bioresources, 2012, 7(4), 5829–5842 CrossRef PubMed
.
- K. W. McMillin and J. N. Belcher, Advances in the packaging of fresh and processed meat products, Advances in Meat, Poultry and Seafood Packaging, 2012,(220), 173–204 Search PubMed
.
- B. Shi, C. Bunyard and D. Palfery, Plant polymer biodegradation in relation to global carbon management, Carbohydr. Polym., 2010, 82(2), 401–404 CrossRef CAS PubMed
.
- D. Yang,
et al., A high-performance dielectric elastomer consisting of bio-based polyester elastomer and titanium dioxide powder, J. Appl. Phys., 2013, 114(15), 154104 CrossRef PubMed
.
- L. Crepy,
et al., Evaluation of a bio-based hydrophobic cellulose laurate film as biomaterialuStudy on biodegradation and cytocompatibility, J. Biomed. Mater. Res., Part B, 2012, 100B(4), 1000–1008 CrossRef CAS PubMed
.
- N. Duran,
et al., A Minireview of Cellulose Nanocrystals and Its Potential Integration as Co-Product in Bioethanol Production, J. Chil. Chem. Soc., 2011, 56(2), 672–677 CrossRef CAS
.
- R. C. Thompson,
et al., Plastics, the environment and human health: current consensus and future trends, Philos. Trans. R. Soc.,y B, 2009, 364(1526), 2153–2166 CrossRef CAS PubMed
.
- S. A. Madbouly,
et al., Biodegradation behavior of bacterial-based polyhydroxyalkanoate (PHA) and DDGS composites, Green Chem., 2014, 16, 1911–1920 RSC
.
-
J. A. Schrader, Report on the annual consumption of plastics for specialty- crop containers in the United States, Iowa State University Bioplastics Research, 2013. http://www.public.iastate.edu/~bioplastic/Supplementary/AnnualPlastic.html
.
-
B. Botts, Beauty and the plastic beast, Chicago Tribune, 2007. http://www.chicagotribune.com/chi-garden-plastic-story,0,389835.story Search PubMed
.
- W. J. Groot and T. Borén, Life cycle assessment of the manufacture of lactide and PLA biopolymers from sugarcane in Thailand, Int. J. Life Cycle Assess., 2010, 15(9), 970–984 CrossRef CAS
.
-
F. Hermansson, Environmental evaluation of bio-composite using LCAMaster's Thesis, Department of Energy and Environment, Chalmers University of Technology, Göteborg, Sweden, 2013 Search PubMed
.
- T. Takayama and M. Todo, Improvement of impact fracture properties of PLA/PCL polymer blend due to LTI addition, J. Mater. Sci., 2006, 41(15), 4989–4992 CrossRef CAS PubMed
.
- Y. X. Weng,
et al., Biodegradation behavior of poly(butylene adipate-co-terephthalate) (PBAT), poly(lactic acid) (PLA), and their blend under soil conditions, Polym. Test., 2013, 32(5), 918–926 CrossRef CAS PubMed
.
- R. Zhu, H. Z. Liu and J. W. Zhang, Compatibilizing Effects of Maleated Poly(lactic acid) (PLA) on Properties of PLA/Soy Protein Composites, Ind. Eng. Chem. Res., 2012, 51(22), 7786–7792 CrossRef CAS
.
- G. L. Siparsky,
et al., Water transport in polylactic acid (PLA), PLA/polycaprolactone copolymers, and PLA polyethylene glycol blends, J. Environ. Polym. Degrad., 1997, 5(3), 125–136 CAS
.
- K. J. Zhu, B. H. Song and S. L. Yang, Super Microcapsules (Smc) .1. Preparation and Characterization of Star Polyethylene Oxide (Peo)-Polylactide (Pla) Copolymers, J. Polym. Sci., Part A: Polym. Chem., 1989, 27(7), 2151–2159 CrossRef CAS
.
- T. Yokohara and M. Yamaguchi, Structure and properties for biomass-based polyester blends of PLA and PBS, Eur. Polym. J., 2008, 44(3), 677–685 CrossRef CAS PubMed
.
- H. Li and M. A. Huneault, Crystallization of PLA/Thermoplastic Starch Blends, Int. Polym. Process., 2008, 23(5), 412–418 CrossRef
.
- C. G. Li,
et al., Thermal and Mechanical Properties of Corn Stalk Microcrystalline Cellulose Reinforced PLA Composites, Fundamental of Chemical Engineering, Pts 1–3, 2011, 233–235, 1726–1729 CAS
.
- V. Fombuena,
et al., Study of the Properties of Thermoset Materials Derived from Epoxidized Soybean Oil and Protein Fillers, J. Am. Oil Chem. Soc., 2013, 90(3), 449–457 CrossRef CAS
.
- J. A. Schrader,
et al., Fertilizer Effects of Soy-plastic Containers during Crop Production and Transplant Establishment, HortScience, 2013, 48, 724–731 CAS
.
- Y. D. Li,
et al., Rheology, Crystallization, and Biodegradability of Blends Based on Soy Protein and Chemically Modified Poly(butylene succinate), Ind. Eng. Chem. Res., 2009, 48(10), 4817–4825 CrossRef CAS
.
- D. Grewell,
et al., Sustainable materials for horticultural application, Plast. Eng., 2014, 70(3), 44–52 Search PubMed
.
-
D. Grewell, et al., Polymers Environmental Comparator, 2013. http://pec.materialdatacenter.com/pec Search PubMed
.
- N. Pelletier,
et al., Energy Intensity of Agriculture and Food Systems, Ann. Rev. Environ. Resour., 2011, 36, 223–246 CrossRef
.
- N. Pelletier,
et al., Scenario modeling potential eco-efficiency gains from a transition to organic agriculture: life cycle perspectives on Canadian canola, corn, soy, and wheat production, Environ. Manage., 2008, 42(6), 989–1001 CrossRef CAS PubMed
.
- C. Yue,
et al., Are Consumers Willing to Pay More for Biodegradable Containers Than for Plastic Ones? Evidence from Hypothetical Conjoint Analysis and Nonhypothetical Experimental Auctions, J. Agric. Appl. Econ., 2010, 42(4), 757–772 Search PubMed
.
-
NatureWorks LLC, Sourcing Ingeo: Raw Materials, 2014. http://www.natureworksllc.com/The-Ingeo-Journey/Raw-Materials Search PubMed
.
-
Worldwatch Institute, Soybean Demand Continues to Drive Production, 2013. http://www.worldwatch.org/node/5442 Search PubMed
.
- J. Koivisto, Glycine max L. CIAT/FAO Collaboration on Tropical Forages, Food and Agriculture Organization of the United Nations, 2014. http://www.fao.org/ag/agp/AGPC/doc/gbase/data/soybean.htm.
- D. L. Jones and K. Kielland, Amino acid, peptide and protein mineralization dynamics in a taiga forest soil, Soil Biol. Biochem., 2012, 55, 60–69 CrossRef CAS PubMed
.
- D. L. Jones, Amino acid biodegradation and its potential effects on organic nitrogen capture by plants, Soil Biol. Biochem., 1999, 31(4), 613–622 CrossRef CAS
.
- A. Gonzalez and C. I. A. Igarzabal, Soy protein - Poly (lactic acid) bilayer films as biodegradable material for active food packaging, Food Hydrocolloids, 2013, 33(2), 289–296 CrossRef CAS PubMed
.
- L. Calabria,
et al., Soy protein isolate/poly(lactic acid) injection-molded biodegradable blends for slow release of fertilizers, Ind. Crops Prod., 2012, 36(1), 41–46 CrossRef CAS PubMed
.
- I. Kaur,
et al., Study of the Biodegradation Behavior of Soy Protein-Grafted Polyethylene by the Soil Burial Method, J. Appl. Polym. Sci., 2009, 111(5), 2460–2467 CrossRef CAS
.
- P. Lodha and A. N. Netravali, Effect of soy protein isolate resin modifications on their biodegradation in a compost medium, Polym. Degrad. Stab., 2005, 87(3), 465–477 CrossRef CAS PubMed
.
- H. Abbasnezhad, M. Gray and J. M. Foght, Influence of adhesion on aerobic biodegradation and bioremediation of liquid hydrocarbons, Appl. Microbiol. Biotechnol., 2011, 92(4), 653–675 CrossRef CAS PubMed
.
- Y. Deng,
et al., Study on the three-dimensional proliferation of rabbit articular cartilage-derived chondrocytes on polyhydroxyalkanoate scaffolds, Biomaterials, 2002, 23(20), 4049–4056 CrossRef CAS
.
- P. Kucharczyk,
et al., Correlation of Morphology and Viscoelastic Properties of Partially Biodegradable Polymer Blends Based on Polyamide 6 and Polylactide Copolyester, Polym.-Plast. Technol. Eng., 2012, 51(14), 1432–1442 CrossRef CAS
.
- Y. T. Hsieh and E. M. Woo, Lamellar assembly
and orientation-induced internal micro-voids by cross-sectional dissection of poly(ethylene oxide)/poly(L-lactic acid) blend, Express Polym. Lett., 2013, 7(4), 396–405 CrossRef CAS
.
- M. A. Araujo, A. M. Cunha and M. Mota, Changes on surface morphology of corn starch blend films, J. Biomed. Mater. Res., Part A, 2010, 94A(3), 720–729 CAS
.
- M. G. Cascone,
et al., Morphological evaluation of bioartificial hydrogels as potential tissue engineering scaffolds, J. Mater. Sci.: Mater. Med., 2004, 15(12), 1309–1313 CrossRef CAS PubMed
.
- S. K. Park, N. S. Hettiarachchy and L. Were, Degradation behavior of soy protein-wheat gluten films in simulated soil conditions, J. Agric. Food Chem., 2000, 48(7), 3027–3031 CrossRef CAS PubMed
.
- J. P. Mofokeng,
et al., Comparison of injection moulded, natural fibre-reinforced composites with PP and PLA as matrices, J. Thermoplast. Compos. Mater., 2012, 25(8), 927–948 CrossRef PubMed
.
- A. P. Mathew, K. Oksman and M. Sain, The effect of morphology and chemical characteristics of cellulose reinforcements on the crystallinity of polylactic acid, J. Appl. Polym. Sci., 2006, 101(1), 300–310 CrossRef CAS
.
- T. Tabi,
et al., Crystalline structure of annealed polylactic acid and its relation to processing, Express Polym. Lett., 2010, 4(10), 659–668 CrossRef CAS
.
- L. Jiang, M. P. Wolcott and J. Zhang, Study of biodegradable polylactide/poly(butylene adipate-co-terephthalate) blends, Biomacromolecules, 2006, 7(1), 199–207 CrossRef CAS PubMed
.
- A. H. Tkaczyk, J. U. Otaigbe and K. L. G. Ho, Bioabsorbable soy protein plastic composites: Effect of polyphosphate fillers on biodegradability, J. Polym. Environ., 2001, 9(1), 19–23 CrossRef CAS
.
- L. Bianchi,
et al., Isotactic Polypropylene Polyisobutylene Blends - Morphology Structure Mechanical-Properties Relationships, J. Mater. Sci., 1985, 20(3), 895–905 CrossRef CAS
.
- R. Bouyahia, F. Metref and S. Djadoun, Miscibility and thermal behaviour of poly(styrene-co-itaconic acid)/poly(butyl methacrylate-co-4-vinylpyridine) mixtures. Accessibility and self-association effects, Macromol. Symp., 2008, 263, 86–95 CrossRef CAS
.
- W. Zhang, S. J. Chen and J. Zhang, Influence of blend composition on mechanical properties of ASA/SAN binary blends, J. Thermoplast. Compos. Mater., 2013, 26(3), 322–335 CrossRef PubMed
.
- A. V. Lluch,
et al., Thermal analysis characterization of the degradation of biodegradable starch blends in soil, J. Appl. Polym. Sci., 2005, 96(2), 358–371 CrossRef CAS
.
- R. L. Shogren,
et al., Biodegradation of starch/polylactic acid/poly(hydroxyester-ether) composite bars in soil, Polym. Degrad. Stab., 2003, 79(3), 405–411 CrossRef CAS
.
- E. Rudnik and D. Briassoulis, Comparative Biodegradation in Soil Behaviour of two Biodegradable Polymers Based on Renewable Resources, J. Polym. Environ., 2011, 19(1), 18–39 CrossRef CAS PubMed
.
-
Y. L. Zhao, et al., Thermal Degradation of Sodium Alginate- Incorporated Soy Protein Isolate/Glycerol Composite Membranes, Proceedings of the 17th Iapri World Conference on Packaging, 2010, pp. 402–405 Search PubMed
.
| This journal is © The Royal Society of Chemistry 2015 |

