Resolving the true band gap of ZrNiSn half-Heusler thermoelectric materials
Jennifer
Schmitt†
a,
Zachary M.
Gibbs†
b,
G. Jeffrey
Snyder
*c and
Claudia
Felser
d
aInstitute for Inorganic and Analytical Chemistry, Johannes Gutenberg-University Mainz, Staudingerweg 9, D-55099 Mainz, Germany
bDivision of Chemistry and Chemical Engineering, California Institute of Technology, 1200 E California Blvd, Pasadena, CA 91125, USA
cDepartment of Materials Science, California Institute of Technology, 1200 E California Blvd, Pasadena, CA 91125, USA. E-mail: jsnyder@caltech.edu
dMax Planck Institute for Chemical Physics of Solids, D-01187 Dresden, Germany
First published on 29th September 2014
Abstract
N-type XNiSn (X = Ti, Zr, Hf) half-Heusler (HH) compounds possess excellent thermoelectric properties, which are believed to be attributed to their relatively high mobility. However, p-type XNiSn HH compounds have poor figures of merit, zT, compared to XCoSb compounds. This can be traced to the suppression of the magnitude of the thermopower at high temperatures. Eg = 2eSmaxTmax relates the band gap to the thermopower peak. However, from this formula, one would conclude that the band gap of p-type XNiSn solid solutions is only one-third that of n-type XNiSn, which effectively prevents p-type XNiSn HHs from being useful thermoelectric materials. The study of p-type HH Zr1−xScxNiSn solid solutions show that the large mobility difference between electrons and holes in XNiSn results in a significant correction to the Goldsmid–Sharp formula. This finding explains the difference in the thermopower band gap between n-type and p-type HH. The high electron-to-hole weighted mobility ratio leads to an effective suppression of the bipolar effect in the thermoelectric transport properties which is essential for high zT values in n-type XNiSn (X = Ti, Zr, Hf) HH compounds.
Conceptual insightsBand structure parameters, such as the band gap, can be estimated using electrical transport properties. In many thermoelectric studies, the temperature dependent Seebeck coefficient is used to estimate the band gap using the Goldsmid–Sharp band gap formula: Eg = 2eSmaxTmax. This important, fundamental parameter is useful for characterizing and understanding any semiconductor, but it is particularly critical in thermoelectric materials because the efficiency at high temperatures is limited by minority carrier excitation across the band gap. In this work, we compare this estimate to optical band gap measurements in the ZrNiSn system which highlights the limitations of the Goldsmid–Sharp band gap estimate—when electron-to-hole weighted mobility ratio, A, is large. By understanding this parameter, we show why ZrNiSn half Heusler materials are very good n-type, but inherently poor p-type materials. |
Introduction
Thermoelectric (TE) materials convert thermal gradients to electric potential gradients, and thus they hold promise for generating electricity from waste heat in automobiles. The maximum efficiency of these materials is determined by their dimensionless figure of merit, zT = S2T/ρκ, where S is the thermopower (absolute value of the Seebeck coefficient), ρ is the electrical resistivity, and κ is the total thermal conductivity, which is the sum of the lattice part κL and the electronic part κe.2 Thus, good TE materials possess high thermopower, low electrical resistivity, and low thermal conductivity. Half-Heusler (HH) compounds with the general formula XNiSn (X = Ti, Zr, Hf) have generated significant interest as a promising class of materials for thermoelectric applications because of their high thermopower.3,4 The numerous possibilities to manipulate each of the three lattice sites provide an excellent opportunity to influence the electronic and thermal transport properties. Through isoelectronic alloying on the X site5 or partial substitution on the Ni site,6 the thermal conductivity can be reduced owing to lattice strain and mass fluctuations by point-defect scattering of phonons. A phase separation in various HH compounds results in remarkably low thermal conductivities and enhanced electrical properties.7–10 The XNiSn solid solution is the most extensively studied n-type HH system.3,4,10–17Much of the existing literature focuses on the thermoelectric characterization of n-type XNiSn and p-type XCoSb solid solutions, whereas studies on p-type XNiSn-based HHs are far fewer in number. The most promising p-type HHs are found in the XCoSb system (X = Ti, Zr, Hf).4,18–20 For the construction of thermoelectric modules, it is desirable for the n-type and p-type materials to have similar chemical, thermal, and mechanical properties. In order to be most compatible with high-performance HH n-type materials that are currently being explored for modules,21 a suitable p-type analog in the XNiSn system is necessary. Some work has already been done to this end. For example, multiple authors have studied the substitution of Ni by Co and demonstrated that a conversion from n- to p-type behavior for the XNiSn system could be achieved.22,23 Likewise, Horyn et al.24 studied the effects of substituting Sc for Ti or Zr up to 350 K; the resulting compounds showed promising positive thermopower at room temperature.
The electronic transport properties of semiconducting materials, such as thermopower and electrical conductivity, are reflections of the electronic energy band structure. A crucial parameter that determines the thermoelectric performance is the band gap, Eg. For narrow band-gap semiconductors, the onset of bipolar conduction (both electrons and holes contributing) occurs at lower temperatures, and their compensating thermopower lead to a lower temperature peak in the overall thermopower and therefore low zT values.
In this work, we aim to extend the existing studies of p-type XNiSn HH compounds by thoroughly investigating Sc substitutions in Zr1−xScxNiSn. Through Sc substitution, we successfully doped ZrNiSn to be p-type and measured the thermoelectric properties up to 850 K. We estimated the band gap size using the Goldsmid–Sharp formula:
| Eg = 2eSmaxTmax | (1) |
E g here is referred to as the thermopower band gap which is obtainable from high temperature thermopower measurements. However, we found a discrepancy between the values obtained from our p-type samples (∼0.05 eV) and the n-type results from the literature (>0.23 eV), both of which are different from the ab intio calculated result of 0.5 eV.25 With the aid of the optical measurements, we used the original derivation of the Goldsmid–Sharp formula to resolve this apparent discrepancy by considering a large difference in weighted mobility between electrons and holes.
Experimental methods
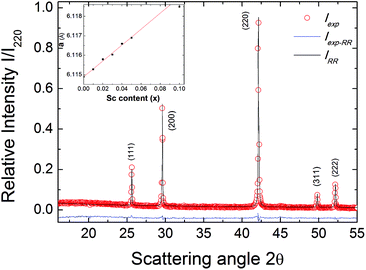
The solid solution Zr1−xScxNiSn (x = 0, …, 0.10) was prepared by arc melting of stoichiometric amounts of Zr (99.99%), Ni (99.999%), Sn (99.999%), and Sc (99.999%) in a water-cooled crucible under an Ar atmosphere. To ensure compositional homogeneity, samples were flipped and remelted five times. The as-cast samples were annealed in evacuated quartz tubes at 1220 K for 7 days, followed by quenching in ice water to ensure the crystalline order. The crystal structure of the samples was studied by X-ray diffraction (XRD) on a Siemens D5000 diffractometer using Cu Kα radiation (λ = 1.5418 Å). The powder XRD patterns of all samples showed that they were a single phase with cubic C1b structure.26The electrical resistivity was measured up to 850 K using the Van der Pauw technique. The Hall coefficient, carrier concentration, and mobility were measured in a ±2 T magnetic field using pressure contacts.27 The Hall carrier concentration nH is calculated via:
 | (2) |
| μH = RHσ | (3) |
The thermopower S was calculated from the slope of ΔV versus ΔT measurements using chromel–niobium thermocouples and by oscillating the temperature gradient ±10 K.28 The thermal conductivity, κ, was measured using a Netzsch laser flash diffusivity instrument (LFA 457) with a Pyroceram® standard. All the samples were coated with a thin layer of graphite to minimize emissivity errors. The data were analyzed using a Cowan model with pulse correction. The heat capacity was estimated using the Dulong–Petit method and the sample densities were calculated from the molar mass and the lattice parameter for each sample obtained from XRD. The optical band gap was measured with the diffuse reflectance infrared Fourier transform spectroscopy method (DRIFTS). A Nicolet 6700 Fourier transform infrared spectrophotometer and a Praying Mantis attachment were used. The detector used was a deuterated triglycine sulfate (DTGS) detector with a KBr beamsplitter. The absorption coefficient was obtained from a Kubelka–Munk analysis.
 | (4) |
Results and analysis
XRD and thermoelectric transport properties
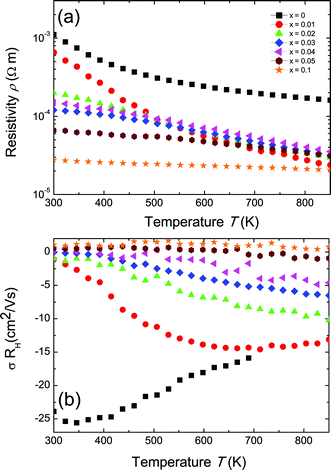
It can be seen from Fig. 2b that for increasing Sc content in the Zr1−xScxNiSn solid solution, the Hall mobility (σRH in units of mobility) is suppressed (and eventually becomes positive) by the addition of holes. The parent compound n-type ZrNiSn exhibits the highest mobility, with a value at room temperature of 25 cm2 V−1 s−1, which is a typical value for n-type XNiSn-based systems.30,31 This value is still significantly lower than 150 cm2 V−1 s−1 for Bi2Te3 or 900–1400 cm2 V−1 s−1 for PbTe.32,33 If we assume that each replacement of Zr by Sc leads to one hole as a carrier, the room temperature electron concentration should be completely compensated when the Sc concentration exceeds ∼5%. At low Sc content, the samples with 0 ≤ x ≤ 0.04 possess a negative value for σRH, caused by the highly mobile electrons, which is consistent with a substitutional doping explanation.
The carrier mobility depends on the band effective mass m* and the relaxation time τ roughly as μ = eτ/m*.34 An estimate of m* can be obtained from the ab initio calculations of the electronic band structure35 or from experimental Seebeck and Hall measurements (usually by applying the parabolic band approximation).36 Since the effective mass varies inversely with the curvature of the bands, a high effective mass is the result of shallow or flat bands, whereas a small effective mass is typical for highly dispersed bands. Based on ab initio calculations, a high mobility value for n-type ZrNiSn is expected owing to their light conduction band (CB). The valence band (VB), however, has been shown to have a higher effective mass, and so by substituting Zr with Sc, one might expect a lower mobilities (in magnitude) for p-type materials as the Fermi energy gets shifted into the VB at Γ.25,37 This is consistent with our experimental results, shown in Fig. 2b; the Hall mobilities of the heavily Sc-doped samples are much lower in magnitude than the n-type ZrNiSn undoped sample. In general, the transport properties of materials with small band gaps are influenced by both types of carriers,38 with a higher weight given for the carriers with higher mobility:
 | (5) |
Here, nn and np are the electron and hole concentrations, respectively, and μn and μp are the electron and hole mobilities, respectively. If μn ≥ μp, the sign for the Hall coefficient RH can be negative even if np ≥ nn. In order to obtain a positive value for the Hall coefficient, npμp needs to exceed nnμn.38 Because the individual carrier contributions, nn and μn, are unknown and difficult to determine, eqn (2) can be used assuming a single carrier type, but it will result in a value that is greater than either the true value for np or nn.
The Seebeck coefficient (S) for the Zr1−xScxNiSn solid solution are presented in Fig. 3. The pure ZrNiSn compound, without any Sc doping, displays a large negative Seebeck coefficient at room temperature, indicating a significant n-type defect concentration in ZrNiSn. With increasing Sc content, the value of the thermopower decreases, as compensating p-type defects (Sc on Zr sites) are added to the naturally n-type material. It can be seen from the change in sign of the Seebeck coefficient from negative to positive that holes become the predominant charge carriers. This sign change occurs at lower Sc contents than observed for the sign change of σRH (Fig. 2b), indicating that in this region of mixed conduction, the holes probably outnumber electrons. However, because the electrons are more mobile, the Hall coefficient does not change sign until x > 0.05 (note that the mobilities are squared, in eqn (5)), whereas the Seebeck coefficient is weighted by mobility to the first power.39 As observed in the Hall coefficient measurements, ambipolar conduction of both electrons and holes is most likely responsible for the decrease in the thermopower at high temperatures.
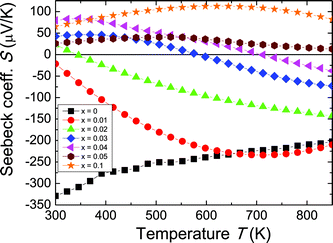 | ||
| Fig. 3 Temperature dependence of the Seebeck coefficient for the Zr1−xScxNiSn solid solution. The Seebeck coefficient shows a rollover due to bipolar conduction. | ||
In addition to indicating the onset of bipolar conduction, the maximum of the thermopower can be used for the estimation of the band gap, Eg, according to eqn (1),1 where we obtained values on the order of 0.05 eV. This is much smaller than the band gap suggested by Aliev et al. from electrical resistivity measurements (0.18 eV).40 The discrepancy between the estimation from our thermopower data and the literature estimates for the size of Eg in these compounds will be discussed in detail later.
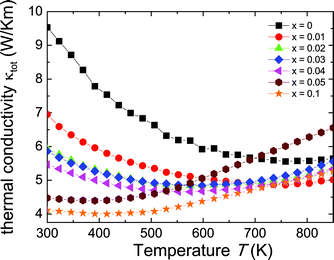
The total thermal conductivity (κtot) in a thermoelectric material is the sum of the electronic contribution (κe) and the lattice contribution (κL). The total thermal conductivity was calculated from the thermal diffusivity (D) with κ = CpDd, where Cp is assumed to be the Dulong–Petit heat capacity and d the density calculated from the molar mass and the lattice parameter for each sample obtained from XRD. As shown in Fig. 4, the room temperature thermal conductivity is reduced by 40% for Zr0.9Sc0.1NiSn as compared with the undoped ZrNiSn. Because this is accompanied by a decrease in resistivity (Fig. 2a), it is clear that this must be due to scattering of phonons from disorder induced by Sc substitutions, which reduces the lattice thermal conductivity (which is much greater than the electronic thermal conductivity at room temperature for all Sc compositions). Above room temperature, we can see an increasing thermal conductivity for the doped samples, which is consistent with the existence of both electrons and holes (as evidenced by Fig. 2b and 3). This effect occurs at lower and lower temperatures as the Sc content is increased. Although this is less pronounced for the Seebeck coefficient measurements, thermal conductivity is more sensitive, as it is affected by both the overall decrease of the resistivity and by the bipolar term of the thermal conductivity.
Optical properties and band gap estimation
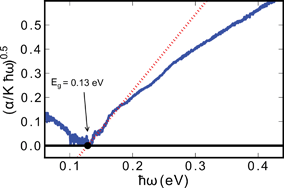
| (αhω)½ ∝ (hω − Eg) | (6) |
Here α is the absorption coefficient, hω is the photon energy, and Eg is the band gap derived from a linear extrapolation to zero absorption on the plot. The estimated value of the indirect optical band gap was 0.13 eV. Aliev et al. measured similar samples previously, and they reported a minimum in the absorption coefficient of approximately 2000 cm−1 (∼0.25 eV), a value that is larger than those measured in this work, whereas electrical resistivity measurements gave gaps closer to 0.18 eV.40 However, differences in results from those of Aliev et al. and ours could be due to the difference in the measurement technique used. We used DRIFTS, whereas Aliev et al. used transmission/reflection measurements. Nonetheless, we believe that the optical band gap reflects the true gap of the system.
The thermopower band gaps for the Zr1−xScxNiSn solid solution are compared to those of a series of n-type XNiSn samples from the literature, as shown in Fig. 6.
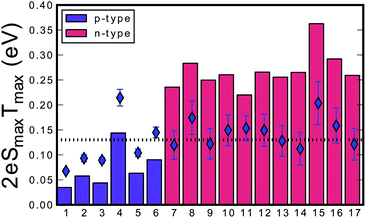 | ||
Fig. 6 Estimation of the band gap for different n-type (red bars) and p-type (purple bars) half-Heusler compounds using the Goldsmid–Sharp formula (Eg = 2eSmaxTmax) in units of eV versus the numerated HH compounds. The dotted line indicates the optical measured band gap of 0.13 eV for pure ZrNiSn from DRIFTS. The diamonds represent the estimated true band gap value that yields the experimental Smax and Tmax when using the full relation derived by Goldsmid and Sharp for an electron-to-hole weighted mobility ratio of A = 5![[thin space (1/6-em)]](https://www.rsc.org/images/entities/char_2009.gif) : :![[thin space (1/6-em)]](https://www.rsc.org/images/entities/char_2009.gif) (1) Sc0.03Zr0.97NiSn, (2) Sc0.04Zr0.96NiSn, (3) Sc0.0.5Zr0.95NiSn, (4) Sc0.1Zr0.9NiSn, (5) ZrCo0.08Ni0.92Sn,22 (6) ZrCo0.12Ni0.88Sn,22 (7) Zr0.75Hf0.25NiSn,42 (8) Zr0.5Hf0.5NiSn,42 (9) Zr0.25Hf0.75NiSn,42 (10) HfNiSn,42 (11) Ti0.95Hf0.05NiSn,43 (12) Ti0.95Hf0.05NiSn0.995Sb0.005,43 (13) Ti0.95Hf0.05NiSn0.99Sb0.01,43 (14) Ti0.95Hf0.05NiSn0.98Sb0.02,43 (15) Hf0.75Zr0.25NiSn0.99Sb0.01,44 (16) Hf0.5Ti0.25Zr0.25NiSn0.99Sb0.01,44 and (17) Hf0.25Ti0.5Zr0.25NiSn0.99Sb0.01.44 (1) Sc0.03Zr0.97NiSn, (2) Sc0.04Zr0.96NiSn, (3) Sc0.0.5Zr0.95NiSn, (4) Sc0.1Zr0.9NiSn, (5) ZrCo0.08Ni0.92Sn,22 (6) ZrCo0.12Ni0.88Sn,22 (7) Zr0.75Hf0.25NiSn,42 (8) Zr0.5Hf0.5NiSn,42 (9) Zr0.25Hf0.75NiSn,42 (10) HfNiSn,42 (11) Ti0.95Hf0.05NiSn,43 (12) Ti0.95Hf0.05NiSn0.995Sb0.005,43 (13) Ti0.95Hf0.05NiSn0.99Sb0.01,43 (14) Ti0.95Hf0.05NiSn0.98Sb0.02,43 (15) Hf0.75Zr0.25NiSn0.99Sb0.01,44 (16) Hf0.5Ti0.25Zr0.25NiSn0.99Sb0.01,44 and (17) Hf0.25Ti0.5Zr0.25NiSn0.99Sb0.01.44 | ||
A large difference in the Goldsmid–Sharp thermopower band gap is apparent when comparing Sc-doped p-type samples from this work and n-type literature results; both are much smaller than those estimated by ab initio calculations (∼0.5 eV).25,45 Here, we note that even though X (in XNiSn samples) varies through Zr, Hf, and Ti for n-type samples in Fig. 6, the band structures and band gaps are expected to be approximately the same.45 All of the n-type samples display a large Goldsmid–Sharp band gap (>0.2 eV) compared to the analogous XNiSn p-type samples. Although the difference might lead one to the conclusion that the choice of dopant will affect the size of the gap, it is important to consider the limitations of the simple Goldsmid–Sharp band gap estimation and the parameters that might affect the results. The Seebeck coefficient for a mixed semiconductor is given as:
 | (7) |
 | (8) |
 | (9) |
 | (10) |
 | (11) |
Although Goldsmid and Sharp state that even with a large mobility ratio value (A = 10), the simple band-gap estimation should hold to within ∼20%, we note that they assume a band gap of 10 kBTmax to derive this relation. This is a poor assumption for most materials, as the band gap in our system (and many others) is less than 5 kBTmax. In order to illustrate this point, we have plotted 2eSmaxTmax/Egversus Smax for a mobility ratio parameter A = 5 using eqn (10) and (11) (Fig. 7). The red line is the result for the n-type doping and the blue line displays the result for p-type doping. Data points in their corresponding colors were taken from their Goldsmid–Sharp band gap ratio to the optical band gap measured in this work (0.13 eV). The displayed error bars assume an error of ±10% in the thermopower and the optical band gap. Fig. 7 shows an increasing 2eSmaxTmax/Eg for the n-type samples, whereas it decreases for p-types. Qualitatively, this is because the more mobile electrons dominate the Seebeck coefficient equation because it is weighted by their conductivity; this forces the thermopower of the p-type samples to roll over at lower values, whereas n-type samples maintain higher thermopower at higher temperatures. When looking at recent HH literature including both calculations and experiments—it seems that there is still some uncertainty as to the nature of the valence and conduction bands. Some studies suggest that the smaller observed gaps could be due to impurity doping.47,48 Experimental evidence of this is largely based on log(ρ) vs. 1/T behavior40,47—the viability of which will certainly be affected by a large electron-to-hole weighted mobility ratio, A. However, because we observe a small optical gap in the undoped ZrNiSn sample, the narrow gap cannot be explained by impurities alone. Several studies suggest that antisite defects or disorder on the Ni sites can lead to impurity bands within the gap.46 Recent synchrotron data presented by Xie et al. suggests that partial occupation of the vacant Ni sites occurs in ZrNiSn49,50 and the effect is observed in the transport properties. The proposed picture of in-gap Ni states induced by disorder is consistent with the results obtained here. In fact, our discovery of a narrow gap supports this picture since these “in-gap” states, could simply compose the valence band from which we observe optical transitions.
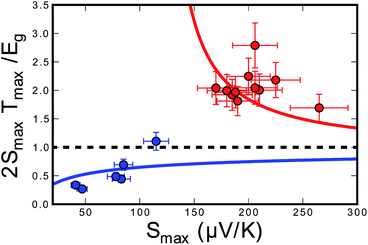 | ||
| Fig. 7 A plot of the ratio of the Goldsmid–Sharp band gap (2eSmaxTmax) to the true band gap for different p- and n-type half-Heusler compounds in red and blue respectively for an electron-to-hole weighted mobility ratio of A = 5. The solid lines uses Goldsmid and Sharp's full original derivation (eqn (10) and (11)) to estimate this ratio. Experimental points use the observed maximum Seebeck coefficient (Smax) and temperature (Tmax) and the optical band gap (Eg,optical). An error of ±10% was assumed for the thermopower measurements and the band gap estimations. | ||
While the inherent very small mobility in p-type ZrNiSn may be disheartening, it beneficially results in suppressed bipolar effects in the n-type ZrNiSn system. Thus, the low mobility minority carrier enables the n-type material to maintain a high thermopower at high temperatures, despite its narrow band gap. This is contrary to the high band gaps found in other p-type HHs, like TiCoSb or the recently identified FeV0.6Nb0.4Sb where the band gap estimated from the Goldsmid–Sharp formula is around 0.57 eV and 0.4 eV respectivley.51,52 Because of the narrow gaps in XNiSn HH materials, one might consider the effect of band non-parabolicity using the two-band Kane model (as applied by Sofo and Mahan).53 Although, because DFT calculations show indirect gap behavior—the two-band Kane model should not be applicable.45
Conclusions
In this work, the thermoelectric transport properties of Sc-substituted ZrNiSn HH solid solutions were systematically studied. The substitution of Zr by Sc led to the successful introduction of holes into the system, resulting in a p-type material with a maximum thermopower of +115 μV K−1 at 650 K. Owing to the introduction of holes into the system, the Seebeck coefficient became positive and increased with increasing temperature, reaching a maximum as the higher mobility n-type carriers were thermally activated. Generally, the transport properties are dominated by the high mobility of the electrons over that of the holes, which can be seen from the RHσ product (in units of mobility). Both p-type data from this work and n-type literature data for the thermopower gap deviated significantly from the optical measurements (0.13 eV), but we have shown that this can be simply explained by a large difference in the weighted mobility between electrons and holes. A high electron-to-hole weighted mobility ratio leads to a suppression of the bipolar effect in the thermoelectric transport properties which is essential for high zT values in n-type XNiSn (X = Ti, Zr, Hf) HH compounds.Mechanisms to suppress bipolar effects have been discussed to great length in a variety of systems that range from simply changing the band gap or carrier concentration,54,55 to preferential minority carrier scattering at grain boundaries or nano-inclusions.56,57 This work provides a strategy and method for characterizing bipolar suppression, given a material can be doped both p- and n-type. While there have been efforts to characterize “band engineering” in materials with a single carrier type, the quality factor analysis has not been extended to valence-conduction band systems. In systems such as Bi2Te3, the most common commercial thermoelectric material, both high and room temperature zT is limited due to minority carrier activation. Strategies to reduce the minority carrier weighted mobility could provide significant impact on the thermoelectric efficiency.
Acknowledgements
We gratefully acknowledge the German BMBF joint project TEG 2020. G.J.S. would like to acknowledge funding from the Bosch-BERN program and The Materials Project: supported by Department of Energy's Basic Energy Sciences program under Grant no. EDCBEE, DOE Contract DE-AC02-05CH11231 for their funding. The authors would also like to acknowledge the Molecular Materials Research Center (MMRC) at the California Institute of Technology for use of their optical instruments for measurements in this work. Moreover, we would like to thank Chirranjeevi B. Gopal, Julia Krez, and Fivos Drymiotis for helpful discussions.Notes and references
- H. J. Goldsmid and J. W. Sharp, J. Electron. Mater., 1999, 28, 869 CrossRef CAS.
- J. G. Snyder and E. S. Toberer, Nat. Mater., 2008, 7, 105 CrossRef PubMed.
- C. Uher, J. Yang, S. Hu, D. T. Morelli and G. P. Meisner, Phys. Rev. B: Condens. Matter Mater. Phys., 1999, 59, 8615 CrossRef CAS.
- S. R. Culp, J. W. Simonson, S. J. Poon, V. Ponnambalam, J. Edwards and T. M. Tritt, Appl. Phys. Lett., 2008, 93, 022105 CrossRef PubMed.
- P.-J. Lee and L.-S. Chao, J. Alloys Compd., 2010, 504, 192 CrossRef CAS PubMed.
- Q. Shen, L. Chen, T. Goto, T. Hirai, J. Yang, G. P. Meisner and C. Uher, Appl. Phys. Lett., 2001, 79, 4165 CrossRef CAS PubMed.
- M. Koehne, T. Graf, H. Elmers and C. Felser, Ger. WO 2011/154189 A2, Johannes Gutenberg-University, 2011.
- S. Sakurada, N. Shutoh and S. Hirono, US 7,745,720 B2, 2010.
- N. Shutoh, S. Sakurada, N. Kondo and N. Takezawa, US 2012/0037199 A1, 2012.
- J. Krez, J. Schmitt, G. J. Snyder, C. Felser, W. Hermes and M. Schwind, J. Mater. Chem. A, 2014, 2, 13513 CAS.
- W. Xie, A. Weidenkaff, X. Tang, Q. Zhang, J. Poon and T. M. Tritt, Nanomaterials, 2012, 2, 379 CrossRef CAS PubMed.
- T. M. Tritt and M. A. Subramanian, MRS Bull., 2006, 31, 188 CrossRef.
- T. M. Tritt, Recent Trends in Thermoelectric Materials Research II, Academic Press, San Diego, CA, USA, 2001 Search PubMed.
- T. Graf, C. Felser and S. S. Parkin, Prog. Solid State Chem., 2011, 39, 1 CrossRef CAS PubMed.
- S. Chen and Z. Ren, Mater. Today, 2013, 16, 387 CrossRef CAS PubMed.
- H. Xie, H. Wang, Y. Pei, C. Fu, X. Liu, G. J. Snyder, X. Zhao and T. Zhu, Adv. Funct. Mater., 2013, 32, 5123 CrossRef.
- Y. Liu, A. Page, P. Sahoo, H. Chi, C. Uher and P. F. P. Poudeu, Dalton Trans., 2014, 43, 8094 RSC.
- X. Yan, G. Joshi, W. Liu, Y. Lan, H. Wang, S. Lee, J. W. Simonson, S. J. Poon, T. M. Tritt, G. Chen and Z. F. Ren, Nano Lett., 2011, 11, 556 CrossRef CAS PubMed.
- N. J. Takas, P. Sahoo, D. Misra, H. Zhao, N. L. Henderson, K. Strokes and P. F. P. Poudeu, J. Electron. Mater., 2011, 40, 662 CrossRef CAS.
- M. S. Lee, P. F. P. Poudeu and S. D. Mahanti, Phys. Rev. B: Condens. Matter Mater. Phys., 2011, 83, 085204 CrossRef.
- S. Populoh, O. C. Brunko, K. Galazka, W. Xie and A. Weidenkaff, Materials, 2013, 6, 1326 CrossRef CAS PubMed.
- H. Xie, B. He, T.-J. Zhu and X.-B. Zhao, J. Electron. Mater., 2012, 41, 1826 CrossRef CAS PubMed.
- Y. Kimura, T. Tanoguchi and T. Kita, Acta Mater., 2010, 58, 4354 CrossRef CAS PubMed.
- A. Horyn, O. Bodak, L. Romanka, Y. Gorelenko, A. Tkachuk, V. Davydov and X. Stadnyl, J. Alloys Compd., 2004, 363, 10 CrossRef CAS.
- S. Ouardi, G. H. Fecher, B. Balke, X. Kozina, G. Stryganyuk, S. Lowitzer, D. Ködderitzsch, H. Ebert, E. Ikenaga and C. Felser, Phys. Rev. B: Condens. Matter Mater. Phys., 2010, 82, 085108 CrossRef.
- W. Jeitschko, Metall. Trans., 1970, 1, 3159 CAS.
- K. A. Borup, E. S. Toberer, L. D. Zoltan, G. Nakatsukasa and M. Errico, Rev. Sci. Instrum., 2012, 83, 123902 CrossRef PubMed.
- S. Iwanaga, E. S. Toberer, A. LaLonde and G. J. Snyder, Rev. Sci. Instrum., 2011, 82, 063905 CrossRef PubMed.
- W. W. Wendlandt and H. G. Hecht, Reflectance Spectroscopy, Wiley, New York, USA, 1966, p. 63 Search PubMed.
- Z. M. Gibbs, A. LaLonde and G. J. Snyder, New J. Phys., 2013, 15, 075020 CrossRef.
- C. Yu, T.-J. Zhu, R.-Z. Shi, Y. Zhang, X.-B. Zhao and J. He, Acta Mater., 2009, 57, 2757 CrossRef CAS PubMed.
- J. L. Wang, H. Wang, G. J. Snyder, X. Zhang, Z. H. Ni and Y. F. Chen, J. Phys. D: Appl. Phys., 2013, 46, 405301 CrossRef.
- Y. Ravich, B. Efimova and I. Smirnov, Semiconducting Lead Chalcogenides, Plenum, New York, USA, 1970 Search PubMed.
- J. H. Goldsmid, Introduction to Thermoelectrics, Springer, Heidelberg, Germany, 2010 Search PubMed.
- P. Larson, S. D. Mahanti and M. G. Kanatzidis, Phys. Rev. B: Condens. Matter Mater. Phys., 2000, 62, 12754 CrossRef CAS.
- P. Böttger, G. Pomrehm, G. Snyder and T. Finstad, Phys. Status Solidi A, 2011, 208, 2753 CrossRef.
- V. A. Romanka, Y. V. Stadnyk, M. G. Shelyapina, D. Fruchart, V. F. Chekurin, L. p. Romanka and Y. K. Gorelenko, Semiconductors, 2006, 40, 655 CrossRef.
- E. Putley, Contemp. Phys., 1975, 16, 2 CrossRef.
- C. M. Jaworski, M. D. Nielsen, H. Wang, S. N. Girard, W. Cai, W. D. Porter, M. G. Kanatzidis and J. P. Heremans, Phys. Rev. B: Condens. Matter Mater. Phys., 2013, 87, 045203 CrossRef.
- F. G. Aliev, N. B. Brandt, V. V. Moshchalkov, V. V. Kozyrjov, R. V. Skolozdra and A. I. Belogorokhov, Z. Phys. B: Condens. Matter, 1989, 75, 167 CrossRef CAS.
- J. Tauc, Mater. Res. Bull., 1968, 3, 1 CrossRef.
- C. Yu, H. Xie, C. Fu, T. Zhu and X. Zhao, J. Mater. Res., 2012, 27, 2457 CrossRef CAS.
- S.-W. Kim, Y. Kimura and Y. Mishima, Intermetallics, 2007, 15, 349 CrossRef CAS PubMed.
- G. Joshi, T. Dahal, S. Chen, H. Wang, J. Shiomi, G. Chen and Z. Ren, Nano Energy, 2013, 2, 82 CrossRef CAS PubMed.
- S. Ogut and K. M. Rabe, Phys. Rev. B: Condens. Matter Mater. Phys., 1995, 51, 10443 CrossRef CAS.
- D. T. Do, S. D. Mahanti and J. J. Pulikkoti, J. Phys.: Condens. Matter, 2014, 26, 275501 CrossRef PubMed.
- J. W. Simonson and S. J. Poon, J. Phys.: Condens. Matter., 2008, 20, 255220 CrossRef.
- F. G. Aliev, V. V. Kozyrkov, V. V. Moshchalkov, R. V. Scolozdra and K. Durczewski, Z. Phys. B: Condens. Matter, 1990, 80, 353 CrossRef CAS.
- H. Xie, J. L. Mi, L. P. Hu, N. Lock, M. Christensen, C. G. Fu, B. B. Iversen, X. B. Zhao and T. J. Zhu, CrystEngComm, 2012, 14, 4467 RSC.
- H. Xie, H. Wang, C. Fu, Y. Liu, G. Jeffrey Snyder, X. Zhao and T. Zhu, The intrinsic disorder related alloy scattering in ZrNiSn half-Heusler thermoelectric materials, Sci. Rep. Search PubMed , in Revision.
- P. Qui, X. Huang and X. Chen, J. Appl. Phys., 2009, 106, 103703 CrossRef PubMed.
- C. Fu, T. Zhu, Y. Pei, H. Xie, H. Wang, G. J. Snyder, Y. Liu, Y. Liu and X. Zhao, Adv. Energy Mater. DOI:10.1002/aenm.201400600.
- J. O. Sofo and G. D. Mahan, Phys. Rev. B: Condens. Matter Mater. Phys., 1994, 49, 4565 CrossRef CAS.
- L. D. Zhao, H. J. Wu, S. Q. Hao, C. I. Wu, X. Y. Zhou, K. Biswas, J. Q. He, T. P. Hogan, C. Uher, C. Wolverton, V. P. Dravid and M. G. Kanatzidis, Energy Environ. Sci., 2013, 6, 3346 CAS.
- P. F. Qui, R. H. Liu, J. Yang, X. Shi, X. Y. Huang, W. Zhang, L. D. Chen, J. Yang and D. J. Singh, J. Appl. Phys., 2012, 111, 023705 CrossRef PubMed.
- F. Yu, J. Zhang, D. Yu, J. He, Z. Liu, B. Xu and Y. Tian, J. Appl. Phys., 2009, 105, 094303 CrossRef PubMed.
- A. J. Minnich, M. S. Dresselhaus, Z. F. Ren and G. Chen, Energy Environ. Sci., 2009, 2, 466 CAS.
Footnote |
| † These authors have contributed equally to this work. |
| This journal is © The Royal Society of Chemistry 2015 |

