Variations in Mn(II) speciation among organisms: what makes D. radiodurans different
E. M.
Bruch
a,
S.
Thomine
b,
L. C.
Tabares
a and
S.
Un
*a
aService de Bioénergétique, Biologie Structurale et Mécanismes (CNRS UMR-8221), Institut de Biologie et de Technologies de Saclay, CEA-Saclay, F-91191 Gif-sur-Yvette, France. E-mail: sun.un@cea.fr; Fax: +33-1-69088717; Tel: +33-1-69082842
bInstitut des Sciences du Végétal, CNRS UPR 2355, Saclay Plant Science, F-91198 Gif-sur-Yvette, France
First published on 29th October 2014
Abstract
The manganese(II) speciation in intact cells of D. radiodurans, E. coli, S. cerevisiae and Arabidopsis thaliana seeds was measured using high-field electron paramagnetic resonance techniques. The majority of the Mn(II) ions in these organisms were six-coordinate, bound predominately by water, phosphates and nitrogen-based molecules. The relative distribution of the different phosphates in bacteria and S. cerevisiae was the same and dominated by monophosphate monoesters. Mn(II) was also found bound to the phosphate backbone of nucleic acids in these organisms. Phosphate ligation in Arabidopsis seeds was dominated by phytate. The extent of nitrogen ligation in the four organisms was also determined. On average, the Mn(II) in D. radiodurans had the most nitrogen ligands followed by E. coli. This was attributed to higher concentrations of Mn(II) bound to proteins in these species. Although constitutively expressed in all four organisms, MnSOD was only detected in D. radiodurans. As previously reported, D. radiodurans also accumulates a second abundant Mn containing protein species. The high concentration of proteinaceous Mn(II) is a unique feature of D. radiodurans.
Introduction
Manganese is essential to most, if not all, organisms. In its most common state as Mn(II), it is found in a wide variety of chemical forms from simple complexes to redox elements in enzymes and even in transient microcrystals.1 Manganese metalloenzymes play a number of important roles. One of the most crucial is cellular oxidative stress response. For example, manganese superoxide dismutase (MnSOD) controls levels of superoxide, the precursor to many toxic reactive oxygen species (ROS). Simple inorganic Mn(II) complexes have been shown to be capable of catalytically carrying out some of the same antioxidant reactions as manganese enzymes do.2–4 Mn(II) orthophosphate (Pi) can dismutate superoxide although at intracellular concentrations at much slower rates than MnSOD.2,3 This antioxidant chemistry of small Mn(II) complexes has been postulated to play a role in pathenogenesis5 and radio-resistance.6Deinococcus radiodurans is interesting in this context. This bacteria is extremely radio-resistant and its high manganese content is postulated to protect it against ROS.7–9 However, there is a current debate regarding whether this detoxification is associated with Mn(II) enzymes or low molecular weight complexes.10–12 Accurate understanding of Mn(II) speciation in cells is critical to this issue. Studies based on size exclusion chromatography performed in soluble extracts of D. radiodurans found that in broken cells only a relatively little amount of Mn(II) is bound to proteins.6 However, such conventional approaches disrupt cellular integrity risk altering the in vivo equilibrium concentrations of potentially important species. Electron paramagnetic resonance (EPR) techniques have been used to circumvent this problem by directly measuring speciation in intact cells.10–12 The first EPR study of D. radiodurans detected significant amounts of MnSOD and a second Mn(II) containing species, which will be referred to as Mn:(N-His)2.11 In stationary D. radiodurans cells, this latter species accounted for more than 30% of the total Mn(II) and MnSOD about 40%. At odds with these findings, a second more recent EPR study concluded that a majority of the Mn(II) in E. coli were in low symmetry environments while in D. radiodurans they were in highly symmetric ones.12 The former was taken as evidence for enzymes such as MnSOD and the latter for low molecular weight complexes. Hence, the two studies present a very different picture regarding the speciation of Mn(II) in D. radiodurans. The original study employed high magnetic fields (3 and 10 T) and microwave frequencies (95 and 285 GHz)11 that afforded higher resolution than the second which was carried out with conventional fields and frequencies (1 T and 35 GHz and below).12 One consequence of higher fields and frequencies was the unambiguous identification of MnSOD and Mn:(N-His)2 by their unique high-field fingerprint spectra. Another was the identification of a larger number of different ligands by their electron nuclear double resonance (ENDOR) spectra.11
We have examined how Mn(II) speciation varies among four different organisms using the same high-field EPR (HFEPR) techniques. Yeast (Saccharomyces cerevisiae) is notable for its high internal inorganic phosphate concentrations and along with E. coli has been studied using conventional EPR.10,12 Together with D. radiodurans, they provided a comparison of how Mn(II) and phosphate concentrations affect speciation. Arabidopsis thaliana seeds also have high phosphate concentrations but in the form of organic phytate, a very strong chelator of transition metals.13–15 Wild-type and mutant phytate-free13 seeds provided a means for assessing how sensitive the spectroscopic methods were to the speciation of Mn(II) phosphates. All three organisms and D. radiodurans constitutively express MnSOD which gave us the opportunity to assess the quantities detected in D. radiodurans. We have also used 95 GHz pulse electron double resonance detected NMR (ELDOR-NMR)16 in order to assess the extent and nature of nitrogen ligation to the Mn(II) centers.
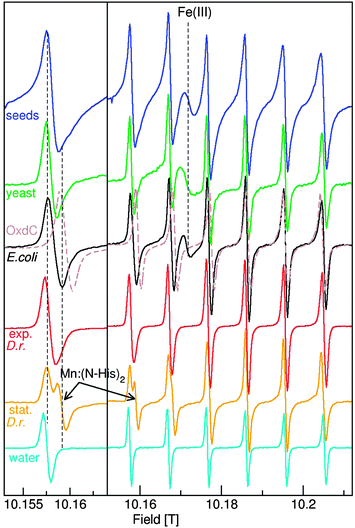
We briefly summarize the EPR techniques that we have used. The continuous wave HFEPR (cw-HFEPR) of most Mn(II) centers, like [Mn(H2O)6]2+, are simply composed of six well-resolved sharp lines (Fig. 1). Their intensities diminish going from low to high-field as they become progressively broader. The separation between these lines is the result of the hyperfine coupling (A55Mn) between the spin of the five unpaired electrons and the 55Mn nucleus. A55Mn depends on the covalency of the manganese–ligand bonds.17 For example, the high covalency of the bond between Mn(II) and imidazole nitrogens made Mn:(N-His)2 easily distinguishable from other cellular Mn(II) species (Fig. 1).11,18 By contrast, the effect of Mn(II) zero-field interaction is complex. It arises from the internal magnetic and orbital interactions among the unpaired electrons and has a complex dependence on the structure of the metal binding site and nearby local charges19 and induces the progressive broadening of the peaks that is evident in the spectra of [Mn(H2O)6]2+, and the pH 8 six coordinate Mn(II) site of oxalate decarboxylase (OxdC) spectra.20 This broadening effect on the Mn(II) spectra is inversely related to the observation frequency, this is why the spectra obtained at 10 T and 285 GHz are much sharper and simpler than those taken at conventional field and frequencies (0.3 T and 9 GHz). Although the size of the zero-field interaction has been used to discriminate whether certain cellular Mn(II) are in a small molecule or macromolecular environment,12 we will show that this is generally not the case. Nonetheless, the zero-field along with 55Mn hyperfine interactions do provide a tool for discriminating Mn(II) species, based on the electronic interactions of the metal with the ligands and the environment.
ENDOR provided a direct means for identifying and counting certain ligands, in particular water and phosphates.10–12,18 Electron spin echo envelope modulation (ESEEM) has been used to characterize nitrogen ligation in E. coli and D. radiodurans.12 As an alternative, in this study, we have used 95 GHz ELDOR-NMR to do this.
By combining these three types of measurements, it was possible to determine the average Mn(II) ligand stoichiometries for each of the different organisms. This has helped to define the possible roles that the Mn(II) centers can play in the oxidative stress response in D. radiodurans. We have also used these techniques to characterize not only changes associated with speciation, but differences in the environment and localization of Mn(II) species. In contrast to previous reports, our results establish that the Mn(II) speciation in D. radiodurans is distinct from the three model biological systems and involves significant participation of proteins that were undetected by conventional EPR and metabolomic analyses.
Experimental procedures
Cell samples
The cells were grown in Erlenmeyer flasks with media occupying 20% of the total flask volume and agitated at 180 rpm. The optical density (OD) was followed spectrophotometrically at 600 nm using a UVIKON XL UV/VIS double-beam spectrophotometer. E. coli DH5α and Saccharomyces cerevisiae BY4741 strains were grown in TGYx2 medium at 37 °C and TYD at 30 °C, respectively, until they reached a stationary phase. D. radiodurans cells were grown in TGYx2 medium at 32 °C. After achieving the desired OD, the cells were centrifuged for 5 min at 3000 × g and the resulting pellets were washed three times with buffer (50 mM Tris pH 8, 150 mM NaCl). The suspensions were then transferred into appropriate sample tubes. For the 285 GHz cw-HFEPR measurements, plastic Nalgene 2 mL cryotubes were used as sample holders. The cell suspension was placed directly into the tube and centrifuged for 2 minutes at 1500 × g. The supernatant was discarded and the cell pellets, with a volume of approximately 600 μL, were frozen immediately in liquid nitrogen. For ENDOR and ELDOR-NMR a capillary quartz tube (Bruker, bottom-beaded 95 GHz sample tube) was filled with the cell suspension and compacted by centrifugation, the amount of cells in the tube was enough to fill the active volume of the microwave cavity (for more details see ref. 10). After frozen in liquid nitrogen the samples were stored at 200 K until use. The samples were cooled in liquid nitrogen before they were loaded. This insured that they were well frozen at all times. The viability of E. coli, S. cerevisiae and D. radiodurans cells after being flash frozen in liquid nitrogen has been shown to be higher than 80%.11,21Dry seeds from wild type A. thaliana and ipk1/ipk2β double-mutant17 were harvested from plants grown on potting soil (Tonerde PAM Argile, Brill, France) in a growth chamber at 21 °C with 60% humidity, under 180 μmol photon per m2 s with a 16 h photoperiod and regular watering (2 to 3 times per week). After harvest, seeds were stored at 8 °C in a well-aerated dark room until use. Intact dry seeds were used for the measurements.
Model complexes
Unless otherwise stated all solutions contained 50 μM Mn(II) from Mn(ClO4)2·6H2O (Sigma-Aldrich) and their pH were adjusted using HCl and KOH. [Mn(H2O)6]2+ refer to a simple Mn(II) solution of 20% v/v glycerol and water. [Mn(Imidazole)4]2+ was formed by mixing Mn(II) and 1 M imidazole in 20% v/v glycerol pH adjusted to 7, [Mn(Imidazole)2(H2O)4]2+ with 50 mM imidazole and [Mn(Imidazole)(H2O)5]2+ with 5 mM imidazole.18 pH 7 Mn:Pi, ([Mn(HPO4)2(H2O)4]2−), was obtained by mixing Mn(II) and 50 mM potassium phosphate in 100 mM HEPES buffer and pH 5 Mn:Pi, by adding Mn(II) to pH adjusted 100 mM phosphoric acid. Mn:PPi was formed by combining Mn(II) and 100 mM pyrophosphate. Mn:phytate was obtained directly from 42 mg mL−1 of phytate isolated from rice (Sigma-Aldrich) in water, the concentration of contaminating Mn(II) was already approximately 50 μM. [Mn(Glutamate)(H2O)4]2+ were formed in a solution of 50 μM Mn(II) and 100 mM potassium glutamate pH adjusted to 7.5. The 285 GHz cw-HFEPR measurements of [Mn(Glutamate)(H2O)4]2+ showed no [Mn(H2O)6]2+ was present and 95 GHz proton ENDOR measurement identified a complex having 3.6 water ligands. The ELDOR-NMR measurements confirmed a single nitrogen ligand. This confirmed the stoichiometry reported in the literature.22The zero-field interaction of [Mn(Imidazole)(H2O)5]2+ was determined in the same manner as previously for that of [Mn(Imidazole)4]2+.18 As expected, the 4 K spectra was a mixture of [Mn(Imidazole)(H2O)5]2+ and [Mn(H2O)6]2+. Fitting the outer edges left the spectrum of [Mn(H2O)6]2+. The zero-field D value was 1.10 and E value 0.34 GHz with a distribution of 0.4 GHz.
Commercial concanavalin-A (Sigma-Aldrich) was washed with 10 mM pH 7 HEPES and concentrated. The final sample also contained 150 mM NaCl. Comparison of optical and atomic absorption data indicated that about 20% of the Mn(II) binding sites were occupied. The concentration of Mn(II) was about 150 μM.
DNA from salmon testes (Sigma-Aldrich) was dissolved in water and washed three times with water using a 10 kDa molecular weight cut-off filter to eliminate small fragments. The Mn:DNA complex was formed by adding Mn(II) to a 1 mg mL−1 solution of DNA.
EPR spectroscopy
The 285 GHz cw-HFEPR spectra were taken at 23 K on a locally-built HFEPR spectrometer23 under non-saturating conditions using 2–10 G modulations depending on the nature of the species. The 95 GHz ELDOR-NMR and ENDOR spectra were obtained at 6 K using a Bruker Elexsys II 680 EPR spectrometer equipped with a Bruker “Power upgrade 2”, 500 W Amplifier Research radiofrequency amplifier and an Oxford Instruments CF935 flow cryostat. All ENDOR spectra were recorded using the method of Davies.24 They were obtained with a 200 ns microwave preparation pulse followed by a 20 μs radiofrequency pulse and two-pulse spin-echo detection (10 and 20 ns microwave pulses separated by 300 ns). 31P ENDOR spectra were symmetrized about the 31P NMR frequency. The ELDOR-NMR spectra were obtained by sweeping the frequency (νex) of a 90 μs “high-turn angle” pulse followed by standard spin-echo detection at νobs using either 120 and 240 or 300 and 600 ns pulses depending on the experiments. The ELDOR-NMR spectra were normalized as previously described.18 All 95 GHz ELDOR-NMR and ENDOR measurements were carried out using the highest magnetic-field Mn(II) hyperfine line, corresponding to the mS = −1/2 mI = +5/2 ↔ mS = +1/2 mI = +5/2 transition, corresponding to lines at 10.205 T in the 285 GHz spectra shown in Fig. 1. Ligand counting methods exploited in this study have been previously described.11,18,25Results
Characterization of Mn(II) centers
The 285 GHz Mn(II) cw-HFEPR spectra of the four organisms are shown in Fig. 1. The average A55Mn values of D. radiodurans, E. coli, yeast (S. cerevisiae) cells and A. thaliana seeds were all about 9.49 mT, measurably smaller than 9.53 mT of [Mn(H2O)6]2+, but much larger than 9.03 mT of OxdC. The much smaller OxdC value was due to the strong influence of the three histidines involved in metal binding.20,26 The lines of the organism spectra were considerably broader than those of [Mn(H2O)6]2+ and their shapes were characteristic of a mixture of centers with different g and A55Mn values arising from the mixture of different Mn(II) centers present in the cells. The dashed vertical lines on the left panel of Fig. 1 show that all the organisms had significant intensity in the same regions where Mn:(N-His)2 and OxdC contribute, indicating the likely presence of centers with multiple nitrogen ligands. E. coli, as well as yeast and Arabidopsis seeds, also had a broad featureless resonance arising from an Fe(III) species that was absent in D. radiodurans cells likely reflecting its high Mn/Fe ratio.7As discussed above, the zero-field interactions progressively broaden the six lines, as is the case for [Mn(H2O)6]2+ in Fig. 1. Yet, the fifth and sixth lines of the D. radiodurans, E. coli and yeast spectra were narrower than their first. In these instances, the effect of the zero-field interactions was masked by the distributions in the other spin parameters. Since the last two lines of these organisms were no broader than those of OxdC (Fig. 1), none of the Mn(II) centers that contributed to sharp six line spectra in these organisms had zero-field interactions that exceeded 0.04 cm−1, the value of the protein site.20 The Arabidopsis seed signals were broader, arising from centers with larger zero-field interactions no larger than 0.08 cm−1.
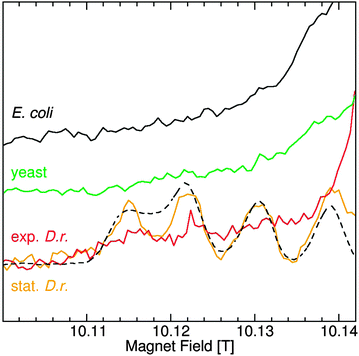
The spectra of Mn(II) centers with much larger zero-field interactions no longer have six-lines and are much more complex.27 This is the case for MnSODs that have zero-field interactions in excess of 0.33 cm−1, the largest for Mn(II) centers of biological significance. The low-field portion of the MnSOD that is readily detected in stationary D. radiodurans cells is shown in Fig. 2. The zero-field interactions of the MnSODs are so sensitive to their environments that it can be used to distinguish active from non-active forms of the isolated proteins such as those bound to inhibitors.19 The D. radiodurans MnSOD resonances exactly match those of the isolated active E. coli protein (Fig. 2),11 suggesting that it is also in the active form. Although MnSOD is constitutively expressed in E. coli and yeast cells, Fig. 2 shows that its concentration in both cases was apparently below the detection limit of the measurements and its relative contribution to the total Mn(II) in these two organisms was substantially less than the 40% found for D. radiodurans MnSOD.
Significant concentrations of Mn(II) species with large zero field interactions have been reported in E. coli;12 however, this did not appear to be the case. With the exception of D. radiodurans MnSOD, there were no spectral features between 10.13 and 10.14 T in any of the HFEPR spectra of the other organisms, except for the broad Fe(III) component and the weak broad Mn(II) resonances from lower spin-states (see ref. 20 for details). From this it can be concluded that there was no significant concentration of centers with zero-field interactions between 0.33 cm−1 and 0.08 cm−1, the values for MnSOD and Arabidopsis, respectively. This also meant that since ENDOR and ELDOR-NMR are limited to Mn(II) centers with sharp six line spectra (that is those that have small zero-field interactions), these techniques covered all of the Mn(II) except for the MnSOD and only partially accounted for the Arabidopsis seed centers with large zero-field interactions.
The relative distribution of different phosphate ligands
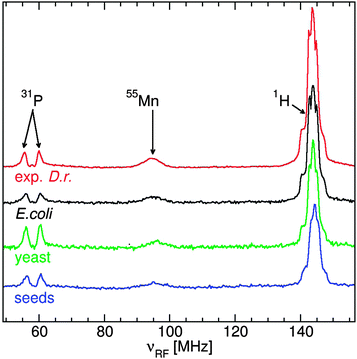
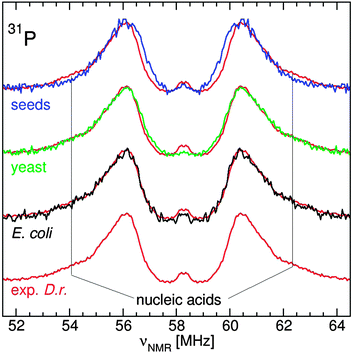
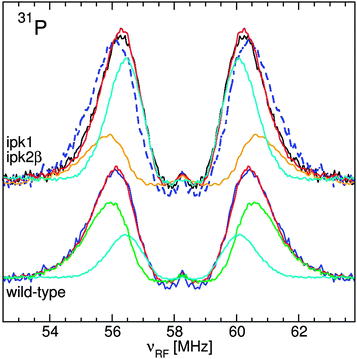
The ENDOR spectra of the yeast, Arabidopsis seeds E. coli and D. radiodurans were similar (Fig. 3): a broad resonance at 90 MHz from 55Mn nuclei; a doublet from 31P nuclei of phosphates at their corresponding NMR frequency of 58 MHz; and a structured resonance at 144 MHz, the proton NMR frequency, arising mostly from water ligands.10–12 Yeast cells had the most phosphate, about 1.8 phosphate ligands per Mn(II) compared to 1.5 for the seeds and 0.8 for exponential D. radiodurans and E. coli. As a reference, in a neutral pH solution of 50 μM Mn(II) in 50 mM Pi, mimicking concentrations in yeast cytosol,28 each Mn(II) had 2 phosphate ligands (data not shown). The similarity between the two bacteria was consistent with previous measurements.12The 31P ENDOR spectrum of D. radiodurans has been shown to be composed of contributions from three pools of phosphates: nucleic acids (24%), fructose-1,6-bisphosphate (52%) and Pi/polyPi which included Pi, pyrophosphate, polyphosphates, ATP and ADP (20%). Each of these were distinguishable by their 31P hyperfine couplings (A31P), the separation of their respective doublets.11 At neutral pH, members of the Pi/polyPi pool have similar A31P while those of phosphate monoesters are measurably larger and phosphate diesters are even more so. As can be seen in Fig. 4, the shapes of the yeast and E. coli31P ENDOR spectra are essentially the same as that of D. radiodurans demonstrating that these two organisms had nearly the same relative distribution of phosphate ligands as D. radiodurans. This is in contrast to earlier interpretation of the yeast 31P ENDOR spectrum as arising from only a composite of Pi and polyphosphate ligands.10 The Arabidopsis seed spectrum was different. It had little or no nucleic acid component and extended more inward indicating species with smaller A31P. Further examination of the seeds revealed the origins of these differences.
Phytate is the largest phosphorus source in Arabidopsis seeds contributing significantly to the total seed mass, about 22 nmol mg−1,13 and has a high affinity for metal ions.14,15 We therefore examined the contribution of Mn:phytate to the ENDOR spectrum. A very good linear-regression fit of the seed line-shape was obtained using the ENDOR spectra of pH 5 Mn:phytate and pH 7 Mn:PPi in a 2 to 1 ratio (Fig. 5). No other contributions from our extensive library of phosphate spectra, that included those of the most abundant inorganic phosphates and phosphate metabolites, were required. To further confirm the involvement of phytate, we analyzed the spectrum from seeds of the Arabidopsis thaliana ipk1/ipk2β double mutant that is incapable of synthesizing phytate.13 In order to adequately fit the inward shifted line-shape of the 31P spectrum of this mutant, a 2 to 1 composite of the spectra of pH 7 Mn:PPi and pH 5 Mn:Pi was required (Fig. 5). Despite this change, the integrated intensity of the 31P ENDOR spectrum of the mutant was the same as that of the wild type. This was consistent with the colorimetric quantification of Pi which showed that both had the same phosphate content.13 The acid digestion required for such assays hydrolyzes the PPi and, thus, masked the details of how Arabidopsis compensated for the loss of phytate. Hence, ENDOR spectroscopy of Arabidopsis seeds combined with the use of mutants revealed an original involvement of phytate. These measurements further demonstrated that ENDOR was capable of resolving the various pools of phosphates. Moreover, it showed that 31P ENDOR is not only sensitive to the global concentration of phosphates, but also to their identities and in this case even their physicochemical environments (e.g. pH).
The determination of number of water ligands
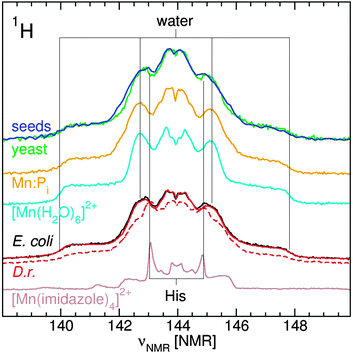
The 95 GHz 1H ENDOR spectra of yeast, E. coli and D. radiodurans were superior in simplicity and resolution than those obtained at 35 GHz.10,12 The major contribution to the 1H ENDOR spectra of all four organisms was from water ligands (Fig. 6). Exponential D. radiodurans had 4.5 water per Mn(II); stationary radiodurans, 3.5; E. coli, 4.0; seeds, 3.0 and yeast, 3.0. In our previous study, the difference between the spectra of D. radiodurans and [Mn(H2O)6]2+ was attributed to contributions from histidine ligands.11 As indicated by the guidelines in Fig. 6, similar contributions were detected in the spectra of the other organisms. The direct evidence for nitrogen ligands is described below. The 1H ENDOR spectra of exponential D. radiodurans and E. coli were nearly identical. By contrast, the spectra of yeast and Arabidopsis seeds were distinct from the bacteria spectra and closely resembled each other and the spectrum of Mn:Pi. This reflected the strong influence of the phosphate ligands in these organisms.The characterization of nitrogen ligands
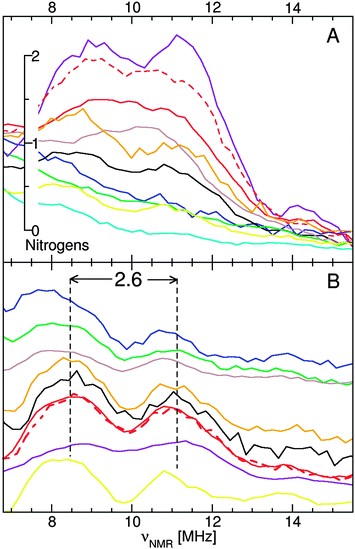
ELDOR-NMR was used to directly detect nitrogen ligands. The spectra of D. radiodurans and E. coli had a strong nitrogen resonance, centered at 10 MHz (Fig. 7). For the seeds and yeast, it was much less obvious. Their spectral intensity in the 10 MHz region was well above the background, but there were no discernable features. However, at 10-fold lower powers, resolved hyperfine resonances were observed confirming direct nitrogen ligation (Fig. 7B). All four exhibited a doublet with a splitting of 2.6 MHz, the same as concanavalin-A, [Mn(Imidazole)2(H2O)4]2+,18 [Mn(Glutamate)(H2O)4]2+ and Mn(II) bound to DNA (Mn:DNA).Although the scale showing the number of nitrogen ligands in Fig. 7 was derived from imidazole data,18 it was applicable to other nitrogen ligands. It correctly accounted for concanavalin-A (one histidine),29 [Mn(Glutamate)(H2O)4]2+ (one amino nitrogen)22 and the pH 8 OxdC center (three histidines).26 In exponential D. radiodurans cells, each Mn(II) had on average 1.5 nitrogen ligands, while for stationary cells they had 1.8 nitrogens, the estimated error was about ±0.5 nitrogens.18 This did not take into account the large amount of MnSOD in D. radiodurans stationary phase cells (Fig. 2). By comparison the average Mn(II) ion in E. coli had a single nitrogen ligand. Yeast and Arabidopsis seed centers had substantially less, about 0.5.
Discussion
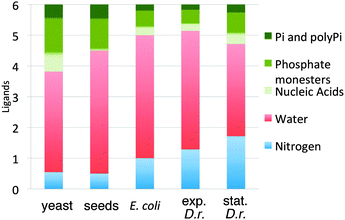
The ENDOR and ELDOR-NMR measurements were used to calculate the average stoichiometries of the Mn(II) ligand spheres for the four organisms: E. coli, (P)1(N)1(H2O)4; yeast, (P)2(N)0.5(H2O)3; Arabidopsis seeds, (P)1.5(N)0.5(H2O)4; exponential D. radiodurans, (P)1(N)1.5(H2O)4.5 and stationary D. radiodurans, (P)1.5(N)2(H2O)3.5, where P denotes all phosphates and N, all nitrogen ligands, rounded to the nearest half ligand reflecting the uncertainty in ligand counting. It is important to note that the number of the each ligand types was determined independently. The uncertainty in the total number of ligands was about one which meant that in all four organisms the average Mn(II) was six-coordinate, the expected result. Fig. 8 shows graphically the ligand distributions. For reasons discussed above, the stoichiometries found for the Arabidopsis seeds and stationary phase D. radiodurans did not reflect all of their Mn(II).In general, it was not possible to identify specific molecular species. The only exception were Mn:(N-His)2 and MnSOD from D. radiodurans since both had unique cw-HFEPR spectra. The measurements did show that certain species were unlikely to be present in significant quantities, in particular simple hydrated Mn(II), [Mn(H2O)6]2+. By contrast, it was not possible to assess the extent of carboxylate ligation since they are effectively invisible to the EPR techniques. This was of some concern since bacteria and yeast have high concentrations of free glutamate (100 mM). However, the complete coordination spheres of all four organisms strongly suggested that the participation of carboxylates was limited, certainly less than one per Mn(II) center. By comparison, previous estimates of the number of EPR-silent ligands were about 1 (15%) per Mn(II) center for D. radiodurans and 2 (33%) for E. coli.12 Since these numbers were based on a model that assumed ligation by only water, Pi, PPi and EPR-silent species, they were likely to be overestimated. Our results unambiguously showed that there were other ligands involved, in particular, significant number of those based on nitrogen.
With the exception of histidines, we could not identify any of the other nitrogen ligands. The 14N ELDOR-NMR spectra of the organisms and all of the model systems that we examined had no distinguishing features and were essentially identical. For yeast, E. coli and D. radiodurans, some of the nitrogen ligation must have been from nucleic acids. This was based on two observations: (1) isolated Mn:DNA had resonances in both the 14N ELDOR-NMR (Fig. 7) and 31P ENDOR spectra and (2) in all DNA and RNA crystal structures, where Mn(II) was present, the metal ions were bound to both nucleobase nitrogen and phosphate backbone sites, with the former being favored.30–32 So for nucleic acids, nitrogen-based and phosphate ligation to Mn(II) appeared to be correlated and, as a consequence, the 24% nucleic acid phosphate contribution to the 31P ENDOR spectra of these three organisms indicated nucleic acid nitrogen ligation. Some of the 14N ELDOR-NMR intensity could have also arisen from free glutamate, which binds Mn(II) using both its amino and carboxylate groups,22 but for reasons discussed above its contribution was likely to be small. Arabidopsis seeds have very low concentrations of free amino-acids (∼10 μM in total)33 and they also exhibited little or no 31P ENDOR intensity corresponding to nucleic acids. This suggested that their small 14N ELDOR-NMR resonance originated from Mn(II) bound to proteins or transporter molecules such as nicotianamine, the only other significant source of nitrogen ligands.34
The average of 1.5 nitrogen ligands in exponential D. radiodurans cells meant that in addition to centers with single nitrogens, such as those from nucleic acids, others containing 3 or more nitrogens were also likely to be present. The concentrations of none of these species were high enough so that they could be detected as resolved resonances in the cw-HFEPR spectra. For stationary phase D. radiodurans, the average of 2 nitrogen ligands only applied to 60% of the total Mn(II) since the other 40% that arose from MnSOD was not detectable by ELDOR-NMR. Of the detected centers, cw-HFEPR showed that half was Mn:(N-His)2. The increase of 0.5 nitrogens between the two growth phases of D. radiodurans coincided with the accumulation of Mn:(N-His)2 providing further support for our assignment of this species. There was evidence that this increase was, in part, at the cost of other species. The histidine contribution to the proton ENDOR appeared to be largely independent of the growth phase.11 More recent measurements that we have made show that the total pool of phosphate ligands dropped to about one phosphate during the stationary phase after reaching a high of 1.8 as reported earlier.11
The origins of the nitrogen ligands in E. coli and yeast were not clear. Not only did the ELDOR-NMR indicate their significant presence, but also their cw-HFEPR line-shapes (Fig. 1). In the case of E. coli, the Mn(II) resonances were broader than those of exponential D. radiodurans extending well into the region where Mn:(N-His)2 was detected. Although a previous study concluded that the majority of Mn(II) centers in E. coli were from enzyme-like environments12 (see below), examination of the protein concentrations from proteomic studies did not indicate what these enzymes might be.35 It is worth noting that nearly two-thirds of all manganese containing proteins in the PDB database bind the metal ion using at least one histidine. Of the abundant proteins in yeast, only pyruvate decarboxylase was a native manganese-containing enzyme.36 Its cellular concentration was measured to be about 10 μM, at this concentration it should have been detectable by HFEPR but not necessarily resolvable.
Sharma and coworkers concluded that the broadness of their E. coli 35 GHz EPR spectrum was characteristic of ions bound to low-symmetry enzyme sites like that of MnSOD.12 This attribution was based on a commonly held belief that Mn(II) bound to small complexes are likely to be in symmetric environments and have small zero-field interactions and therefore narrower EPR resonances while those bound to macromolecules, such as proteins, are in largely low-symmetry environments and have large zero-field interactions and broader resonances. Protein Mn(II) zero-field values range from 0.009 cm−1 for calprotectin37 to 0.03 cm−1 for the high pH six-coordinate site of OxdC. For special cases such as MnSODs and the five-coordinate center in OxdC,19,20,26 they can be as high as 0.3 cm−1. Since small complexes have about the same range, from 0.005 cm−1 for [Mn(Imidazole)4]2+![[thin space (1/6-em)]](https://www.rsc.org/images/entities/char_2009.gif) 18 to 0.093 cm−1 for [MnCl(H2O)5]+,38 the validity of any generalization relating the size of the Mn(II) complexes to their zero-field interactions is not evident. Fig. 2 unambiguously demonstrates that E. coli does not have a significant number (<10%) of Mn(II) ions with large zero-field interactions, regardless of their origin, small or macromolecular.
18 to 0.093 cm−1 for [MnCl(H2O)5]+,38 the validity of any generalization relating the size of the Mn(II) complexes to their zero-field interactions is not evident. Fig. 2 unambiguously demonstrates that E. coli does not have a significant number (<10%) of Mn(II) ions with large zero-field interactions, regardless of their origin, small or macromolecular.
The cellular concentration of MnSOD in E. coli is about 15 μM compared to 40 μM for FeSOD.35 At such a concentration, the very broad MnSOD signal would have been below the detection limit of our measurements. Both SOD levels are well below the concentration of the ubiquitously expressed heat shock protein DnaK (130 μM), one of the most abundant proteins in all cells. Although there is no information for D. radiodurans, in Deinococcus geothermalis, MnSOD was found to be the sixth most abundant enzyme during exponential growth and the third during stationary growth, its levels lying just below than exceeding those of DnaK during the change in growth phases.39 This suggested that the high levels of the MnSOD detected in D. radiodurans may not have been particularly unusual for this genus of highly resistant bacteria.
Although the absolute number of phosphate ligands were different, the relative distribution of the three pools of phosphate ligands, Pi/PPi, phosphate mono- and diesters, was the same for D. radiodurans, E. coli and yeast. In these three organisms, the phosphates are likely to act as a pool of binding sites in equilibrium with each other and their individual 31P ENDOR contributions reflected their concentrations and binding constants. The exceptional case was phytate which occurs in very high concentration in Arabidopsis seeds and has a Mn(II) binding constant that is several orders of magnitude higher than that of any other phosphate existing in plant cells.15,40 Seeds are dormant organisms displaying little metabolic activity. The unique presence of Mn:phytate in seeds likely corresponds to a function of nutrient storage, which is critical for sustaining the early stages of germination. Yet, the fact that Mn:phytate and Mn:PPi co-existed, but at different pH, strongly suggested different localization. Phytate in developing seeds accumulates in vacuoles and the endoplasmic reticulum, the latter having higher concentrations of manganese phytate.1 The ENDOR measurements indicated that, at least in dormant mature seeds, Mn:phytate resided in a relatively acidic environment like those found in vacuoles41 rather than the neutral pH of the endoplasmic reticulum.42
For all four organisms, Mn(II) phosphate monoesters were the dominant phosphate species, and not Pi/polyPi.10 The stability constants of phosphate monoesters at neutral pH are typically comparable to those of Pi and PPi and one to two orders of magnitude smaller than those of nucleotide di- and triphosphates.43 The large Pi/polyPi contribution to ENDOR spectra simply reflected the cellular high concentrations of these phosphates. Nonetheless, in all four organisms Pi and PPi were present in low quantities. During stationary growth, MnSOD and Mn:(N-His)2 constituted about 70% of the total Mn(II) in D. radiodurans leaving very little room for other species, including these two Mn(II) phosphates.
Mn:Pi has been shown to be capable of catalytically dismutating superoxide at cellular concentrations.2,3 However at such low concentrations, it would be inefficient compared to MnSOD.3 Therefore as we have previously stated,11 the presence of MnSOD in significant quantities means that it is likely to be the primary agent for controlling superoxide. This statement implies nothing about why D. radiodurans is so radio-resistant. There is no doubt that nonproteinaceous Mn(II) can play an important role in D. radiodurans and other organisms.5,6 Exogenously added Mn(II) complexes can rescue slow growing E. coli ΔsodA/ΔsodB double mutant lacking both Mn- and FeSODs.44 However, the very fact that this mutant as well as the mutant lacking MnSOD suffers even under optimal growth conditions45 shows that, even at quantities undetectable by EPR methods, MnSOD has a significant effect on the survivability of E. coli cells especially under oxidative stress conditions. So it is not unreasonable that active MnSOD in D. radiodurans, which is detected in much larger quantities during stationary growth, must have at least an equally effective protective role against superoxide.
What could Mn:(N-His)2 be? Recent gel-filtration experiments that are described in a parallel communication show that this species corresponds to a protein with a molecular size higher than 100 kDa. Slade and Radman46 in their review present a composite hypothetical Mn(II) complex derived from studies of Daly and coworkers5 that integrate all the components shown to have antioxidant properties. Ligands of this complex were a phosphate, a nucleoside and an amino acid contributing both a nitrogen and carboxylate ligands. Although not chemically realistic, the complex had nearly the same stoichiometry as the one we have measured for stationary phase D. radiodurans. A search of the PDB database for manganese proteins with similar stoichiometries suggested proteins associated with binding and processing DNA and metabolic proteins. This finding is intriguing and suggests possible roles for Mn:(N-His)2 other than the ones involving oxidative stress. Regardless of its function, it is the accumulation of this species along with high-levels of MnSOD that distinguishes D. radiodurans from the model organisms.
Acknowledgements
The S. cerevisiae strain BY4741 was a generous gift of M. Werner. We are grateful to V. Ching and F. Leach for useful comments and discussions. This work was supported by the ANR (contract no. 2011 BSV5-013-01 and 2011 BSV6-004-01), the French Infrastructure for Integrated Structural Biology (FRISBI) ANR-10-INSB-05-01, the CNRS “Interface PCB” program and the European Commission (Seventh Framework Programme, Theme KBBE2012.1.1-01, EcoSeed project). The 95 GHz EPR spectrometer was funded by the Région Ile-de-France “Sesame” program, the CEA and CNRS.Notes and references
- M. S. Otegui, R. Capp and L. A. Staehelin, Plant Cell, 2002, 14, 1311 CrossRef CAS.
- K. Barnese, E. B. Gralla, D. E. Cabelli and J. S. Valentine, J. Am. Chem. Soc., 2008, 130, 4604 CrossRef CAS PubMed.
- K. Barnese, E. B. Gralla, J. S. Valentine and D. E. Cabelli, Proc. Natl. Acad. Sci. U. S. A., 2012, 109, 6892 CrossRef CAS PubMed.
- E. R. Stadtman, B. S. Berlett and P. B. Chock, Proc. Natl. Acad. Sci. U. S. A., 1990, 87, 384 CrossRef CAS.
- H. J. Tseng, Y. Srikhanta, A. G. McEwan and M. P. Jennings, Mol. Microbiol., 2001, 40, 1175 CrossRef CAS PubMed.
- M. J. Daly, E. K. Gaidamakova, V. Y. Matrosova, J. G. Kiang, R. Fukumoto, D. Y. Lee, N. B. Wehr, G. A. Viteri, B. S. Berlett and R. L. Levine, PLoS One, 2010, 5, e12570 Search PubMed.
- M. J. Daly, E. K. Gaidamakova, V. Y. Matrosova, A. Vasilenko, M. Zhai, A. Venkateswaran, M. Hess, M. V. Omelchenko, H. M. Kostandarithes, K. S. Makarova, L. P. Wackett, J. K. Fredrickson and D. Ghosal, Science, 2004, 306, 1025 CrossRef CAS PubMed.
- M. J. Horsburgh, S. J. Wharton, M. Karavolos and S. J. Foster, Trends Microbiol., 2002, 10, 496 CrossRef CAS PubMed.
- F. S. Archibald and I. J. Fridovich, J. Bacteriol., 1981, 145, 442 CAS.
- R. L. McNaughton, A. R. Reddi, M. H. S. Clement, A. Sharma, K. Barnese, L. Rosenfeld, E. B. Gralla, J. S. Valentine, V. C. Culotta and B. M. Hoffman, Proc. Natl. Acad. Sci. U. S. A., 2010, 107, 15335 CrossRef CAS PubMed.
- L. C. Tabares and S. Un, J. Biol. Chem., 2013, 288, 5050 CrossRef CAS PubMed.
- A. Sharma, E. K. Gaidamakova, V. Y. Matrosova, B. Bennett, M. J. Daly and B. M. Hoffman, Proc. Natl. Acad. Sci. U. S. A., 2013, 110, 5945 CrossRef CAS PubMed.
- J. Stevenson-Paulik, R. J. Bastidas, S. T. Chiou, R. A. Frye and J. D. York, Proc. Natl. Acad. Sci. U. S. A., 2005, 102, 12612 CrossRef CAS PubMed.
- E. Vasca, S. Materazzi, T. Caruso, O. Milano, C. Fontanella and C. Manfredi, Anal. Bioanal. Chem., 2002, 374, 173 CrossRef CAS PubMed.
- L. D. Carli, E. Schnitzler, M. Ionashiro, B. Szpoganicz and N. D. Rosso, J. Braz. Chem. Soc., 2009, 20, 1515 CrossRef.
- P. Schosseler, T. Wacker and A. Schweiger, Chem. Phys. Lett., 1994, 224, 319–324 CrossRef CAS.
- O. Matumura, J. Phys. Soc. Jpn., 1959, 14, 108 CrossRef.
- S. Un, Inorg. Chem., 2013, 52, 3803 CrossRef CAS PubMed.
- L. C. Tabares, J. Gätjens and S. Un, Biochim. Biophys. Acta, 2010, 1804, 308 CrossRef CAS PubMed.
- L. C. Tabares, J. Gätjens, C. Hureau, M. R. Burrell, L. Bowater, V. L. Pecoraro, S. Bornemann and S. Un, J. Phys. Chem. B, 2009, 113, 9016 CrossRef CAS PubMed.
- F. Dumont, P. A. Marechal and P. Gervais, Appl. Environ. Microbiol., 2004, 70, 268 CrossRef CAS PubMed.
- L. Chung, K. S. Rajan, E. Merdinger and N. Grecz, Biophys. J., 1971, 11, 469 CrossRef CAS PubMed.
- S. Un, P. Dorlet and A. W. Rutherford, Appl. Magn. Reson., 2001, 21, 341 CrossRef CAS.
- E. R. Davies, Phys. Lett. A, 1974, 47, 1–2 CrossRef CAS.
- A. Potapov and D. Goldfarb, Appl. Magn. Reson., 2006, 30, 461 CrossRef CAS.
- V. J. Just, C. E. M. Stevenson, L. Bowater, A. Tanner, D. M. Lawson and S. J. Bornemann, J. Biol. Chem., 2004, 279, 19867 CrossRef CAS PubMed.
- L. C. Tabares, N. Cortez, I. Agalidis and S. Un, J. Am. Chem. Soc., 2005, 127, 6039 CrossRef CAS PubMed.
- K. Van Eunen, J. Bouwman, P. Daran-Lapujade, J. Postmus, A. B. Canelas, F. I. C. Mensonides, R. Orij, I. Tuzun, J. van den Brink, G. J. Smits, W. M. van Gulik, S. Brul, J. J. Heijnen, J. H. de Winde, M. J. T. de Mattos, C. Kettner, J. Nielsen, H. V. Westerhoff and B. M. Bakker, FEBS J., 2010, 277, 749 CrossRef CAS PubMed.
- A. Deacon, T. Gleichmann, A. J. Kalb(Gilboa), H. Price, J. Raftery, G. Bradbrook, J. Yariv and J. R. Helliwell, J. Chem. Soc., Faraday Trans., 1997, 93, 4305 RSC.
- H. Millonig, J. Pous, C. Gouyette, J. A. Subirana and J. L. Campos, J. Inorg. Biochem., 2009, 103, 876 CrossRef CAS PubMed.
- C. A. Davey and T. J. Richmond, Proc. Natl. Acad. Sci. U. S. A., 2002, 99, 11169 CrossRef CAS PubMed.
- P. De Meester, D. M. Goodgame, T. J. Jones and A. C. Skapski, Biochem. J., 1974, 139, 791 CrossRef CAS PubMed.
- Y. Murooka, Y. Mori and M. J. Hayashi, J. Biosci. Bioeng., 2002, 94, 225 CrossRef CAS PubMed.
- G. Cassin, S. Mari, C. Curie, J. F. Briat and P. Czernic, J. Exp. Bot., 2009, 60, 1249 CrossRef CAS PubMed.
- P. Lu, C. Vogel, R. Wang, X. Yao and E. M. Marcotte, Nat. Biotechnol., 2007, 25, 117 CrossRef CAS PubMed.
- B. Futcher, G. I. Latter, P. Monardo, C. S. McLaughlin and J. I. Garrels, Mol. Cell. Biol., 1999, 19, 7357 CrossRef CAS PubMed.
- J. A. Hayden, M. B. Brophy, L. S. Cunden and E. M. Nolan, J. Am. Chem. Soc., 2013, 135, 775 CrossRef CAS PubMed.
- S. Un and A. Sedoud, Appl. Magn. Reson., 2009, 37, 247 CrossRef CAS.
- C. Liedert, M. Peltola, J. Bernhardt, P. Neubauer and M. Salkinoja-Salonen, J. Bacteriol., 2012, 194, 1552 CrossRef CAS PubMed.
- R. M. Smith and R. A. Alberty, J. Am. Chem. Soc., 1956, 78, 2376 CrossRef CAS.
- L. Taiz, J. Exp. Biol., 1992, 172, 113 CAS.
- J. Shen, Y. Zeng, X. Zhuang, L. Sun, X. Yao, P. Pimpl and L. Jiang, Mol. Plant, 2013, 6, 1419 CrossRef CAS PubMed.
- A. E. Martell and R. M. Smith, Critical Stability Constants, Springer US, Boston, MA, 1982 Search PubMed.
- W. Munroe, C. Kingsley, A. Durazo, E. Butler Gralla, J. A. Imlay, C. Srinivasan and J. Selverstone Valentine, J. Inorg. Biochem., 2007, 101, 1875 CrossRef CAS PubMed.
- A. Carlioz and D. Touati, EMBO J., 1986, 5, 623 CAS.
- D. Slade and M. Radman, Microbiol. Mol. Biol. Rev., 2011, 75, 133 CrossRef CAS PubMed.
| This journal is © The Royal Society of Chemistry 2015 |

