Cerium-based porous coordination polymers with hierarchical superstructures: fabrication, formation mechanism and their thermal conversion to hierarchical CeO2†
Yong-Xia
Zhao
,
Zhi-Wen
Nie
,
Meng-Meng
Shi
,
Cheng-Hui
Zeng
,
Yuan
Li
,
Lei
Wang
* and
Sheng-Liang
Zhong
*
College of Chemistry and Chemical Engineering, Jiangxi Normal University, Nanchang 330022, P. R. China. E-mail: slzhong@jxnu.edu.cn; Fax: +86-0791-88120386; Tel: +86-0791-88120386
First published on 11th May 2015
Abstract
In this work, cerium-based porous coordination polymers (Ce-CPs) with hierarchical superstructures have been successfully synthesized on a large scale employing cerium nitrate as the metal salt and 2,5-pyridinedicarboxylic acid (2,5-H2pdc) as the ligand by a mixed-solvothermal route. The as-obtained products were characterized by scanning electron microscopy (SEM), Fourier transform infrared spectroscopy (FTIR), X-ray powder diffraction (XRD), X-ray photoelectron spectroscopy (XPS), thermogravimetry and differential thermal analysis (TG-DTA). It was found that the hierarchical superstructures are composed of asymmetric branches with lengths ranging from 10 to 50 μm. The reaction parameters such as reaction temperature, total concentrations of the reactants, solvent composition, and the reaction time were investigated systematically. A possible formation mechanism for the hierarchical superstructures has been proposed to interpret the growth process. CeO2 with similar hierarchical structures could be obtained after thermolysis of the Ce-CP precursors at 450 °C for 4 h. The UV-vis adsorption spectrum of the obtained CeO2 shows that the band gap energy (Eg) is 2.64 eV, which is lower than that of bulk ceria. Moreover, the as-obtained CeO2 also exhibited remarkable ability to remove rhodamine B (RhB).
Introduction
Coordination polymers (CPs) as a class of captivating inorganic–organic hybrid materials have received a great deal of attention because of their unique and high degree of tailorability, which have great potential technological applications in heterogeneous catalysis,1 gas storage,2 medical imaging,3 biosensing and drug delivery.4 Up to now, with the on-going development of modern nanoscience and nanotechnology, a large number of CPs with a wide variety of morphologies and structures have been synthesized successfully. For example, Wang et al. prepared hollow iron-based ferrocenyl CP microspheres with microporous shells via a one-pot solvothermal method without any additional template and discussed the Ostwald ripening mechanism of the microspheres.5 Oh et al. also described a simple solvothermal approach for the synthesis of hexagonal-tube CPs.6 We have been engaged in the synthesis of CP micro/nanostructured materials during the past few years.7 All the previous studies suggested that suitable selection of the metal ions, building organic ligands and design of reaction routes would not only enrich their family but also bring us some unexpected results on morphology control or fascinating properties.8The hierarchical self-assembly micro/nanostructured materials built from functional low dimensional nanostructures have attracted extensive research interest owing to their enhanced properties and potential applications over the past few decades.9 The chemical and physical properties of solid-state materials depend not only on their size, shape, and chemical composition, but their assemblies as well.10 Thus, control over size and shape of hierarchical micro/nanostructures is an important theme for understanding and exploiting their unique properties.9c On the nanoscale, dendritic hyperbranched structures are formed by hierarchical self-assembly under non-equilibrium conditions.11 Inspired by these results, many types of three dimensional (3D) micro/nanostructures with high complexity have been fabricated successfully, such as snowflakes,12 nanocages,13 hyperbranches,14 multipods,15 dendrites,16 saws,17 flower-like microspheres,18 hollow nanospheres,19 airplane-like nanostructures,20 and so on. However, these structures mainly focus on metal, metal oxides, and other semiconductors. Until now, there are only sporadic successful examples of the synthesis of uniform hierarchical CPs with rich morphologies.21 Therefore, it still remains a significant challenge to design and develop an effective and reliable route for the synthesis of CP hierarchical superstructures, regarding control over the complex structures.
Ceria is one of the most attractive rare-earth oxides, which has attracted extensive attention because of its candidate applications ranging from catalysis,22 fuel cells,23 sensors,24 to UV blocking,25 and so forth. The morphologies and structures of CeO2 have an important influence on its properties, the main emphasis on the CeO2 has focused on the fabrication of various morphologies and structures.26 So far, CeO2 with various basic nanoscale morphologies and structures has been synthesized successfully through various methods, such as nanoparticles,27 nanowires,28 nanotubes,29 nanorods,30 and so on. Furthermore, it has been demonstrated that 3D CeO2 hierarchical structures display enhanced activity towards the removal of As(V) and Cr(VI) in wastewater.31 In this respect, it is crucialto fabricate 3D hierarchical micro/nanostructured CeO2 with various composites and morphologies based on different driving mechanisms, which endow them with some unique properties and novel functionalities. Yang's group fabricated 3D CeO2 microflower structures via the calcination of a cerium oxalate precursor, and the as-prepared flowerlike CeO2 displayed a high surface area (147.6 m2 g−1), which shows a higher catalytic activity for CO oxidation.32 However, to the best of our knowledge, there have been very few reports focusing on 3D CeO2 hierarchical superstructures via the thermal treatment of the corresponding CP precursors.
In this work, the 2,5-H2pdc building block is chosen as a multidentate ligand to generate organic–inorganic hybrid materials, which is based on the following reasons: (i) 2,5-H2pdc as an N-heterocyclic analog of 1,4-benzenedicarboxylic (terephthalic) acid that combines the advantages of both organic multi-carboxylic acid and aromatic compounds.33 (ii) The carboxylate groups of 2,5-H2pdc can be completely or partially deprotonated to generate pdc2− and Hpdc−, allowing various acidity-dependent coordination modes. (iii) The 2,5-H2pdc ligand possesses rich coordination modes due to different –O and –N donors (carboxylate oxygen atoms and pyridine nitrogen) that may be suitable for connecting metal centers to generate metal–organic framework (MOF) structures. In addition, our previous studies have proven that the 2,5-H2pdc is an excellent building block for the construction of lanthanide coordination polymers.7c,f Herein, we present a mixed-solvothermal route to fabricate Ce-CP hierarchical superstructures from cerium(III) and a well-known 2,5-H2pdc building block. Influential factors including reaction time, temperature, total concentrations, and solvent composition of the reactants for the formation of the Ce-CP superstructures have been studied systematically. A possible formation mechanism of the Ce-CP hierarchical superstructures was suggested based on the detailed experiments. After thermal decomposition of the Ce-CP, CeO2 with similar hierarchical structures was successfully fabricated.
Experimental section
Materials and synthesis
All the reagents used in our experiment were of analytical grade and used without further purification. In a typical synthesis procedure of the hierarchical superstructures (sample 1), 0.2 mmol of Ce(NO3)3·6H2O was dissolved in 10 mL of absolute ethanol, followed by the addition of 22 mL of dmf (N,N-dimethylformamide) containing 0.8 mmol of 2,5-pyridinedicarboxylic acid (2,5-H2pdc). After vigorous stirring for 20 min under magnetic stirring, the resulting solution was transferred into a 40 mL Teflon-lined autoclave and heated at 160 °C for 12 h. After the autoclave was cooled to room temperature naturally, the fresh precipitates were collected by centrifugation, washed three times with absolute ethanol, and dried at 60 °C in a vacuum. The detailed experimental conditions for the as-synthesized products are listed in Table S1 (ESI†). Finally, mesoporous CeO2 was obtained by calcination of the Ce-CP precursor under air at 450 °C for 4 h with a heating rate of 0.5 °C min−1.Characterization
The phase and composition of the resulting products were analyzed by XRD, in a two theta range from 5° to 90°, using a Rigaku/Max-3A diffractometer. The morphologies and superstructures of the as-prepared products were examined by using SEM (Hitachi, S-3400N). Transmission electron microscopy (TEM), high-resolution TEM (HRTEM), and selected area electron diffraction (SAED) images were obtained by using a JEM 2100 transmission electron microscope operated at an accelerating voltage of 200 kV. Elemental analysis (EA) data were obtained using an EA 300 instrument. FTIR spectra were recorded on a Nicolet 6700 spectrometer in the wavenumbers ranging from 4000 cm−1 to 400 cm−1. TG-DTA analysis was conducted with a TA-50 thermal analyzer instrument at a heating rate of 10 °C min−1 from room temperature to 1000 °C under an air atmosphere. Nitrogen adsorption–desorption isotherms were collected at a liquid nitrogen temperature (77 K) using a BELSORP-mini II apparatus. The specific surface areas were calculated by the (Brunauer–Emmett–Teller) BET method, and the mesopore size distribution was calculated from the adsorption branch using the Barrett–Joyner–Halenda (BJH) theory. The Raman spectra were recorded using a LabRAM HR laser Raman spectrometer with a 633 nm excitation. XPS were measured using an EscaLab 250 X-ray photoelectron spectrometer with Al Kα radiation. An ultraviolet-visible (UV-vis) adsorption spectrum was recorded on a SOLID 3700 UV/VIS/NIR spectrophotometer. All the measurements were performed at room temperature.Photocatalytic degradation experiments
Typical degradation experiments under a high-pressure mercury lamp (500 W) were performed at room temperature. Prior to irradiation, 20 mL of RhB aqueous solution (5 × 10⁻⁶ M) containing 0.05 g CeO2 was magnetically stirred for 30 min in the dark continuously in order to achieve an adsorption/desorption equilibrium between the as-obtained CeO2 and the RhB dye. Then the suspension was magnetically stirred under UV light irradiation. At regular intervals, aliquots of solution were withdrawn and centrifuged to separate solid particles for analysis of concentration. The characteristic absorbance of RhB at 554 nm was used to characterize the concentration of RhB. The photocatalytic reaction progress was monitored using a Lambda 35 UV-vis spectrometer.Results and discussion
Characterization of the Ce-CP hierarchical superstructures
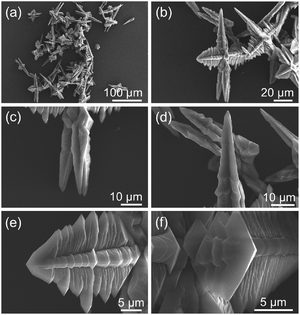
The morphology, structures and sizes of the as-synthesized Ce-CP hierarchical superstructures were examined using SEM, as shown in Fig. 1. Fig. 1(a) is the low magnification SEM image, revealing that the Ce-CP hierarchical superstructures were synthesized on a large scale and in high purity after a mixed-solvothermal reaction. The magnified image of Fig. 1(b) indicates that the Ce-CP superstructures exhibit a hierarchical structure. Each superstructure practically consisted of many branches attached to a mutual core. The length of the branches is in the range of 10–50 μm. By a close observation on the vertical direction of a single superstructure, two or more taper-shape-like rods with lengths of about 30 μm could be observed in Fig. 1(c) and (d). Perpendicular to the taper-shape-like rod direction, it can be clearly seen that four homogeneous dendritic structures with the lengths range from 10 to 25 μm were also observed, and a lot of sub-branches vertically distributed on the sides of the dendritic trunk (Fig. 1(e) and (f)). This asymmetric superstructure is not in the same plane but has a 3D superstructure, which is clearly different from the reported semiconductor superstructures.34 Fig. S1(a)† shows the XRD pattern of Ce-CP hierarchical superstructures. It clearly displays that the peaks are strong and narrow, indicating the good crystallinity of the as-prepared products. However, it could not be finely indexed to a known phase compared with other references and all the standard XRD patterns in JCPDS cards. There are inherent difficulties in determining the exact crystalline information on Ce-CPs through HRTEM, but it is reasonable to believe that such Ce-CPs have been successfully prepared based on the above results.35 Since CP micro/nanoparticles displayed unexplored crystalline structures, and the corresponding single crystals with a suitable size could hardly be obtained, researchers have usually devoted to apply multi-analysis methods to study the compositions and structures of the CP micro/nanoparticles.36Therefore, Ce-CP hierarchical superstructures were carefully characterized by XPS, FTIR, EA, and TG-DTA analysis to investigate their chemical structures and compositions. The XPS spectrum of the as-synthesized Ce-CP powder clearly detects the obvious peaks of cerium, carbon, nitrogen and oxygen in the survey spectrum (Fig. S1(b)†). From Fig. S1(c),† four binding energy peaks in the 3d region at 881.18 eV, 884.38 eV, 900.18 eV, and 903.18 eV, in addition to the 4d region at 110.08 eV, indicate that the oxidation state of cerium in these samples is from Ce(III). The FTIR spectrum of the CP superstructure (Fig. S1(d)†) displays different characteristics compared with pure 2,5-H2pdc, which further confirms the formation of Ce-CP hierarchical superstructures from the cerium ions and 2,5-H2pdc. Firstly, the characteristic peaks at 1479 and 1417 cm−1 are attributed to the stretching vibrations of the backbone of the benzene ring.37 Secondly, comparing with the absorption band at 1731 and 1385 cm−1 for the –COOH of the free 2,5-H2pdc ligand, the bands around 1607 and 1353 cm−1 could be assigned to the asymmetric νas(–COO−) and symmetric νs(–COO−) stretching vibrations of the ionized carboxylate groups, respectively.38 Thirdly, the sharp band appearing at 506 cm−1 is attributed to the Ce–O stretching vibration, which confirms that the Ce3+ ions are coordinated with the 2,5-H2pdc to form a complex.39 Elemental analysis (EA) was performed to study the chemical compositions of the Ce-CP, providing the elemental quantities as follows: C: 36.18, N: 8.31, H: 3.23. Combining the EA results and the building components determined by FTIR, the empirical formula of the Ce-CP could be proposed as Ce(pdc)(Hpdc)·2(dmf)·2(H2O) (calcd C: 36.76, calcd N: 8.57, calcd H: 3.86%).40 TG-DTA curves of Ce-CP taken under air (Fig. S1(e)†) were further conducted to support our conjecture. There are three weight loss steps in the thermal decomposition of this compound. The first stage occurs before 184 °C, and the weight loss is approximately 6.15%, corresponding to the weight of the physically absorbed and structured water molecules. The second weight loss in the range of 184–380 °C is 21.82%, which is related to the loss of dmf molecules.41 The last weight loss from 380 to 445 °C is ascribed to the decomposition of the organic ligand. N2 adsorption–desorption isotherms were recorded after pretreatment at 150 °C for 4 h under dynamic vacuum. As shown in Fig. S1(f),† N2 adsorption isotherm of Ce-CP hierarchical superstructures exhibits the behaviour for multilayer adsorption. The BET surface areas of Ce-CP obtained from the adsorption branch of the isotherm gave a relatively low BET surface area of 2.2 m2 g−1. The low N2 adsorption is more likely attributed to the strong quadrupole interactions between N2 molecules and the electrostatic field gradients near the surface of Ce-CP hierarchical superstructures. These considerable quadrupole interactions could block N2 molecules from passing into the pore channels.42
It is well known that the lanthanide elements are a group of 14 elements (except for Pm, which is a radioactive element), which can be divided into light (La → Eu) and heavy (Gd → Lu) rare earth groups. Under identical synthetic conditions, other lanthanide-based CPs were also prepared, just by replacing Ce3+ with other rare earth element ions.7b It is clearly observed from SEM images that the morphologies of the as-synthesized products are different to some extent (Fig. S2 and S3†). From La to Gd, similar CP hierarchical superstructures with the length of branches in range of 30–120 μm were prepared, while other lanthanide-based CPs were close to a spherical shape with diameters of 5–20 μm and irregularly shaped microstructures with a random size distribution. Although the exact reason is not clear at present, it is reasonably believed that this difference seems to be closely related to the change in lanthanide ion radius.43
Influences of different reaction parameters on the morphologies of Ce-CP hierarchical superstructures
In order to better understand the formation mechanism of the Ce-CP hierarchical superstructures, a series of controlled experiments (Table S1, ESI†) were conducted to systematically study the morphological evolution.By fixing other reaction conditions, the effect of the reaction temperature on the morphology of the as-prepared products was investigated. At the reaction temperature of 80 °C (sample 2), the products were composed of uniform nanospheres with a size of about 500 nm in diameter (Fig. S4(a)†). Interestingly, with the increase in reaction temperature, the hierarchical structures began to form. At 100 °C (sample 3), a large amount of approximate hierarchical cubes with edge lengths of about 30 μm were obtained (Fig. S4(b)†). Furthermore, hierarchical superstructures were also prepared in high yield at 140 °C (sample 4). Compared with the typical hierarchical superstructures mentioned above (sample 1), these hierarchical superstructures possess a narrow size distribution (Fig. S4(c)†). However, when the reaction was carried out at 180 °C (sample 5), hierarchical superstructures had been destroyed (Fig. S4(d)†). From these results, we can conclude that the Ce-CP hierarchical superstructures can be selectively synthesized by controlling the reaction temperature rationally. The high temperature is helpful for the formation of hierarchical superstructures, and the typical Ce-CP hierarchical superstructures can be achieved at 160 °C.
To determine the effect of total concentrations of the reactants on the formation of the products while retaining other reaction conditions, the images of the products obtained from the solutions with a mixed-solvothermal treatment at 160 °C for 12 h are shown in Fig. S5(a–c).† It is obvious that the morphology changed greatly with increasing amounts of reactants. When the Ce3+ was 0.05 mmol (sample 6) and the molar ratio of Ce3+ to 2,5-H2pdc was 1![[thin space (1/6-em)]](https://www.rsc.org/images/entities/char_2009.gif) :
:![[thin space (1/6-em)]](https://www.rsc.org/images/entities/char_2009.gif) 4 with other reaction conditions unchanged, uniform spheres with diameters of about 500 nm were obtained (Fig. S5(a)†) on a large scale, which was much different from the typical sample. To investigate whether hierarchical superstructures can be obtained by increasing the reaction time, an experiment was carried out for 96 h (sample 7). However, no hierarchical superstructures were obtained. Instead, a large amount of octahedra with a size distribution of about 27 μm in diameter were observed and a small amount of nanoparticles with diameters of ca. 100–350 nm were also detected (inset in Fig. S5(a)†). While increasing the amount of Ce3+ to 0.1 mmol (sample 8), the as-synthesized product mainly takes on mixed morphologies of nanoparticles and complicated hierarchical superstructures (Fig. S5(b)†). Further increasing the amount of Ce3+ to 0.15 mmol (sample 9) resulted in the disappearance of the nanoparticles and the obtained hierarchical superstructures possess more complex structures (Fig. S5(c)†). Well-defined Ce-CP hierarchical superstructures were obtained at 0.2 mmol Ce3+ (sample 1). On the basis of the above results, we would like to point out that the concentration of reactants also plays a crucial role in determining the morphology of the products, and a high concentration of reactants favors the formation of pure and high yield Ce-CP hierarchical superstructures in a definite reaction time, and the typical Ce-CP hierarchical superstructures could be selectively obtained at a high concentration of reactants (sample 1).
4 with other reaction conditions unchanged, uniform spheres with diameters of about 500 nm were obtained (Fig. S5(a)†) on a large scale, which was much different from the typical sample. To investigate whether hierarchical superstructures can be obtained by increasing the reaction time, an experiment was carried out for 96 h (sample 7). However, no hierarchical superstructures were obtained. Instead, a large amount of octahedra with a size distribution of about 27 μm in diameter were observed and a small amount of nanoparticles with diameters of ca. 100–350 nm were also detected (inset in Fig. S5(a)†). While increasing the amount of Ce3+ to 0.1 mmol (sample 8), the as-synthesized product mainly takes on mixed morphologies of nanoparticles and complicated hierarchical superstructures (Fig. S5(b)†). Further increasing the amount of Ce3+ to 0.15 mmol (sample 9) resulted in the disappearance of the nanoparticles and the obtained hierarchical superstructures possess more complex structures (Fig. S5(c)†). Well-defined Ce-CP hierarchical superstructures were obtained at 0.2 mmol Ce3+ (sample 1). On the basis of the above results, we would like to point out that the concentration of reactants also plays a crucial role in determining the morphology of the products, and a high concentration of reactants favors the formation of pure and high yield Ce-CP hierarchical superstructures in a definite reaction time, and the typical Ce-CP hierarchical superstructures could be selectively obtained at a high concentration of reactants (sample 1).
It was found that the solvent composition also had a great effect on the morphology of the final product. Considering the poor solubility of 2,5-H2pdc in ethanol, pure ethanol as the solvent could not be used in this experiment. When 12 mL of dmf and 20 mL of ethanol were used as the solvent media (sample 10), the product was mainly composed of typical hierarchical superstructures and some detached branches were also found in the product (Fig. S6(a)†). When the solvent was composed of 22 mL of dmf and 10 mL of ethanol (sample 1), well-defined Ce-CP hierarchical superstructures were obtained on a large scale (Fig. 1). No hierarchical superstructures were observable and only uniform spheres with diameters of about 1 μm were obtained (Fig. S6(b)†) when pure dmf was used as the solvent (sample 11). The results further confirm that the composition of the solvent is also an important factor to control morphological evolution of the as-prepared products.
In addition, time-dependent experiments were also conducted in this work. When the reaction time was 1 h (sample 12), a large quantity of uniform nanospheres with the diameters of about 500 nm were obtained (Fig. 2(a)). After 80 min (sample 13) of reaction, the nanospheres began to agglomerate and produced microstructured spheroids of about 20 μm in diameter (Fig. 2(b)). At the same time, some nanospheres adhering to the surface of spheroids could be found, which proved that these spheroid particles were composed of nanospheres. When the reaction time was prolonged to 1.5 h (sample 14), the product was mainly composed of poorly-formed hierarchical superstructures, representing the gradually extended 3D hierarchical superstructures (Fig. 2(c)). By extending the reaction time to 12 h (sample 1), hierarchical superstructures with the length of dendritic structures of 10–50 μm self-assembled by nanoparticles were obtained (Fig. 1). After further prolonging the reaction time to 24 h (sample 15), the obtained hierarchical superstructures became more complex and possessed a broad size distribution (Fig. 2(d)). These images clearly reveal that the Ce-CP hierarchical superstructures are composed of nanospheres and the size of the Ce-CP hierarchical superstructures increases by extending the reaction time.
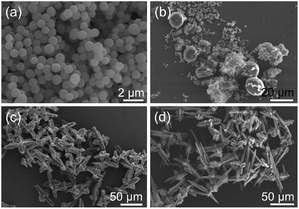 | ||
| Fig. 2 SEM images of the products obtained at 160 °C with different times (a) 1 h (sample 12), (b) 80 min (sample 13), (c) 1.5 h (sample 14), and (d) 24 h (sample 15), respectively. | ||
Possible formation mechanism of the Ce-CP hierarchical superstructures
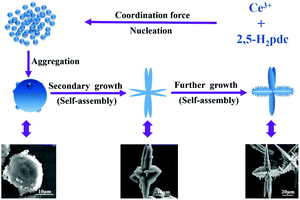
In order to explore the formation mechanism, we examined thoroughly the as-prepared products prepared at different reaction times ranging from 60 min to 12 h while maintaining other reaction conditions the same by XRD (Fig. S7†). It can be clearly seen that the peak intensity increases with increasing reaction time. After reaction for 80 min, the XRD patterns become much stronger and narrower, indicating that the amorphous aggregates have been transformed into crystalline solids, which are basically in agreement with the observation of SEM images.The generation of branched or dendritic structures is always the result of kinetically and/or thermodynamically controlling the original nucleating stage and succeeding the crystal growth stage through changing the reaction parameters.44 Although the exact mechanism of the assembled hierarchical structure is unclear, on the basis of the SEM observation, we consider that the formation of the porous Ce-CP hierarchical superstructures can be simply described as a self-assembly growth mechanism.7b,18 A possible formation mechanism is illustrated in Scheme 1. At first, the Ce3+ reacts with 2,5-H2pdc to produce primary nanospheres driven by the coordination force. Subsequently, the newly formed nanospheres grow and aggregate into microstructured spheroids driven by the minimization of interfacial energy. Furthermore, with continuous growth, the freshly formed spheroids are not stable, and they transform into multiple dendritic structures through a self-assembly process. Finally, the hierarchical superstructures were obtained via the further self-assembly process under mixed-solvothermal treatment.
Crystal phase, morphology and properties of the as-obtained CeO2
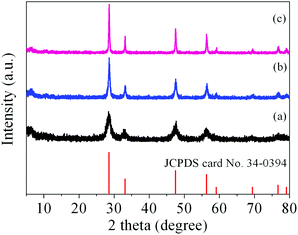
It has been demonstrated that micro/nanostructured CP could be used as the precursor for the preparation of the corresponding metal oxides since their organic components of the coordination polymers have been readily removed by thermal decomposition.39,45Fig. 3 shows the XRD patterns of the Ce-CP hierarchical superstructures heat-treated at the temperature of 450–600 °C. The diffraction patterns exhibit the samples crystallized in the face-centered cubic pure phase (space group: Fm3m(225)) of CeO2 (JCPDS card No. 34-0394). No signals of impurities are detected, implying that the Ce-CP has been decomposed into CeO2 completely. In addition, it can be seen that the intensity of the diffraction peak increases and the half width of the diffraction peak decreases with the heat-treatment temperature, which indicates that the crystallite size of CeO2 grain increases with the heat-treatment temperature. Furthermore, the broadening of the peaks indicates that the as-obtained CeO2 hierarchical structures are composed of primary small crystal particles.32The morphology and architectures of the as-obtained CeO2 were investigated by SEM and HTEM. As shown in Fig. 4(a), the SEM image reveals that most of the products inherit the morphology of their precursor. In comparison with the precursor, the shrinkage length and rough surface of CeO2 (Fig. 4(b)) may be caused by the escape of H2O and gas molecules from the surface during the thermal decomposition–oxidation to the CeO2 process. The HRTEM images (Fig. 5a–c) clearly show that the CeO2 consists of quantities of ceria nanocrystals which pack together in different directions to form the mesopores (Fig. 5a), and this is confirmed by N2 adsorption–desorption isotherms (discussed later). The lattice fringes are clearly visible with a spacing of 0.31 nm and 0.27 nm, corresponding to the spacing of the (111) and (200) planes of cubic ceria. The SAED ring pattern (Fig. 5d) further indicates that the structure of the obtained product is a face-centered cubic CeO2. The N2 adsorption–desorption isotherms (Fig. 6) were used to characterize the porosity of the as-obtained CeO2 after pretreatment at 150 °C for 4 h under vacuum conditions. It is found that the CeO2 exhibits typical IV characteristics with an obvious hysteresis loop, suggesting that there are mesopores in CeO2.46 The specific surface area of the as-obtained CeO2 calculated by the Brunauer–Emmett–Teller (BET) method is 35.9 m2 g−1, which is higher than that of commercial CeO2 powder (a surface area of ca. 10.2 m2 g−1). The pore size distribution was calculated from the adsorption branch through the Barett–Joyner–Halenda (BJH) method and is shown in the inset of Fig. 6, which indicates that the pore distribution is in a wide range and the average pore diameter of the CeO2 is about 4.89 nm.45a Furthermore, no diffraction peaks could be observed in the small-angle XRD pattern of the as-prepared CeO2 (Fig. S8†), suggesting that the mesopores are not periodically organized, which is in good accordance with the aforementioned HRTEM images. The Raman spectra of the as-obtained CeO2 under ambient conditions are shown in Fig. S9.† The 464 cm−1 band is attributed to the Raman-active symmetry vibrational mode (F2g) of the CeO2 fluorite-type structure, a weak band between 540 cm−1 and 600 cm−1 could prove the existence of oxygen vacancies.47
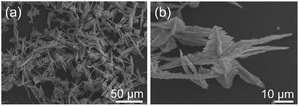 | ||
| Fig. 4 SEM images of the as-obtained CeO2 after thermal decomposition of the Ce-CP hierarchical superstructures in air at 450 °C for 4 h. | ||
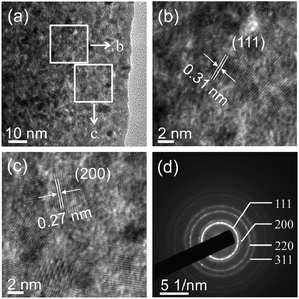 | ||
| Fig. 5 (a–c) HRTEM images and (d) selected-area electron diffraction (SAED) patterns of the as-obtained CeO2. | ||
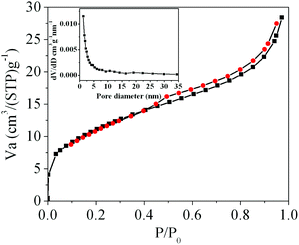 | ||
| Fig. 6 N2 adsorption–desorption isotherms of the as-obtained CeO2; the inset is the corresponding BJH pore size distribution curve. | ||
To further characterize the product, XPS was conducted to further investigate the surface composition and chemical state of the as-obtained CeO2. The wide-survey XPS spectrum of the as-obtained CeO2 (Fig. 7(a)) reveals the predominant presence of Ce, O signals on the surface of the sample, which indicates the high purity of the as-obtained CeO2 sample. The minor amount of the carbon element with a binding energy at 285.98 eV arises from the adventitious carbon. Fig. 7(b) displays the Ce 3d core level XPS spectrum of the as-obtained CeO2, which consists of two series of V and U peaks corresponding to 3d5/2 and 3d3/2 states, respectively, consistent with the previous report of Ce4+ states. For 3d5/2 of Ce(IV), the peaks of V and V′ can be attributed to a mixing of the 3d94f2(O 2p4) and 3d94f1(O 2p5)Ce4+ states, and V′′ to the 3d94f0(O 2p6)Ce4+ state. The origin of the U structures, due to the Ce 3d3/2 level, can be carried out in the same way.48 It is clear that the valley between V and V′ is assigned to the 3d94f1(O 2p6)Ce3+ final state, which indicates that a small quantity of Ce3+ is also present in the sample.28 One can determine the relative amount of Ce3+ from the ratio of relative peak areas of Ce3+/total area.49 However, it is difficult to obtain a definite value due to the complex backgrounds. Fig. 7(c) shows the O 1s core level XPS spectrum of the as-obtained CeO2, which can be deconvolved into two peaks. The peak at 530.78 eV could be assigned to the absorbed oxygen, and another peak located at a lower BE (529.18 eV) originated from the lattice oxygen.50
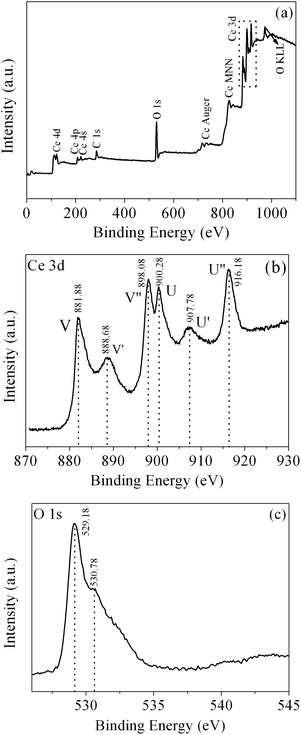 | ||
| Fig. 7 (a) XPS wide-survey spectrum, (b) Ce 3d core level XPS spectrum and (c) O 1s core level XPS spectrum of the as-obtained CeO2. | ||
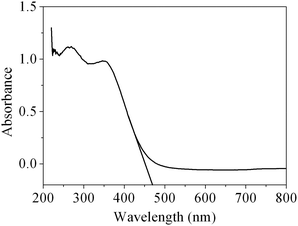
As is well known, CeO2 can be used as a suitable ultraviolet-blocking material arising from the charge transfer transitions from O2− in O 2p to Ce4+ in the Ce 4f state. The UV-vis absorption spectrum of the obtained CeO2 sample is shown in Fig. 8. As we can see from the spectrum, the CeO2 sample has a strong absorption in the UV region. The optical band gap Eg can be calculated based on the following equation: Eg = 1240/λAE, where λAE represents the edge wavelength of absorbance. The one set of absorption for our prepared CeO2 is at 469 nm, corresponding to the band gap energy (Eg) of 2.64 eV, which is fairly lower than that of bulk ceria (Eg = 2.82 eV). In general, reducing the crystalline size would lead to the increase in the band gap width owing to the quantum size effect.51 However, our work is not in agreement with this viewpoint, and a similar result has also been observed in 3D hierarchical flowerlike CeO2 microspheres reported by Lu and co-workers.52 There are two plausible theories for the expatiation of the final moderate red-shift of the CeO2. The existence of the quantum confinement effect due to the nanoscale size of the primary particles forming the mesoporous CeO2 with hierarchical structures resulted in a red-shift in the UV-vis spectrum.53 On the other hand, ceria possesses intrinsic defects (Ce3+ and O vacancy concentration) in the fluorite structure, which generally introduces intermediate energy levels, resulting in a decrease in the band gap. Therefore, it can be speculated that a decrease in the band gap for the sample indicates that there has been more Ce3+ and O vacancy concentrations in mesoporous CeO2.52
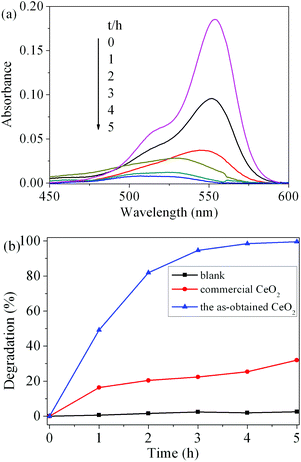
To evaluate the photocatalytic activity of the as-obtained CeO2, the photodegradation of RhB was carried out. Fig. 9(a) shows the visible spectral changes during the photocatalytic degradation of RhB in the presence of CeO2 under UV light irradiation. The characteristic absorption of RhB at 554 nm was used to monitor the degradation process as a function of irradiation time. The change in the absorption of RhB aqueous solution represented the change in the concentration. It can be seen that the characteristic adsorption peak of RhB diminished quickly with the increase in irradiation time in the degradation process and almost disappeared after 5 h. The degradation rate (%) of RhB is defined as (C0 − C)/C0 × 100%, where C and C0 represent the remnant and initial concentration of RhB, respectively. Fig. 9(b) displays the degradation rate of RhB on the two catalysts under UV light irradiation as well as the results of blank tests. After 5 h of illumination, compared to the blank experiment without a photocatalyst, the addition of CeO2 catalysts obviously promoted the degradation of RhB. The photocatalytic degradation rate of RhB solution for the as-obtained CeO2 reaches 99.6%, while the commercial CeO2 powder is only 32.0%. These results suggest that the as-obtained CeO2 exhibits good photocatalytic activity. The superior photocatalytic performances of CeO2 can be attributed to two factors. One is that the as-obtained mesoporous CeO2 possesses higher surface areas and facilitates the adsorption of the RhB molecules, which would greatly improve the catalytic efficiency.18 The other is assigned to the oxygen vacancies on the surface of mesoporous CeO2, as revealed by XPS analysis mentioned above. These abundant surface oxygen vacancies can bear a negative charge, and thus they can conveniently combine with the cationic groups of RhB via strong electrostatic attraction to form Vo−+N (Vo, oxygen vacancy; +N, the charged N in RhB) as well as hydrogen bonding with the nitrogen atoms of RhB.54
Conclusions
In summary, we have successfully synthesized Ce-CP hierarchical superstructures by a simple one-pot mixed-solvothermal method without any additional template or surfactant. The results demonstrated that it is possible to control the size and morphology of the Ce-CP hierarchical superstructures by adjusting process parameters such as reaction temperature, reaction time, total concentrations, and solvent composition of the reactants. A possible growth mechanism called self-assembly has been proposed to explain the formation of the Ce-CP hierarchical superstructures, as shown by SEM and XRD investigations. Besides, CeO2 with similar hierarchical structures was successfully synthesized by thermal conversion of the Ce-CP under air at 450 °C for 4 h. In addition, the as-obtained CeO2 exhibits high activity towards the photocatalytic degradation for organic pollutants (RhB) under a high-pressure mercury lamp. Thus, the as-obtained mesoporous CeO2 products may have potential application in eliminating organic pollutants from wastewater.Acknowledgements
S. L. Zhong acknowledges the supporting projects from the National Natural Science Foundation of China (No. 21201089, 21261010, 61201104), Jiangxi Provincial Education Department (no. KJLD13021) and Jiangxi Provincial Department of Science and Technology (no. 20144BCB23039).Notes and references
- J. M. Amigo, T. Skov and R. Bro, Chem. Rev., 2010, 110, 4582–4605 CrossRef CAS PubMed.
- M. P. Suh, H. J. Park, T. K. Prasad and D.-W. Lim, Chem. Rev., 2012, 112, 782–835 CrossRef CAS PubMed.
- D. Liu, R. C. Huxford and W. Lin, Angew. Chem., Int. Ed., 2011, 50, 3696–3700 CrossRef CAS PubMed.
- F. Ke, Y.-P. Yuan, L.-G. Qiu, Y.-H. Shen, A.-J. Xie, J.-F. Zhu, X.-Y. Tian and L.-D. Zhang, J. Mater. Chem., 2011, 21, 3843–3848 RSC.
- J. Huo, L. Wang, E. Irran, H. Yu, J. Gao, D. Fan, B. Li, J. Wang, W. Ding, A. M. Amin, C. Li and L. Ma, Angew. Chem., Int. Ed., 2010, 49, 9237–9241 CrossRef CAS PubMed.
- S. Jung, W. Cho, H. J. Lee and M. Oh, Angew. Chem., Int. Ed., 2009, 48, 1459–1462 CrossRef CAS PubMed.
- (a) S.-L. Zhong, R. Xu, L.-F. Zhang, W.-G. Qu, G.-Q. Gao, X.-L. Wu and A.-W. Xu, J. Mater. Chem., 2011, 21, 16574–16580 RSC; (b) S. Zhong, M. Wang, L. Wang, Y. Li, H. M. Noh and J. H. Jeong, CrystEngComm, 2014, 16, 231–236 RSC; (c) D. Zhao, L. Wang, Y. Li, L. Zhang, Y. Lv and S. Zhong, Inorg. Chem. Commun., 2012, 20, 97–100 CrossRef CAS PubMed; (d) L. Luo, R. Xu, D. Zhao and S. Zhong, J. Rare Earths, 2010, 28, 106–110 CrossRef CAS; (e) L. Wang, D. Zhao, S.-L. Zhong and A.-W. Xu, CrystEngComm, 2012, 14, 6875–6880 RSC; (f) S. Zhong, H. Jing, Y. Li, S. Yin, C. Zeng and L. Wang, Inorg. Chem., 2014, 53, 8278–8286 CrossRef CAS PubMed.
- (a) W. Lin, W. J. Rieter and K. M. L. Taylor, Angew. Chem., Int. Ed., 2009, 48, 650–658 CrossRef CAS PubMed; (b) W. Cho, H. J. Lee and M. Oh, J. Am. Chem. Soc., 2008, 130, 16943–16946 CrossRef CAS PubMed; (c) F.-X. Bu, M. Hu, L. Xu, Q. Meng, G.-Y. Mao, D.-M. Jiang and J.-S. Jiang, Chem. Commun., 2014, 50, 8543–8546 RSC; (d) S. Jung and M. Oh, Angew. Chem., Int. Ed., 2008, 47, 2049–2051 CrossRef CAS PubMed.
- (a) B. Lim and Y. Xia, Angew. Chem., Int. Ed., 2011, 50, 76–85 CrossRef CAS PubMed; (b) V. Polshettiwar, M. N. Nadagouda and R. S. Varma, Chem. Commun., 2008, 6318–6320 RSC; (c) M. Cao, T. Liu, S. Gao, G. Sun, X. Wu, C. Hu and Z. L. Wang, Angew. Chem., Int. Ed., 2005, 44, 4197–4201 CrossRef CAS PubMed.
- J. Zhang, Q. Xu, Z. Feng, M. Li and C. Li, Angew. Chem., Int. Ed., 2008, 47, 1766–1769 CrossRef CAS PubMed.
- I. Lisiecki, P.-A. Albouy and M.-P. Pileni, Adv. Mater., 2003, 15, 712–716 CrossRef CAS PubMed.
- S. Bharathi, D. Nataraj, M. Seetha, D. Mangalaraj, N. Ponpandian, Y. Masuda, K. Senthil and K. Yong, CrystEngComm, 2010, 12, 373–382 RSC.
- Z. Jiang, Z. Li, Z. Qin, H. Sun, X. Jiao and D. Chen, Nanoscale, 2013, 5, 11770–11775 RSC.
- M. Chen, Y. N. Kim, C. Li and S. O. Cho, Cryst. Growth Des., 2008, 8, 629–634 CAS.
- P. Chen, L. Gu and X. Cao, CrystEngComm, 2010, 12, 3950–3958 RSC.
- Z. Yu, Z. Yao, N. Zhang, Z. Wang, C. Li, X. Han, X. Wu and Z. Jiang, J. Mater. Chem. A, 2013, 1, 4571–4576 CAS.
- G. Shen, D. Chen and C. J. Lee, J. Phys. Chem. B, 2006, 110, 15689–15693 CrossRef CAS PubMed.
- L.-P. Zhu, N.-C. Bing, L.-L. Wang, H.-Y. Jin, G.-H. Liao and L.-J. Wang, Dalton Trans., 2012, 41, 2959–2965 RSC.
- H.-J. Kim, K.-I. Choi, A. Pan, I.-D. Kim, H.-R. Kim, K.-M. Kim, C. W. Na, G. Cao and J.-H. Lee, J. Mater. Chem., 2011, 21, 6549–6555 RSC.
- S. Z. Li, H. Zhang, J. B. Wu, X. Y. Ma and D. R. Yang, Cryst. Growth Des., 2006, 6, 351–353 CAS.
- K. Liu, H. You, G. Jia, Y. Zheng, Y. Huang, Y. Song, M. Yang, L. Zhang and H. Zhang, Cryst. Growth Des., 2010, 10, 790–797 CAS.
- S. Carrettin, P. Concepción, A. Corma, J. M. L. Nieto and V. F. Puntes, Angew. Chem., Int. Ed., 2004, 43, 2538–2540 CrossRef CAS PubMed.
- B. P. Pearman, N. Mohajeri, R. P. Brooker, M. P. Rodgers, D. K. Slattery, M. D. Hampton, D. A. Cullen and S. Seal, J. Power Sources, 2013, 225, 75–83 CrossRef CAS PubMed.
- X. Jiao, H. Song, H. Zhao, W. Bai, L. Zhang and Y. Lv, Anal. Methods, 2012, 4, 3261–3267 RSC.
- N. Izu, T. Uchida, I. Matsubara, T. Itoh, W. Shin and M. Nishibori, Mater. Res. Bull., 2011, 46, 1168–1176 CrossRef CAS PubMed.
- (a) D. Zhang, X. Du, L. Shi and R. Gao, Dalton Trans., 2012, 41, 14455–14475 RSC; (b) D. Zhang, F. Niu, T. Yan, L. Shi, X. Du and J. Fang, Appl. Surf. Sci., 2011, 257, 10161–10167 CrossRef CAS PubMed; (c) J. Zhang, S. Ohara, M. Umetsu, T. Naka, Y. Hatakeyama and T. Adschiri, Adv. Mater., 2007, 19, 203–206 CrossRef CAS PubMed; (d) L. Wang, L.-F. Zhang, S.-L. Zhong and A.-W. Xu, Appl. Surf. Sci., 2012, 263, 769–776 CrossRef CAS PubMed.
- H. Mai, D. Zhang, L. Shi, T. Yan and H. Li, Appl. Surf. Sci., 2011, 257, 7551–7559 CrossRef CAS PubMed.
- Z. Sun, H. Zhang, G. An, G. Yang and Z. Liu, J. Mater. Chem., 2010, 20, 1947–1952 RSC.
- S. Yang and L. Gao, J. Am. Chem. Soc., 2006, 128, 9330–9331 CrossRef CAS PubMed.
- Z. Ji, X. Wang, H. Zhang, S. Lin, H. Meng, B. Sun, S. George, T. Xia, A. E. Nel and J. I. Zink, ACS Nano, 2012, 6, 5366–5380 CrossRef CAS PubMed.
- L.-S. Zhong, J.-S. Hu, A.-M. Cao, Q. Liu, W.-G. Song and L.-J. Wan, Chem. Mater., 2007, 19, 1648–1655 CrossRef CAS.
- W. Liu, L. Feng, C. Zhang, H. Yang, J. Guo, X. Liu, X. Zhang and Y. Yang, J. Mater. Chem. A, 2013, 1, 6942–6948 CAS.
- M. Eddaoudi, H. Li and O. M. Yaghi, J. Am. Chem. Soc., 2000, 122, 1391–1397 CrossRef CAS.
- A. Querejeta- Fernández, J. C. Hernández-Garrido, H. Yang, Y. Zhou, A. Varela, M. Parras, J. J. Calvino- Gámez, J. M. González-Calbet, P. F. Green and N. A. Kotov, ACS Nano, 2012, 6, 3800–3812 CrossRef PubMed.
- Z. Shen, S. He, P. Yao, X. Lao, B. Yang, Y. Dai, X. Sun and T. Chen, RSC Adv., 2014, 4, 12844–12848 RSC.
- R. Kaminker, R. Popovitz-Biro and M. E. van der Boom, Angew. Chem., Int. Ed., 2011, 50, 3224–3226 CrossRef CAS PubMed.
- K. Liu, H. Liu, L.-L. Yang, F.-Y. Zhao, Y. Li and W.-J. Ruan, RSC Adv., 2014, 4, 25160–25164 RSC.
- H. Qiao, Y. Jia, Y. Zheng, N. Guo, Q. Zhao, W. Lv and H. You, CrystEngComm, 2012, 14, 5830–5835 RSC.
- Y. Zheng, K. Liu, H. Qiao, Y. Zhang, Y. Song, M. Yang, Y. Huang, N. Guo, Y. Jia and H. You, CrystEngComm, 2011, 13, 1786–1788 RSC.
- P. Silva, A. A. Valente, J. Rocha and F. A. A. Paz, Cryst. Growth Des., 2010, 10, 2025–2028 CAS.
- V. I. Isaeva, E. V. Belyaeva, A. N. Fitch, V. V. Chernyshev, S. N. Klyamkin and L. M. Kustov, Cryst. Growth Des., 2013, 13, 5305–5315 CAS.
- W. Steele, Chem. Rev., 1993, 93, 2355–2378 CrossRef CAS.
- C. Li, J. Yang, P. Yang, H. Lian and J. Lin, Chem. Mater., 2008, 20, 4317–4326 CrossRef CAS.
- L.-W. Qian, X. Wang and H.-G. Zheng, Cryst. Growth Des., 2012, 12, 271–280 CAS.
- (a) Z. Shen, J. Liu, F. Hu, S. Liu, N. Cao, Y. Sui, Q. Zeng and Y. Shen, CrystEngComm, 2014, 16, 3387–3394 RSC; (b) Z. Sharifzadeh, S. Abedi and A. Morsali, J. Mater. Chem. A, 2014, 2, 4803–4810 CAS; (c) Y. Lu, H. Cao, S. Zhang and X. Zhang, J. Mater. Chem., 2011, 21, 8633–8639 RSC; (d) H.-Y. Shi, B. Deng, S.-L. Zhong, L. Wang and A.-W. Xu, J. Mater. Chem., 2011, 21, 12309–12315 RSC; (e) M. Wang, F. Wang, J. Ma and J. Xu, J. Mater. Chem. A, 2014, 2, 15480–15487 RSC.
- G. Zhang, Z. Shen, M. Liu, C. Guo, P. Sun, Z. Yuan, B. Li, D. Ding and T. Chen, J. Phys. Chem. B, 2006, 110, 25782–25790 CrossRef CAS PubMed.
- M. Guo, J. Lu, Y. Wu, Y. Wang and M. Luo, Langmuir, 2011, 27, 3872–3877 CrossRef CAS PubMed.
- P. Ji, J. Zhang, F. Chen and M. Anpo, J. Phys. Chem. C, 2008, 112, 17809–17813 CAS.
- H. Borchert, Y. V. Frolova, V. V. Kaichev, I. P. Prosvirin, G. M. Alikina, A. I. Lukashevich, V. I. Zaikovskii, E. M. Moroz, S. N. Trukhan, V. P. Ivanov, E. A. Paukshtis, V. I. Bukhtiyarov and V. A. Sadykov, J. Phys. Chem. B, 2005, 109, 5728–5738 CrossRef CAS PubMed.
- H.-I. Chen and H.-Y. Chang, Solid State Commun., 2005, 133, 593–598 CrossRef CAS PubMed.
- N. K. Renuka, J. Alloys Compd., 2012, 513, 230–235 CrossRef CAS PubMed.
- J. Li, G. Lu, H. Li, Y. Wang, Y. Guo and Y. Guo, J. Colloid Interface Sci., 2011, 360, 93–99 CrossRef CAS PubMed.
- S. Yuan, Q. Zhang, B. Xu, Z. Jin, Y. Zhang, Y. Yang, M. Zhang and T. Ohno, RSC Adv., 2014, 4, 62255–62261 CAS.
- H. Xiao, Z. Ai and L. Zhang, J. Phys. Chem. C, 2009, 113, 16625–16630 CAS.
Footnote |
| † Electronic supplementary information (ESI) available: Additional graphs. See DOI: 10.1039/c5qi00016e |
| This journal is © the Partner Organisations 2015 |

