DOI:
10.1039/C5QI00036J
(Research Article)
Inorg. Chem. Front., 2015,
2, 649-656
A highly fluorescent zinc complex of a dipodal N-acyl hydrazone as a selective sensor for H2PO4− ions and application in living cells†
Received
13th March 2015
, Accepted 12th May 2015
First published on 13th May 2015
Abstract
A dipodal N-acyl hydrazone receptor (R1) was synthesized in a single step, and utilized as a test probe for the selective sensing of metal ions as well as anions. Upon the exposure to various metal ions, R1 displays rapid colorimetric and absorption changes in the presence of Co2+, Ni2+, Cu2+ and Zn2+ ions. However, R1 shows a selective fluorescence response only in the presence of Zn2+ ions and no other metal ions showed obvious changes. In particular, zinc acetate showed higher sensitivity over other zinc sources. Upon the binding of Zn2+ ions with R1, the colorless solution changed into fluorescent yellow color accompanied by the conversion of the non-fluorescence nature into the highly fluorescence nature. The in situ formed R1–Zn2+ complex was further explored for the reversible recognition of H2PO4− ions selectively over other anions such as F−, Cl−, Br−, AcO−, CN−, HSO4− and NO3− ions. A strong and enhanced emission at 502 nm and 534 nm corresponding to the R1–Zn2+ complex was quenched completely in the presence of H2PO4− ions. Relay recognition of different phosphates such as mono, di and tri basic phosphate ions was also tested. Furthermore, R1 has good cell permeability and could serve as a bioprobe in living cells for the intracellular uptake of Zn2+ and H2PO4− ions. Time dependent density functional (TDDFT) calculation has been performed to demonstrate the binding of Zn2+ ions with R1.
Introduction
Development of test probes for the biologically important metal ions and anions has gained increasing attention due to their imperative role in biological and environmental applications.1–3 Among transition metal ions, cobalt,4,5 nickel,6,7 copper8–13 and zinc14,15 are the essential elements to the human body due to their highly important role in bioprocesses such as neural transmission, gene transcription, electron transfer and metabolic processes. Also, Cu2+ and Zn2+ ions are found as the main catalytic component of many enzyme hydrolysis and redox reactions which are also helpful for the protein synthesis and DNA synthesis. At the same time, decreased concentrations of these metal ions may cause diseases like Alzheimer's disease, osteoporosis, Wilson's disease, Parkinson's disease, chronic liver and renal disease, diabetes, malignancy and infantile diarrhoea. They are also required for the normal growth of cells during pregnancy, childhood and adolescence.
Previously, analytical methods like ICP-MS, AAS and EPR were used for the quantification of metal ions, however they were undesirable in terms of their higher cost, precise results, long analysis time and the need for different sources for each metal ion. Particularly, identification of diamagnetic metal ions is not an easy process using these analytical techniques. Colorimetric analysis and fluorescence spectroscopic techniques16–21 can avoid this problem in the testing of diamagnetic Zn2+ ions with high sensitivity. The analyte recognition using fluorescence spectroscopy mainly follows the “turn-on” or “turn-off” mechanism. Still, design of a “turn-on” fluorescence sensor is highly challenging, thus giving a bright signal in the dark background. Equally, recognition of bio active anions has also come into limelight since they play significant roles in bioprocesses. In particular, phosphates are crucial anions since they are used in energy storage devices and signal transducers. Besides, phosphates are also well known anions used in industrial processes. Hence phosphate ion detection has gained great interest.22–25 Currently the relay recognition26 approach is implemented for the selective sensing of anions using in situ formed metal complexes. Although different metal complexes27–34 have been reported for the detection of phosphate ions, reports on Zn2+ ensembles for the selective sensing of phosphate ions are still limited.35–38 Utilizing the strong affinity of phosphate ions towards Zn2+ ions, recently Shi et al.39 have reported Zn2+ ensembles for the detection of H2PO4− ions. Datta et al.40 and Liang et al. have reported Zn2+ complexes for the selective sensing of pyrophosphate (PPi) ions.41
Small molecule synthesis is always welcome, because they can be synthesized in a single step which avoids the problems like high cost, disposal of hazardous chemicals and solvents. With the extension of our research in the field of chemosensors using a dipodal receptor,42–45 we have synthesized a new dipodal N-acyl hydrazone (R1) in a single step and applied it tothe forward recognition of Zn2+ ions and backward recognition of H2PO4− ions. R1 shows clear colorimetric and UV-vis changes towards Co2+, Ni2+, Cu2+ and Zn2+ ions. However, R1 displays remarkable fluorescence enhancement only in the presence of Zn2+ ions over other metal ions. Furthermore the R1–Zn2+ complex was used as a test probe for the reversible recognition of H2PO4− ions of the tetra butyl ammonium (TBA) salt selectively. Similarly, potassium salts of phosphates with different basicities were also recognized using the R1–Zn2+ complex. With the aid of florescence spectroscopy, R1 was successfully tested as a bioprobe towards the intracellular uptake of Zn2+ and H2PO4− ions in the living RAW264.7 cells. The theoretically calculated energy values were compared with the absorbance corresponding to R1 and R1–Zn2+ complexes obtained from the UV-vis spectrum.
Results and discussion
R1 was synthesized in a single step (Scheme 1) and well characterized using spectroscopic techniques. The evaluation on the binding ability of R1 toward metal ions and phosphate ions has been performed using colorimetric, UV–vis and fluorescence experiments. Utilizing the fluorescence response, testing of H2PO4− ions in living cells was performed using the R1–Zn2+ complex.
 |
| | Scheme 1 Synthesis of R1. | |
Metal ion recognition: colorimetric, UV-vis and fluorescence spectroscopy
Colorimetric recognition of any analyte is still a challenging and interesting task due to its quick response in visual changes upon binding with an organic receptor. Acetate salts of Mn2+, Co2+, Ni2+, Cu2+, Zn2+, Pb2+, Na+ and TBA+ (1.5 mM in H2O) were taken for the analysis. When 2 eq. of different metal acetates and TBAAc were added to the DMSO solution of R1 (50 μM), rapid color changes were observed from colorless to yellow for Co2+, Ni2+, Cu2+ and Zn2+ ions. Acetate salts of other counter cations did not show significant colorimetric changes (Fig. 1). Such spontaneous color changes clearly suggest that R1 could serve as a colorimetric probe for these metal ions. Such a visible color change is mainly because of the formation of coordination complexes with R1.
 |
| | Fig. 1 Colorimetric changes of R1 (50 μM in DMSO) upon the addition of 2 eq. of various acetate salts of cations (1.5 mM in H2O). | |
For gaining further insight into the metal ion coordination with R1, UV-vis titration was employed. R1 displays a strong absorption at 383 nm due to intramolecular charge transfer (ICT)46–48 within the molecule. As shown in Fig. 2, upon the addition of different metal salts, a strong absorption band was observed in the visible region at 431 nm, 447 nm, 450 nm and 450 nm in the presence of Co2+, Ni2+, Cu2+ and Zn2+ respectively. Meanwhile the absorption intensity at 383 nm decreased with the increasing concentration of metal ions. Furthermore the uniform formation of a coordination complex with R1 was investigated with the incremental addition (0–2 eq.) of these specific metal ions and the absorption spectrum was recorded (Fig. 3). In the solution phase, the N-acyl hydrazone undergoes isomerisation.49,50 The isomerization takes place through acylhydrazone-azo tautomerization which leads to the formation of the OH functional group. During the complexation process, the metal ions deprotonate the OH group present in isomerized R1 and coordinate with the oxygen anion as well as the imine nitrogen. The red shift in the absorption band at 383 nm to around 450 nm confirms the coordination of metal ions with R1. The single isosbestic point observed in the absorption spectra clearly reveals the presence of two species such as free R1 and metal ion bound R1.
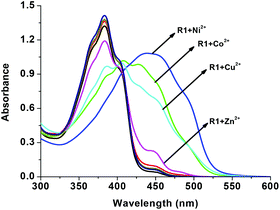 |
| | Fig. 2 UV-vis changes of R1 (50 μM in DMSO) upon the addition of 2 eq. of various acetate salts of cations (1.5 mM in H2O). | |
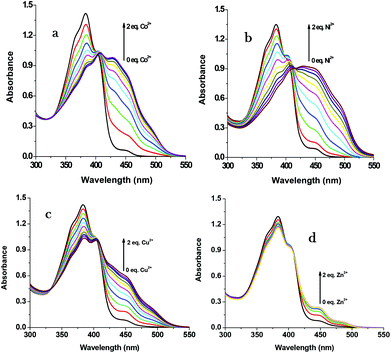 |
| | Fig. 3 UV-vis changes of R1 (50 μM in DMSO) upon the addition of 0–2 eq. of (a) Co2+, (b) Ni2+, (c) Cu2+ and (d) Zn2+ ions (1.5 mM in H2O). | |
In order to study the sensitivity of R1 towards selective metal ions, fluorescence titration was carried out. Free R1 did not show a significant fluorescence signal with the excitation at 440 nm. The non-fluorescence nature of R1 is mainly due to the presence of ICT and the free rotation of R1 around the azomethine (CH![[double bond, length as m-dash]](https://www.rsc.org/images/entities/char_e001.gif) N) bond. When R1 was exposed to different metal acetates such as Mn(OAc)2, Co(OAc)2, Ni(OAc)2, Cu(OAc)2, Pb(OAc)2, Na(OAc) and TBAAc, no significant response was found in the emission spectrum. Even though Co2+, Ni2+ and Cu2+ showed colorimetric and absorption changes, they were also not showing any significant emission changes clearly suggesting the formation of only a ground state complex. Surprisingly only the presence of Zn2+ ions showed remarkable fluorescence enhancement with two maxima at 502 nm and 534 nm (Fig. 4). The enhanced fluorescence intensity upon the complexation of R1 with Zn2+ is mainly due to the intramolecular charge transfer (ICT) and chelation enhanced fluorescence (CHEF) effect.50 The chelation of Zn2+ ions with the isomerized R1 results in more rigidity of the molecule via inhibition of free rotation of R1 around the CH
N) bond. When R1 was exposed to different metal acetates such as Mn(OAc)2, Co(OAc)2, Ni(OAc)2, Cu(OAc)2, Pb(OAc)2, Na(OAc) and TBAAc, no significant response was found in the emission spectrum. Even though Co2+, Ni2+ and Cu2+ showed colorimetric and absorption changes, they were also not showing any significant emission changes clearly suggesting the formation of only a ground state complex. Surprisingly only the presence of Zn2+ ions showed remarkable fluorescence enhancement with two maxima at 502 nm and 534 nm (Fig. 4). The enhanced fluorescence intensity upon the complexation of R1 with Zn2+ is mainly due to the intramolecular charge transfer (ICT) and chelation enhanced fluorescence (CHEF) effect.50 The chelation of Zn2+ ions with the isomerized R1 results in more rigidity of the molecule via inhibition of free rotation of R1 around the CH![[double bond, length as m-dash]](https://www.rsc.org/images/entities/char_e001.gif) N bond and the arrest of the lone pair of electrons present in the imine nitrogen. Consequently, both imine nitrogen and the electron donating nature of the deprotonated oxygen anion would be greatly increased which makes the possible coordination of Zn2+ ions. Due to the rigid conjugation caused by the CHEF effect, emission takes place within the thiophene fluorophore and gives the enhanced fluorescence intensity at 502 nm and 534 nm. The Zn2+ ion was found to form both ground as well as excited state complexes with R1, thus giving a remarkable fluorescence enhancement. With the increasing concentration of 0–2 eq. of Zn2+ ions, a gradual increase in the emission bands at 502 and 534 nm was observed (Fig. 5). The FTIR spectrum also clearly supports the complexation of Zn2+ ions with R1. Free R1 exhibits the band at 3213 cm−1, 1646 cm−1 and 1544 cm−1 corresponding to NH, C
N bond and the arrest of the lone pair of electrons present in the imine nitrogen. Consequently, both imine nitrogen and the electron donating nature of the deprotonated oxygen anion would be greatly increased which makes the possible coordination of Zn2+ ions. Due to the rigid conjugation caused by the CHEF effect, emission takes place within the thiophene fluorophore and gives the enhanced fluorescence intensity at 502 nm and 534 nm. The Zn2+ ion was found to form both ground as well as excited state complexes with R1, thus giving a remarkable fluorescence enhancement. With the increasing concentration of 0–2 eq. of Zn2+ ions, a gradual increase in the emission bands at 502 and 534 nm was observed (Fig. 5). The FTIR spectrum also clearly supports the complexation of Zn2+ ions with R1. Free R1 exhibits the band at 3213 cm−1, 1646 cm−1 and 1544 cm−1 corresponding to NH, C![[double bond, length as m-dash]](https://www.rsc.org/images/entities/char_e001.gif) O, and CH
O, and CH![[double bond, length as m-dash]](https://www.rsc.org/images/entities/char_e001.gif) N functional groups. Upon the complexation with Zn2+ ions, the band at 3213 cm−1 disappeared and the bands at 1646 cm−1 and 1544 cm−1 were shifted into 1590 cm−1 and 1519 cm−1 respectively. This result clearly suggests that the O
N functional groups. Upon the complexation with Zn2+ ions, the band at 3213 cm−1 disappeared and the bands at 1646 cm−1 and 1544 cm−1 were shifted into 1590 cm−1 and 1519 cm−1 respectively. This result clearly suggests that the O![[double bond, length as m-dash]](https://www.rsc.org/images/entities/char_e001.gif) C–NH undergoes isomerisation into HO–C
C–NH undergoes isomerisation into HO–C![[double bond, length as m-dash]](https://www.rsc.org/images/entities/char_e001.gif) N and thus the incoming Zn2+ ion forms a stable complex with the deprotonated oxygen anion and imine nitrogen atom.
N and thus the incoming Zn2+ ion forms a stable complex with the deprotonated oxygen anion and imine nitrogen atom.
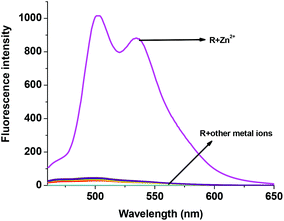 |
| | Fig. 4 Fluorescence changes of R1 (50 μM in DMSO) upon the addition of (a) 2 eq. of various acetate salts of cations (1.5 mM in H2O). | |
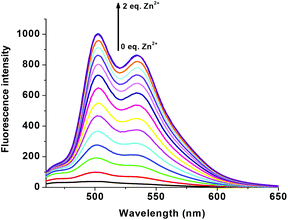 |
| | Fig. 5 Fluorescence changes of R1 (50 μM in DMSO) upon the addition of 0–2 eq. of Zn(OAc)2 (1.5 mM in H2O). | |
Specific sensing of Zn(OAc)2
To gain deep insight into the selective and specific sensing of Zn(OAc)2, fluorescence titration was carried out using other zinc salts also. As shown in Fig. 6, addition of 2 eq. of aqueous solution of Zn(OAc)2 to the solution of R1 produced strong emission at 502 nm and 534 nm with maximum intensity, whereas addition of other zinc salts such as ZnCl2, Zn(NO3)2 and ZnBr2 displayed 5–20 fold lesser fluorescence intensity than that of Zn(OAc)2. The quantum yield was measured with rhodamine B as a reference (Φ = 0.69). Quantum yield was found to be Φ = 0.01 for R1 alone, and for the complexes of R1–Zn(OAc)2, ZnCl2, ZnBr2 and Zn(NO3)2 were 0.726, 0.124, 0.083 and 0.036 respectively. These results strongly suggest that the higher basicity of Zn(OAc)2 make feasible coordination with R1 over other zinc sources.
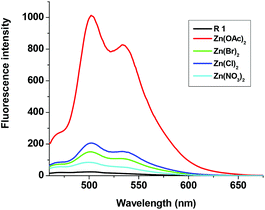 |
| | Fig. 6 Fluorescence changes of R1 (50 μM in DMSO) upon the addition of 2 eq. Zn(OAc)2, ZnCl2, Zn(NO3)2 and ZnSO4 (1.5 mM in H2O). | |
Reversible recognition of H2PO4− ions
The fluorescent R1–Zn2+ complex was further explored as a secondary sensor system towards anion recognition via the relay recognition approach. With the knowledge of strong interactions between Zn2+ and H2PO4− ions, R1–Zn2+ ensemble was expected to act as an efficient system for H2PO4− ion detection. To evaluate the selective detection of H2PO4− ions, various anions such as F−, Cl−, Br−, CN−, AcO−, HSO4− and NO3− were added to the solution of the R1–Zn2+ complex. Interestingly, the yellow color of the R1–Zn2+ complex turned colorless with the addition of H2PO4− ions only (Fig. 7). Simultaneously, the presence of H2PO4− ions causes rapid quenching in the fluorescence intensity at 502 nm and 534 nm resulting in free R1 (Fig. 8). Other anions did not show any obvious changes in the colorimetric or fluorescence response. Addition of 0–2 eq. of H2PO4− ions shows gradual quenching in the fluorescence intensity at 502 and 534 nm leading to a non-fluorescence nature which indicates the revival of the ICT process (Fig. 9). This is a stronger complexation because of the strong interaction of H2PO4− ions with Zn2+ than the complexation of Zn2+ with the deprotonated O anion. These results strongly suggest the sequestration of Zn2+ ions from the ensemble and regeneration of free R1 and form the Zn(H2PO4)2 complex. Simultaneously, relay recognition of phosphates with different basicities was also performed using KH2PO4, K2HPO4 and K3PO4 (Fig. 10). The presence of all the three phosphates quenches the fluorescence intensity of the R1–Zn2+ complex. However, the order of fluorescence quenching depending on the basicity was found to be KH2PO4 > K2HPO4 > K3PO4. Addition of 2 eq. of KH2PO4 shows similar results like TBAH2PO4 salts.
 |
| | Fig. 7 Colorimetric changes of the R1–Zn2+ complex (50 μM in DMSO) upon the addition of 2 eq. of various anions (1.5 mM in H2O). | |
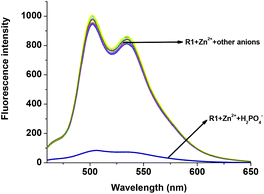 |
| | Fig. 8 Fluorescence changes of the R1–Zn2+ complex (50 μM in DMSO) upon the addition of 2 eq. of various anions (1.5 mM in H2O). | |
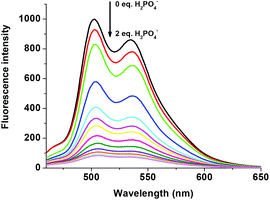 |
| | Fig. 9 Fluorescence changes of the R1–Zn2+ complex (50 μM in DMSO) upon the addition of 0–2 eq. of H2PO4− (1.5 mM in H2O). | |
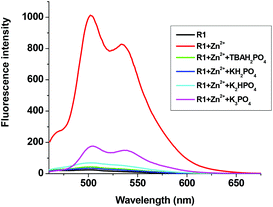 |
| | Fig. 10 Fluorescence changes of the R1–Zn2+ complex (50 μM in DMSO) upon the addition of 0–2 eq. of different phosphate sources (1.5 mM in H2O). | |
Fluorescence detection of Zn2+ and H2PO4− ions in living cells
The fluorescence detection of Zn2+ and H2PO4− ions in the cell line RAW264.7 was performed by the bio imaging process in TBS and Dulbecco's modified Eagle's medium (DMEM). Culture medium (2 ml) was added to the cell culture, which was treated with the solution of R1 (10 μM in DMSO) and the samples were incubated at 37 °C for 30 min, and then washed with TBS buffer before imaging. R1 supplemented living cells alone did not induce any fluorescence imaging. The uptake of Zn2+ (10 μM) ions by R1 supplemented cells was performed in TBS buffer (pH 7.4) and incubated for 30 min at 37 °C, and the excess of metal ions was removed by TBS buffer. The interaction of Zn2+ ions with R1, generated green fluorescence in the cells and was imaged by using a confocal microscope. Furthermore, the successive interaction of H2PO4− ions (20 μM) towards the R1–Zn2+ complex was performed. The green fluorescence was turned off upon the introduction of H2PO4− ions (Fig. 11). The obtained bio imaging results are in good agreement with the fluorescence spectra towards both Zn2+ and H2PO4− ion recognition. This bio analysis reveals the good cell permeability of R1, which can be further explored as a biomaterial for the probing of bioactive analytes in the cellular environment. Based on the results of fluorescence titrations and bioimaging analysis, the binding mechanism was proposed as in Fig. 12.
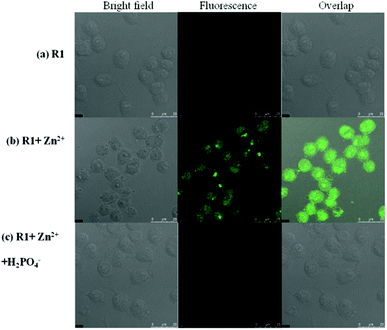 |
| | Fig. 11 Fluorescence images of macrophage (RAW 264.7) cells treated with R1, Zn2+ and H2PO4−. (Left) Bright field image; (middle) fluorescence image; and (right) merged image. (Ex. 447 nm, Em. 502–534 nm.) | |
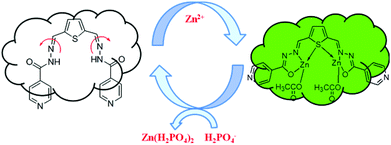 |
| | Fig. 12 Proposed mechanism for the reversible sensing of H2PO4− ions by the R1–Zn2+ complex. | |
2![[thin space (1/6-em)]](https://www.rsc.org/images/entities/char_2009.gif) :
:![[thin space (1/6-em)]](https://www.rsc.org/images/entities/char_2009.gif) 1 (metal ion:R1) binding mode was confirmed by Job's plot. Table 1 describes the association constant (Ka) values calculated using the Benesi–Hildebrand (B–H) method and detection limit values calculated using the formula 3×σ/m where, σ is the standard deviation of 10 blank samples and ‘m’ is the slope.
1 (metal ion:R1) binding mode was confirmed by Job's plot. Table 1 describes the association constant (Ka) values calculated using the Benesi–Hildebrand (B–H) method and detection limit values calculated using the formula 3×σ/m where, σ is the standard deviation of 10 blank samples and ‘m’ is the slope.
Table 1 Association constants (Ka), detection limit and stoichiometry of R1 with Co2+, Ni2+, Cu2+ and Zn2+ ions
| Metal ions |
K
a
|
LOD |
Stoichiometry |
|
Absorption measurement.
Emission measurement.
|
| Co2+ |
6.74 × 10⁴ |
4.24 μM![[thin space (1/6-em)]](https://www.rsc.org/images/entities/char_2009.gif) a a |
2![[thin space (1/6-em)]](https://www.rsc.org/images/entities/char_2009.gif) : :![[thin space (1/6-em)]](https://www.rsc.org/images/entities/char_2009.gif) 1 1 |
| Ni2+ |
1.20 × 10⁴ |
5.12 μM![[thin space (1/6-em)]](https://www.rsc.org/images/entities/char_2009.gif) a a |
2![[thin space (1/6-em)]](https://www.rsc.org/images/entities/char_2009.gif) : :![[thin space (1/6-em)]](https://www.rsc.org/images/entities/char_2009.gif) 1 1 |
| Cu2+ |
4.44 × 10⁴ |
8.47 μM![[thin space (1/6-em)]](https://www.rsc.org/images/entities/char_2009.gif) a a |
2![[thin space (1/6-em)]](https://www.rsc.org/images/entities/char_2009.gif) : :![[thin space (1/6-em)]](https://www.rsc.org/images/entities/char_2009.gif) 1 1 |
| Zn2+ |
2.06 × 10⁵ |
1.86 μM,![[thin space (1/6-em)]](https://www.rsc.org/images/entities/char_2009.gif) a 3.79 nM a 3.79 nM![[thin space (1/6-em)]](https://www.rsc.org/images/entities/char_2009.gif) b b |
2![[thin space (1/6-em)]](https://www.rsc.org/images/entities/char_2009.gif) : :![[thin space (1/6-em)]](https://www.rsc.org/images/entities/char_2009.gif) 1 1 |
| H2PO4− |
|
1.80 nM![[thin space (1/6-em)]](https://www.rsc.org/images/entities/char_2009.gif) b b |
|
TDDFT calculation
To gain in-depth knowledge in the electronic transition of R1 and R1–Zn2+ complexes, density functional theory (DFT) combined with time-dependent density functional theory (TDDFT)51 calculations were done using the Gaussian09 program package52 and the energies were compared with experimental observation. Time dependent density functional theory is one of the most important quantum chemical treatments to investigate structure, properties and dynamics of excited systems. DFT based Beck-3 Lee Young Parr (B3LYP)/6-31G(d,p) model chemistry and effective core potential (ECP) based LANL2DZ basis set was incorporated for the R1 and R1–Zn2+complexes. R1 acts as a tridentate donor via a N, O, S coordination site and thus it can easily coordinate with Zn2+ ions. The energies between HOMO (highest occupied molecular orbital) and LUMO (lowest unoccupied molecular orbital) of R1 and R1–Zn2+ complexes were calculated from the optimized structure of the same (Fig. 13 and S6†). UV-vis spectra display that the absorption band of R1 was red shifted when it undergoes complexation with Zn2+ ions. TDDFT calculation also clearly supports the above experimental results, the energy gap between HOMO and LUMO was reduced for the R1–Zn2+ (2.18 eV) complex than that of free R1 (2.761 eV). Further to explain the electronic transition, the reduced energy gap of HOMO–LUMO was correlated with the emission observed. In R1, TDDFT calculation predicts the first singlet transition S0–S1 with 2.761 eV. S0 and S1 levels are dominated by HOMO to LUMO, where the HOMO level is contributed to the electron localised imine moiety and the LUMO level is contributed to the thiophene fluorophore. The imine nitrogen contains a lone pair of electrons closely connected at the two arms of the thiophene fluorophore. Upon the excitation of free R1, there is a possibility of electron transfer from the HOMO level of the imine nitrogen to the HOMO level of the fluorophore, thus weak emission was caused. When R1 binds with Zn2+ ions, the transfer of the lone pair of electrons is inhibited, consequently the HOMO level of imine decreased than the HOMO level of the fluorophore. Thus, the electronic transition in the case of R1–Zn2+ complex takes place within the fluorophore (S1–S0) which gives strong emission (Fig. 14).
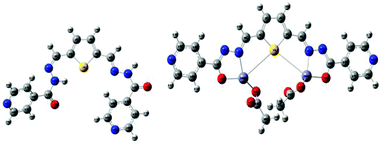 |
| | Fig. 13 Optimized geometries of R1 and R1–Zn2+ complexes. | |
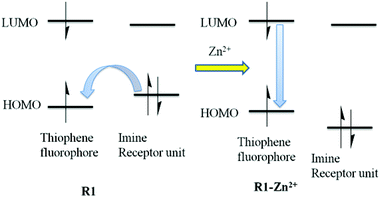 |
| | Fig. 14 Electronic transitions in R1 and R1–Zn2+ complexes. | |
Experimental section
Materials and instruments
All the starting materials and solvents used for the synthesis and titration purpose were received commercially and used as such. All the metal acetate salts, different potassium phosphate salts and tetra butyl ammonium salts of anions were received as commercial materials and used without any further purification. 1H and 13C NMR spectra were obtained on a BRUKER AV III-400 MHz spectrometer using DMSO-d6 as the solvent. Electrospray ionization mass (ESI-MS) measurements were carried out using an impact HD instrument. IR spectra were recorded on a NICOLET IS5 instrument using KBr plates. UV-vis spectra were recorded on a Shimadzu UV-2600 spectrophotometer with a quartz cuvette (path length = 1 cm) at room temperature (r.t). Fluorescence spectra were recorded on a Shimadzu RF-5301 PC spectrophotometer. For all the spectroscopic titrations, DMSO solution of R1 (5 × 10⁻⁵ M) and aqueous solution of metal acetates and anions (1.5 × 10⁻³ M) were prepared.
Cell culture for RAW264.7 macrophages for the bio imaging process
Bio imaging of living cells was performed with a Leica TCS SP5 X AOBS confocal fluorescence microscope (Germany), and a 63× oil-immersion objective lens was used. The cell line RAW264.7 was provided by the Food Industry Research and Development Institute (Taiwan). RAW264.7 cells were cultured in Dulbecco's modified Eagle's medium (DMEM) supplemented with 10% fetal bovine serum (FBS) at 37 °C under an atmosphere of 5% CO2. Cells were plated on 18 mm glass coverslips and allowed to adhere for 24 h. Experiments to assess Zn2+ uptake were performed in TBS buffer with 10 μM of Zn(OAc)2 and incubated for 30 min at 37 °C. The treated cells were washed with TBS buffer (3 × 2 mL) to remove the remaining metal ions. Culture medium (2 mL) was added to the cell culture, which was treated with a 10 μM solution of R1 dissolved in DMSO. The samples were incubated at 37 °C for 30 min. The culture medium was removed, and the treated cells were washed with TBS buffer (3 × 2 mL) before observation. Experiments to assess H2PO4− uptake were performed in TBS buffer with (CH3(CH2)3)4N(H2PO4). The above cells were treated with 20 μM of (CH3(CH2)3)4N(H2PO4) dissolved in sterilized TBS buffer (pH 7.4) and incubated for 60 min at 37 °C. The treated cells were washed three times with 2 mL TBS buffer to remove the remaining (CH3(CH2)3)4N(H2PO4). Confocal fluorescence imaging of cells was performed with a Leica TCS SP5 X AOBS confocal fluorescence microscope (Germany), and a 63× oil-immersion objective lens was used. The cells were excited with a white light laser at 447 nm, and emission was collected at 502 ± 34 nm.
Syntheses of R1
1 mmol of 2, 5 thiophene-dicarboxaldehyde in anhydrous ethanol was added to the anhydrous ethanol solution of 2 mmol of isonicotinohydrazide. The above reaction mixture was allowed to reflux at 70 °C for 2 h. Completion of reaction was monitored through TLC. The precipitate formed was filtered under hot conditions, washed with ethanol three times and the product was dried. Yield: 80%. IR (KBr, cm−1): 3431, 3213, 1646, 1544, 1295. 1H NMR (DMSO-d6, 400 MHz δ ppm): 12.14 (s, 1H, NH), 8.79 (d, J = 4.80 Hz, 2H), 7.81 (d, J = 5.20 Hz, 2H), 8.67 (s, 1H, CH![[double bond, length as m-dash]](https://www.rsc.org/images/entities/char_e001.gif) N), 7.81–7.80 (d, 2H, Ar H), 7.53 (s, 1H, Ar H). 13C NMR (DMSO-d6, 75 MHz δ ppm): 161.53, 150.32, 143.57, 140.97, 140.30, 131.79, 121.45. Mass (M+1): 379.0972 (calcd) 379.0980 (observed).
N), 7.81–7.80 (d, 2H, Ar H), 7.53 (s, 1H, Ar H). 13C NMR (DMSO-d6, 75 MHz δ ppm): 161.53, 150.32, 143.57, 140.97, 140.30, 131.79, 121.45. Mass (M+1): 379.0972 (calcd) 379.0980 (observed).
Conclusion
In summary, we have developed a new dipodal N-acyl hydrazone receptor (R1) for the selective fluorescence sensing of Zn2+ ions, particularly zinc acetate. In the presence of 2 eq. of Zn2+ ions, the colorless solution of free R1 turned yellow Meanwhile, the R1–Zn2+ complex showed a strong absorption signal at 450 nm and fluorescence enhancement with two maxima at 502 nm and 534 nm. Furthermore, the reversible and selective sensing of H2PO4− ions was also successfully demonstrated using the in situ formed R1–Zn2+ complex. The fluorescence intensity at 502 nm and 534 nm was almost quenched in the presence of H2PO4− ions and the yellow color turned colorless. Other anions such as F−, Cl−, Br−, AcO−, CN−, HSO4− and NO3− did not have a significant influence on the fluorescence signal. Reversible sensing of phosphates with different basicities were also studied using KH2PO4, K2HPO4 and K3PO4 salts. In addition to that, acetate salts of Co2+, Ni2+ and Cu2+ ions showed obvious changes in the colorimetric and UV-vis titrations, thus forming only a ground state complex. The intracellular uptake of Zn2+ ions by R1 and H2PO4− ions by the R1–Zn2+ complex was also successfully tested in the living RAW 264.7 cells with the support of a confocal microscope. TDDFT calculation was used to correlate the experimental observation.
Acknowledgements
S. V. thanks INSA for bilateral exchange fellowship to visit National Chiao Tung University, Taiwan.
Notes and references
- P. A. Gale, S. E. Garcia-Garrido and J. Garric, Chem. Soc. Rev., 2008, 37, 151 RSC.
- J. Yoon, S. K. Kim, N. J. Singh and K. S. Kim, Chem. Soc. Rev., 2006, 35, 355 RSC.
- M. Formica, V. Fusi, L. Giorgi and M. Micheloni, Coord. Chem. Rev., 2012, 256, 170 CrossRef CAS PubMed.
- S. J. Zhen, F. L. Guo, L. Q. Chen, Y. F. Li, Q. Zhang and C. Z. Huang, Chem. Commun., 2011, 47, 2562 RSC.
- D. Maity and T. Govindaraju, Inorg. chem., 2011, 50, 11282 CrossRef CAS PubMed.
- N. Aksuner, E. Henden, I. Yilmaz and A. Cukurovali, Sens. Actuators, A, 2012, 166–167, 269 CrossRef CAS PubMed.
- L. Wang, D. Ye and D. Cao, Spectrochim. Acta, Part A, 2012, 90, 40 CrossRef PubMed.
- S. Hu, S. Zhang, Y. Hua, Q. Tao and A. Wu, Dyes Pigm., 2013, 96, 509 CrossRef CAS PubMed.
- Q. Lin, P. Chen, J. Liu, Y. P. Fu, Y. M. Zhang and T. B. Wei, Dyes Pigm., 2013, 98, 100 CrossRef CAS PubMed.
- H. Zhou, J. Wang, Y. Chen, W. Xi, Z. Zheng, D. Xu, Y. Cao, G. Liu, W. Zhu, J. Wu and Y. Tian, Dyes Pigm., 2013, 98, 1 CrossRef CAS PubMed.
- T. Li, Z. Yang, Y. Li, Z. Liu, G. Qi and B. Wang, Dyes Pigm., 2011, 88, 103 CrossRef CAS PubMed.
- J. Huang, M. Tang, M. Liu, M. Zhou, Z. Liu, Y. Cao, M. Zhu, S. Liu and W. Zeng, Dyes Pigm., 2014, 107, 1 CrossRef CAS PubMed.
- D. Udhayakumari, S. Velmathi, Y. M. Sung and S. P. Wu, Sens. Actuators, B, 2014, 198, 285 CrossRef CAS PubMed.
- Z. C. Xu, J. Yoon and D. R. Spring, Chem. Soc. Rev., 2010, 39, 1996 RSC.
- E. Kimura and T. Koike, Chem. Soc. Rev., 1998, 27, 179 RSC.
- G. Q. Xie, Y. J. Shi, F. P. Hou, H. Y. Liu, L. Huang, P. X. Xi, F. J. Chen and Z. Z. Zeng, Eur. J. Inorg. Chem., 2012, 162, 327 CrossRef PubMed.
- J. F. Zhu, W. H. Chan and A. W. M. Lee, Tetrahedron Lett., 2012, 53, 2001 CrossRef CAS PubMed.
- Z. Xu, X. Liu, J. Pan and D. R. Spring, Chem. Commun., 2012, 48, 4764 RSC.
- X. Zhou, B. Yu, Y. Guo, X. Tang, H. Zhang and W. Liu, Inorg. Chem., 2010, 49, 4002 CrossRef CAS PubMed.
- L. Li, Y. Q. Dang, H. W. Li, B. Wang and Y. Wu, Tetrahedron Lett., 2010, 51, 618 CrossRef CAS PubMed.
- X. Y. Chen, J. Shi, Y. M. Li, F. L. Wang, X. Wu, Q. X. Guo and L. Liu, Org. Lett., 2009, 11, 4426 CrossRef CAS PubMed.
- E. J. O'Neil and B. D. Smith, Coord. Chem. Rev., 2006, 250, 3068 CrossRef PubMed.
- D. Aldakov and P. Anzenbacher, J. Am. Chem. Soc., 2004, 126, 4752 CrossRef CAS PubMed.
- T. D. Thangadurai, C. J. Lee, S. H. Jeong, S. Yoon, Y. G. Seo and Y.-I. Lee, Microchem. J., 2013, 106, 27 CrossRef CAS PubMed.
- X. Zhao and K. S. Schanze, Chem. Commun., 2010, 46, 6075 RSC.
- X. Lou, D. Ou, Q. Li and Z. Li, Chem. Commun., 2012, 48, 8462 RSC.
- L. Zhong, F. Xing, Y. Bai, Y. Zhao and S. Zhu, Spectrochim. Acta, Part A, 2013, 115, 370 CrossRef CAS PubMed.
- L. Jun, L. Qi, Z. YouMing and W. TaiBao, Sci. China: Chem., 2014, 57, 1257 Search PubMed.
- Z. Chen, L. Wang, G. Zou, X. Cao, Y. Wu and P. Hu, Spectrochim. Acta, Part A, 2013, 114, 323 CrossRef CAS PubMed.
- P. Saluja, N. Kaur, N. Singh and D. O. Jang, Tetrahedron Lett., 2012, 53, 3292 CrossRef CAS PubMed.
- X. Feng, Y. An, Z. Yao, C. Li and G. Shi, ACS Appl. Mater. Interfaces, 2012, 4, 614 CAS.
- S. Goswami, S. Paul and A. Manna, RSC Adv., 2013, 3, 10639 RSC.
- S. Goswami, A. Manna, S. Paul, K. Aich, A. K. Das and S. Chakraborty, Dalton Trans., 2013, 42, 8078 RSC.
- L. Fabbrizzi, N. Marcotte, F. Stomeo and A. Taglietti, Angew. Chem., Int. Ed., 2002, 41, 3811 CrossRef CAS.
- L. Tang, M. Cai, P. Zhou, J. Zhao, K. Zhong, S. Hou and Y. Bian, RSC Adv., 2013, 3, 16802 RSC.
- R. K. Pathak, K. Tabbasum, A. Rai, D. Panda and C. P. Rao, Anal. Chem., 2012, 84, 5117 CrossRef CAS PubMed.
- J. H. Lee, J. Park, M. S. Lah, J. Chin and J. I. Hong, Org. Lett., 2007, 9, 3729 CrossRef CAS PubMed.
- W. H. Chen, Y. Xing and Y. Pang, Org. Lett., 2011, 13, 1362 CrossRef CAS PubMed.
- B. B. Shi, Y. M. Zhang, T. B. Wei, Q. Lin, H. Yao, P. Zhang and X. M. You, Sens. Actuators, B, 2014, 190, 555 CrossRef CAS PubMed.
- B. K. Datta, S. Mukherjee, C. Kar, A. Ramesh and G. Das, Anal. Chem., 2013, 85, 8369 CrossRef CAS PubMed.
- L. J. Liang, X. J. Zhao and C. Z. Huang, Analyst, 2012, 137, 953 RSC.
- S. Suganya, H. J. Zo, J. S. Park and S. Velmathi, Ind. Eng. Chem. Res., 2014, 53, 9561 CrossRef CAS.
- S. Suganya, S. Velmathi and D. MubarakAli, Dyes Pigm., 2014, 104, 116 CrossRef CAS PubMed.
- S. Suganya, J. S. Park and S. Velmathi, Sens. Actuators, B, 2014, 190, 679 CrossRef CAS PubMed.
- D. Udhayakumari, S. Suganya, S. Velmathi and D. MubarakAli, J. Mol. Recognit., 2014, 27, 151 CrossRef CAS PubMed.
- S. Devaraj, D. Saravanakumar and M. Kandaswamy, Sens.
Actuators, B, 2009, 136, 13–19 CrossRef CAS PubMed.
- M. Hosseini, Z. Vaezi, M. R. Ganjali, F. Faridbod, S. D. Abkenar, K. Alizadeh and M. Salavati-Niasari, Spectrochim. Acta, Part A, 2010, 75, 978–982 CrossRef PubMed.
- H. H. Hammud, A. Ghannouma and M. S. Masoud, Spectrochim. Acta, Part A, 2006, 63, 255–265 CrossRef PubMed.
- X. Su and I. Aprahamian, Chem. Soc. Rev., 2014, 43, 1963–1981 RSC.
- L. Wang, W. Qin and W. Liu, Inorg. Chem. Commun., 2010, 13, 1122–1125 CrossRef CAS PubMed.
- E. Runge and E. K. U. Gross, Density-Functional Theory for Time-Dependent Systems, Phys. Rev. Lett., 1984, 52, 997–1000 CrossRef CAS.
-
M. J. Frisch, G. W. Trucks, H. B. Schlegel, G. E. Scuseria, M. A. Robb, J. R. Cheeseman, G. Scalmani, V. Barone, B. Mennucci, G. A. Petersson, H. Nakatsuji, M. Caricato, X. Li, H. P. Hratchian, A. F. Izmaylov, J. Bloino, G. Zheng, J. L. Sonnenberg, M. Hada, M. Ehara, K. Toyota, R. Fukuda, J. Hasegawa, M. Ishida, T. Nakajima, Y. Honda, O. Kitao, H. Nakai, T. Vreven, J. A. Montgomery Jr., J. E. Peralta, F. Ogliaro, M. Bearpark, J. J. Heyd, E. Brothers, K. N. Kudin, V. N. Staroverov, R. Kobayashi, J. Normand, K. Raghavachari, A. Rendell, J. C. Burant, S. S. Iyengar, J. Tomasi, M. Cossi, N. Rega, J. M. Millam, M. Klene, J. E. Knox, J. B. Cross, V. Bakken, C. Adamo, J. Jaramillo, R. Gomperts, R. E. Stratmann, O. Yazyev, A. J. Austin, R. Cammi, C. Pomelli, J. W. Ochterski, R. L. Martin, K. Morokuma, V. G. Zakrzewski, G. A. Voth, P. Salvador, J. J. Dannenberg, S. Dapprich, A. D. Daniels, O. Farkas, J. B. Foresman, J. V. Ortiz, J. Cioslowski and D. J. Fox, Gaussian 09, Gaussian, Inc., Wallingford CT, 2009 Search PubMed.
Footnote |
| † Electronic supplementary information (ESI) available. See DOI: 10.1039/c5qi00036j |
|
| This journal is © the Partner Organisations 2015 |
Click here to see how this site uses Cookies. View our privacy policy here.  b and
Maria Susai
Boobalan
c


![[double bond, length as m-dash]](https://www.rsc.org/images/entities/char_e001.gif) N) bond. When R1 was exposed to different metal acetates such as Mn(OAc)2, Co(OAc)2, Ni(OAc)2, Cu(OAc)2, Pb(OAc)2, Na(OAc) and TBAAc, no significant response was found in the emission spectrum. Even though Co2+, Ni2+ and Cu2+ showed colorimetric and absorption changes, they were also not showing any significant emission changes clearly suggesting the formation of only a ground state complex. Surprisingly only the presence of Zn2+ ions showed remarkable fluorescence enhancement with two maxima at 502 nm and 534 nm (Fig. 4). The enhanced fluorescence intensity upon the complexation of R1 with Zn2+ is mainly due to the intramolecular charge transfer (ICT) and chelation enhanced fluorescence (CHEF) effect.50 The chelation of Zn2+ ions with the isomerized R1 results in more rigidity of the molecule via inhibition of free rotation of R1 around the CH
N) bond. When R1 was exposed to different metal acetates such as Mn(OAc)2, Co(OAc)2, Ni(OAc)2, Cu(OAc)2, Pb(OAc)2, Na(OAc) and TBAAc, no significant response was found in the emission spectrum. Even though Co2+, Ni2+ and Cu2+ showed colorimetric and absorption changes, they were also not showing any significant emission changes clearly suggesting the formation of only a ground state complex. Surprisingly only the presence of Zn2+ ions showed remarkable fluorescence enhancement with two maxima at 502 nm and 534 nm (Fig. 4). The enhanced fluorescence intensity upon the complexation of R1 with Zn2+ is mainly due to the intramolecular charge transfer (ICT) and chelation enhanced fluorescence (CHEF) effect.50 The chelation of Zn2+ ions with the isomerized R1 results in more rigidity of the molecule via inhibition of free rotation of R1 around the CH![[double bond, length as m-dash]](https://www.rsc.org/images/entities/char_e001.gif) N bond and the arrest of the lone pair of electrons present in the imine nitrogen. Consequently, both imine nitrogen and the electron donating nature of the deprotonated oxygen anion would be greatly increased which makes the possible coordination of Zn2+ ions. Due to the rigid conjugation caused by the CHEF effect, emission takes place within the thiophene fluorophore and gives the enhanced fluorescence intensity at 502 nm and 534 nm. The Zn2+ ion was found to form both ground as well as excited state complexes with R1, thus giving a remarkable fluorescence enhancement. With the increasing concentration of 0–2 eq. of Zn2+ ions, a gradual increase in the emission bands at 502 and 534 nm was observed (Fig. 5). The FTIR spectrum also clearly supports the complexation of Zn2+ ions with R1. Free R1 exhibits the band at 3213 cm−1, 1646 cm−1 and 1544 cm−1 corresponding to NH, C
N bond and the arrest of the lone pair of electrons present in the imine nitrogen. Consequently, both imine nitrogen and the electron donating nature of the deprotonated oxygen anion would be greatly increased which makes the possible coordination of Zn2+ ions. Due to the rigid conjugation caused by the CHEF effect, emission takes place within the thiophene fluorophore and gives the enhanced fluorescence intensity at 502 nm and 534 nm. The Zn2+ ion was found to form both ground as well as excited state complexes with R1, thus giving a remarkable fluorescence enhancement. With the increasing concentration of 0–2 eq. of Zn2+ ions, a gradual increase in the emission bands at 502 and 534 nm was observed (Fig. 5). The FTIR spectrum also clearly supports the complexation of Zn2+ ions with R1. Free R1 exhibits the band at 3213 cm−1, 1646 cm−1 and 1544 cm−1 corresponding to NH, C![[double bond, length as m-dash]](https://www.rsc.org/images/entities/char_e001.gif) O, and CH
O, and CH![[double bond, length as m-dash]](https://www.rsc.org/images/entities/char_e001.gif) N functional groups. Upon the complexation with Zn2+ ions, the band at 3213 cm−1 disappeared and the bands at 1646 cm−1 and 1544 cm−1 were shifted into 1590 cm−1 and 1519 cm−1 respectively. This result clearly suggests that the O
N functional groups. Upon the complexation with Zn2+ ions, the band at 3213 cm−1 disappeared and the bands at 1646 cm−1 and 1544 cm−1 were shifted into 1590 cm−1 and 1519 cm−1 respectively. This result clearly suggests that the O![[double bond, length as m-dash]](https://www.rsc.org/images/entities/char_e001.gif) C–NH undergoes isomerisation into HO–C
C–NH undergoes isomerisation into HO–C![[double bond, length as m-dash]](https://www.rsc.org/images/entities/char_e001.gif) N and thus the incoming Zn2+ ion forms a stable complex with the deprotonated oxygen anion and imine nitrogen atom.
N and thus the incoming Zn2+ ion forms a stable complex with the deprotonated oxygen anion and imine nitrogen atom.


![[thin space (1/6-em)]](https://www.rsc.org/images/entities/char_2009.gif) :
:![[thin space (1/6-em)]](https://www.rsc.org/images/entities/char_2009.gif) 1 (metal ion:R1) binding mode was confirmed by Job's plot. Table 1 describes the association constant (Ka) values calculated using the Benesi–Hildebrand (B–H) method and detection limit values calculated using the formula 3×σ/m where, σ is the standard deviation of 10 blank samples and ‘m’ is the slope.
1 (metal ion:R1) binding mode was confirmed by Job's plot. Table 1 describes the association constant (Ka) values calculated using the Benesi–Hildebrand (B–H) method and detection limit values calculated using the formula 3×σ/m where, σ is the standard deviation of 10 blank samples and ‘m’ is the slope.![[double bond, length as m-dash]](https://www.rsc.org/images/entities/char_e001.gif) N), 7.81–7.80 (d, 2H, Ar H), 7.53 (s, 1H, Ar H). 13C NMR (DMSO-d6, 75 MHz δ ppm): 161.53, 150.32, 143.57, 140.97, 140.30, 131.79, 121.45. Mass (M+1): 379.0972 (calcd) 379.0980 (observed).
N), 7.81–7.80 (d, 2H, Ar H), 7.53 (s, 1H, Ar H). 13C NMR (DMSO-d6, 75 MHz δ ppm): 161.53, 150.32, 143.57, 140.97, 140.30, 131.79, 121.45. Mass (M+1): 379.0972 (calcd) 379.0980 (observed).


