Analysis of the upconversion photoluminescence spectra as a probe of local microstructure in Y2O3/Eu3+ nanotubes under high pressure
Zepeng Li*ab,
Jinhua Wangbd,
Yuanyuan Houb,
Xue Baic,
Hongwei Songc,
Qingjun Zhoua,
Tong Weia,
Yan Lia and
Bingbing Liu*b
aSchool of Science, Civil Aviation University of China, Tianjin 300300, China. E-mail: li_zepeng@163.com
bState Key Laboratory of Superhard Materials, Jilin University, Changchun 130012, China. E-mail: liubb@jlu.edu.cn
cState Key Laboratory on Integrated Optoelectronics, College of Electronic Science and Engineering, Jilin University, Changchun 130012, China
dSchool of Science, Tianjin University of Technology and Education, Tianjin 300222, China
First published on 4th December 2014
Abstract
In situ upconversion photoluminescence measurements of Y2O3/Eu3+ nanotubes under high pressure were carried out with 632.8 nm laser light excitation. The intensity of 5D0–7FJ (J = 0,1,2) transitions increased up to 8.2 GPa due to the enhanced crystal filed with pressure, while above 8.2 GPa, the photoluminescence intensity decreased rapidly. Full width of half maximum (FWHM) of 5D0–7F0,1,2 transitions and I0–2/I0–1 of the Eu3+ ion luminescence both exhibited obvious changes near 8.2 GPa, indicating the presence of short-range structural changes in the vicinity of the Eu3+-ion. The observed changes reflected a disordering of local micro-structure in the vicinity of Eu3+-ions resulting from the short-range distortion of YO6 octahedra under pressure. The luminescence of doped Eu3+ ions acted as an effective probe to reveal slight changes in structure and the local crystalline environment of Y2O3/Eu3+ nanotubes under high pressure.
1. Introduction
Rare-earth doped materials exhibit excellent luminescence properties and therefore have great applicability in lasers, optical amplifiers, optical temperature sensors and three-dimensional display devices.1,2 Upconversion luminescence is a transition behavior that can result in emission of a high-energy photon with absorbance of two or more low-energy excitation photons. The nanoscaled upconversion of rare-earth doped materials is an important focus of research due to both nano-effects and upconversion photoluminescence.3–5Materials properties including upconversion luminescent stroma, excitation mode, and luminescent efficiency have been extensively studied.6–8 And for nanomaterials, it is also necessary to investigate the influences of size, morphology, defects, surface and positions of doping ions when investigating the detailed properties. With respect to the upconversion luminescence of doped nanomaterials, the upconversion luminescence behavior is related not only to the aforementioned material properties but also to the surrounding local micro-structure of doping ions, as energy levels exhibit different fine distributions in the context of different local micro-structures. High pressure can induce significant changes in the properties of materials. Under high pressure, materials undergo lattice compression and potential structural transitions which can induce alterations in their properties and behavior. In addition to lattice compression and structure transitions, disordering of the lattice and amorphous transitions are also common phenomena resulting from pressure effects.9–11 Under these conditions, changes in the local micro-structure are induced, resulting in alterations in the upconversion luminescence, particularly because the luminescence of the doping ions is sensitive to the surrounding local micro-structure; therefore, it is important to study pressure-induced changes in upconversion luminescence.
Eu3+ is a commonly used doping ion due to its excellent luminescent properties, and numerous studies have been performed on luminescence and upconversion luminescence of Eu3+ ion and its hosts, typically using Eu3+ doped Y2O3 nanomaterials.12–14 Several studies of luminescence behavior of Y2O3/Eu3+ bulk sample and nanomaterials under high pressure have been described in the literatures.15–20 Wang et al., Bai et al., Zhu et al., and Dai et al. have examined pressure-induced changes in photoluminescence of Y2O3/Eu3+ nanoparticles and nanotubes excited by 514.5 nm laser light.15–19 These authors observed a red shift in photoluminescence concomitant with increased pressure, and subsequent disappearance of the red shift due to the phase transition. In a recent study, Zhang et al. investigated the photoluminescence spectra of a Y2O3/Eu3+ bulk sample under high pressure at 532 nm laser excitation, and described both the red shift and intensity ratio variation of the photoluminescence;20 however, to date no study has analyzed the upconversion photoluminescence of Y2O3/Eu3+ nanomaterials under high pressure. Given the context-dependent sensitivity of Eu3+ luminescence, we hypothesize that it can be used to probe slight changes of the local micro-structure of Y2O3/Eu3+ nanomaterials under high pressure.
In this study, we evaluated the upconversion photoluminescence spectra of Y2O3/Eu3+ nanotubes under high pressure by 632.8 nm laser light excitation. The intensity of 5D0–7FJ (J = 0,1,2) transitions increased with pressure below 8.2 GPa and decreased rapidly after 8.2 GPa. FWHM of all 5D0–7F0,1,2 transitions and I0–2/I0–1 of Eu3+ ion luminescence indicated the presence of short-range structural changes in the vicinity of Eu3+-ions when the pressure reached 8.2 GPa. We interpret these structural changes as distortion of YO6 octahedra in the short-range which causes disordering of local micro-structure in the vicinity of Eu3+ ions. Therefore, monitoring the luminescence of the doping Eu3+ ion can be used as an effective probe to reveal slight changes in structure and the local crystalline environment of Y2O3/Eu3+ nanotubes under high pressure.
2. Experimental details
The Y2O3/Eu3+ nanotubes used in this study were fabricated using hydrothermal methods with a 1![[thin space (1/6-em)]](https://www.rsc.org/images/entities/char_2009.gif) :
:![[thin space (1/6-em)]](https://www.rsc.org/images/entities/char_2009.gif) 0.01 molar ratio of Y2O3 and Eu2O3, as described previously.21 The samples consisted predominantly of nanotubes with outer diameters of 20–40 nm and lengths of 1 μm, with walls 5–10 nm in thickness. The diamond anvil cell (DAC) was used in high pressure experiments with a 4
0.01 molar ratio of Y2O3 and Eu2O3, as described previously.21 The samples consisted predominantly of nanotubes with outer diameters of 20–40 nm and lengths of 1 μm, with walls 5–10 nm in thickness. The diamond anvil cell (DAC) was used in high pressure experiments with a 4![[thin space (1/6-em)]](https://www.rsc.org/images/entities/char_2009.gif) :
:![[thin space (1/6-em)]](https://www.rsc.org/images/entities/char_2009.gif) 1 methanol
1 methanol![[thin space (1/6-em)]](https://www.rsc.org/images/entities/char_2009.gif) :
:![[thin space (1/6-em)]](https://www.rsc.org/images/entities/char_2009.gif) ethanol mixture as the pressure medium. Pressure was calibrated by a shift in the ruby R1 line. Analysis of high pressure-induced upconversion photoluminescence was carried out by excitation at 632.8 nm and signal was collected using a Renishaw inVia Raman Microscope equipped with a charge coupled device (CCD) detector.
ethanol mixture as the pressure medium. Pressure was calibrated by a shift in the ruby R1 line. Analysis of high pressure-induced upconversion photoluminescence was carried out by excitation at 632.8 nm and signal was collected using a Renishaw inVia Raman Microscope equipped with a charge coupled device (CCD) detector.
3. Results and discussion
Fig. 1 shows the upconversion photoluminescence spectrum of Y2O3/Eu3+ nanotubes after excitation at 632.8 nm at ambient pressure. Based on spectrum analysis, red 5D0–7FJ (J = 0,1,2) transitions are observed at 580.2 nm (5D0–7F0), 587.2, 593.1, 599.8 nm (5D0–7F1) and 611.2 nm (5D0–7F2), with the 5D0–7F2 transition being dominant among these lines. The cubic structure of Y2O3 contains two distinct metal sites: Y1 (25% of all sites) and Y2 (75% of all sites). Y1 is centrosymmetric with S6 symmetry, and Y2 is noncentrosymmetric with C2 symmetry.22–24 The doped Eu3+ cations occupy both Y1 and Y2 sites. The observed upconversion photoluminescence peaks in Fig. 1 derive mainly from energy level transitions of Eu3+ ion at the Y2 site with C2 symmetry.25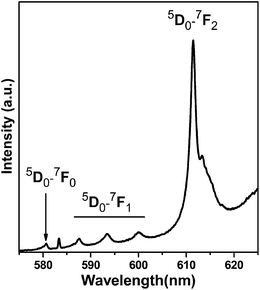 | ||
| Fig. 1 Upconversion photoluminescence spectrum of Y2O3/Eu3+ nanotubes at ambient pressure by 632.8 nm excitation. | ||
Fig. 2 illustrates the pressure-dependent upconversion photoluminescence of Y2O3/Eu3+ nanotubes excited by 632.8 nm laser lines under high pressure up to 22.8 GPa. The 5D0–7F2 and 5D0–7F0,1 transitions of Y2O3/Eu3+ nanotubes below and above 8.2 GPa are illustrated in Fig. 2a and b, respectively. We observed three transitions exhibiting similar behavioral changes depending on pressure. Transitions increased with pressure, reaching a maximum at 8.2 GPa, then decreasing above 8.2 GPa. In photoluminescence experiments carried out under high pressure, data were collected under identical experimental conditions and at the same laser power, laser spot size, exposure time, and same focus microscopic lens at each pressure point in order to rule out the possibility that the observed behavior of intensities under high pressure was due to experimental conditions. At increasing pressures up to 22.8 GPa, the intensities of 5D0–7F0,1,2 transitions greatly weakened and were barely detectable. Based on our previous study of pressure-dependent structural changes, Y2O3/Eu3+ nanotubes have been shown to transform from initial cubic structure into an amorphous phase at 21.9 GPa;26 therefore the disappearance of photoluminescence intensities can be attributed to the amorphous phase transition.
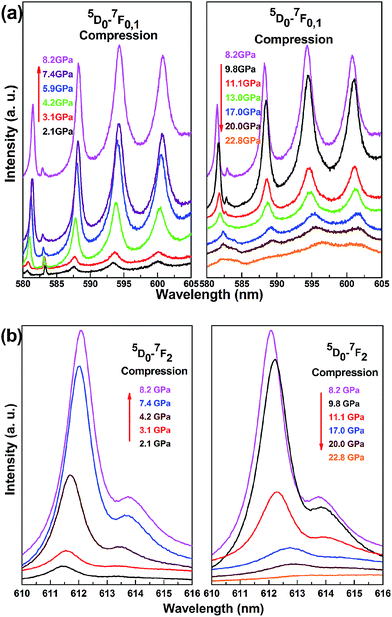 | ||
| Fig. 2 The pressure-dependent upconversion photoluminescence spectrum of Y2O3/Eu3+ nanotubes at 632.8 nm laser lines under high pressure. | ||
In the previous reports, Henrie's studies of lanthanide metal ions found that the length of Y(Eu)–O bonds is an important factor for upconversion photoluminescence intensities, with shorter bond lengths associated with stronger photoluminescence intensities due to increased sensitivity of transitions.27 Additional studies on the luminescence of Eu3+ ions also give the similar interpretation such as the spectroscopy in Zn(PO3)2/Eu3+, Pb(PO3)2/Eu3+, Ba(PO3)2/Eu3+ and Eu(OH)3.28,29 As is previously studied, under the excitation by 632.8 nm, the Eu3+ ions was thermally populated to the 7F2 low lying level approximately in 0.2% of that of the ground state firstly and then jump to high level 5D0 by absorbing photons.22 The energy transfer process involves phonon-assisted excitation similar to nonresonant upconversion with avalanche effect.22 Eu3+ was doped into the host of Y2O3, and occupies the site of Y3+ and thus we can think the length of Y–O bond as length of Eu–O bond. Under high pressure, the lattice of Y2O3/Eu3+ nanotubes undergoes compression which results in shortening of both Eu–O and Y–O bonds, thus inherently increasing the strength of the surrounding crystal field of Eu3+ ions and the phonon's frequency. This increases the thermal transfer efficiency from lattice of Y2O3 host to Eu3+ ions and would makes more populations to the 7F2 low lying level for Eu3+ ions. Meanwhile, enhanced energy transfer efficiency due to the multiphonon-assist excitations also causes more transition from 7F2 low lying level to high level 5D0. On the other hand, the increased phonon's frequency is too small to promote the increase of the multiphonon nonradiative transition under high pressure. Therefore, this indicates the influences from more thermal populations and transition supersensitivity induced by the strengthened crystal field on the luminescence intensity are dominated under high pressure. Thus, we predicted that the upconversion photoluminescence intensity should continue increase with pressure due to the strengthened thermal populations and supersensitivity of transition until the phase transition occurred; however, we observed decreased intensity above 8.2 GPa for all 5D0–7F0,1,2 transitions. The similar phenomenon has not been observed in the previous reports on the non-upconversion luminescence study excited by 514 nm or 532 nm laser.15–20 In order to explore the changes in upconversion photoluminescence intensity in detail, we further investigated the full width of half maximum (FWHM) of 5D0–7F0,1,2 transitions with pressure. The FWHM of all 5D0–7F0,1,2 transitions exhibited striking changes and the photoluminescence peaks collectively become broader with pressure above approximately 8.2 GPa (Fig. 3). The phenomenon of collective broadening in photoluminescence transitions at 8.2 GPa cannot be explained by above discussion, and there is also no phase transitions occurrence near 8.2 GPa; therefore, additional factors that are responsible for changes in transition behavior must be investigated. From the above discussion, we think that the Eu3+ ion transition is more sensitive to crystal field, especially the surrounding local micro-structure. Since the 5D0–7F2 transition is an electronic dipole transition, we can infer that the local micro-structure surrounding Eu3+ ion could undergo changes near 8.2 GPa, although Y2O3/Eu3+ nanotubes do not undergo the phase transformation. Considering the decrease in photoluminescence intensity and collective broadening of FWHM of photoluminescence peaks for all 5D0–7F0,1,2 transitions, we conclude that disordering of local micro-structure with pressure likely occurs near 8.2 GPa. The corresponding changes in the local micro-structure can be interpreted using the Judd–Ofelt theory.30,31 The Judd–Ofelt parameter Ω2, defined as the intensity ratio of 5D0–7F2 transition to 5D0–7F1 transition (I0–2/I0–1) of Eu3+ ion, is related to short-range effects and reflects changes in the local surrounding microstructure. Therefore, I0–2/I0–1 can be used to probe the disordering of local micro-structural changes surrounding Eu3+ ions, thus reflecting short-range structural changes. It is important to verify the ratiocination of the local micro-structural disordering surrounding Eu3+ ion near 8.2 GPa. To this end, we analysized the intensity ratio of the 5D0–7F2 transition to the 5D0–7F1 transition and plotted it as a function of pressure (Fig. 4). I0–2/I0–1 is not continuous with increasing pressure and an obvious change is observed at 8.2 GPa. According to Capobianco et al., the pressure-induced I0–2/I0–1 can be ascribed, in part, to the change of average length or covalency of Eu–O bonds with pressure.28 Oomen and van Dongen's study demonstrated that the continuous change in I0–2/I0–1 under high pressure is due to changes in the covalency of the Eu3+ ion-ligand.32 In previous studies on the abrupt changes in I0–2/I0–1 from Eu3+ ions, the authors consistently ascribed this finding to the phase transition; yet in the present study we have confirmed that no phase transition occurs below 21.9 GPa. Therefore, the sudden change of I0–2/I0–1 indicates a concomitant “structural change” in the vicinity of the Eu3+-ion which induces changes in Eu–O bonds. This “structural change” surrounding the Eu3+-ion does not originate from the phase transition of Y2O3/Eu3+ nanotubes and thus it should be attributed to changes in the local microstructure in the vicinity of the Eu3+-ion.
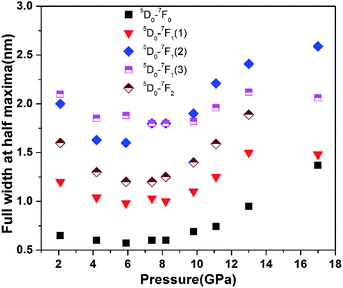 | ||
| Fig. 3 The full width at half maxima (FWHM) of the upconversion photoluminescence peaks of 5D0–7F0, 5D0–7F1 and 5D0–7F2 transitions under high pressure. | ||
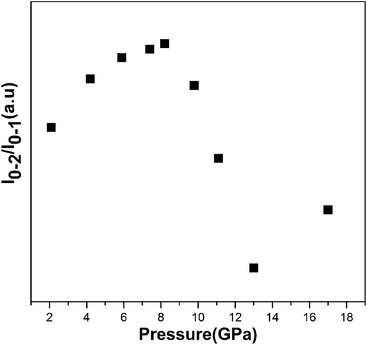 | ||
| Fig. 4 Upconversion photoluminescence intensity ratio (I0–2/I0–1) of 5D0–7F2 and 5D0–7F1 transitions with increasing pressure. | ||
From the above discussion, we conclude that pressure-induced changes in I0–2/I0–1 are an indicator of “structural changes” of local micro-structure in the vicinity of the Eu3+-ion, and that FWHM of all 5D0–7F0,1,2 transitions occurring under pressure suggests disordering of the local micro-structure surrounding the Eu3+ ion above 8.2 GPa. In this study, we analyzed in detail the changes of local micro-structure under pressure. In our previous study on the pressure-induced alterations in structural behavior using the synchrotron XRD method, we demonstrated that the YO6 octahedra underwent short-range distortion due to differential effects of pressure on the sample.26 Under high pressure, Y–O bond length varies nonlinearly, resulting in the deformation of YO6 octahedra near 8.2 GPa; this deformation induces local micro-structural disordering of atom arrangements in short range. The doped Eu3+ ion occupies the sites of Y3+, therefore local micro-structure in the vicinity of Eu3+-ions also become disordered and the local micro crystal field surrounding Eu3+ ion consequently changes. Ultimately, due to the energy level of Eu3+ ion broadening and symmetry being reduced, the effective energy transfer from lattice to Eu3+ ions is limited although the lattice of Y2O3/Eu3+ undergoes the continue compression and the thermal populations of Eu3+ ions to 7F2 low lying level decays which resulting in the decrease in intensity. In this case, the upconversion photoluminescence of the doping Eu3+ ion is an effective probe that reveals fine structural changes in the local crystalline environment of Y2O3/Eu3+ nanotubes under high pressure.
We also demonstrate a continuous shift in emission peaks to red regions with increased pressure (Fig. 2). The wavenumber is sensitive to shifts and is proportional to the energy level, which facilitates identification of level shifts caused by high pressure. Therefore, the unit of the transitions is changed from wavelength to wavenumber for clear identification of peak shifts. When the variations of the wavenumber of all observed emission peaks of Y2O3/Eu3+ nanotubes are expressed as a function of the applied pressure (Fig. 5), we observed that the wavenumber variations also exhibit slight changes near 8.2 GPa. The fitted linear variation coefficients are −4.13 cm−1 GPa−1, −3.62 cm−1 GPa−1, −4.24 cm−1 GPa−1, −3.18 cm−1 GPa−1 and −2.83 cm−1 GPa−1 respectively before 8.2 GPa under high pressure for 5D0–7F0 (580.2 nm), 5D0–7F1 (587.2 nm, 593.1 nm and 599.8 nm) and 5D0–7F2 (611.2 nm). After 8.2 GPa, the corresponding variation coefficients became −2.54 cm−1 GPa−1, −2.53 cm−1 GPa−1, −2.50 cm−1 GPa−1, −2.47 cm−1 GPa−1 and −1.65 cm−1 GPa−1 respectively.
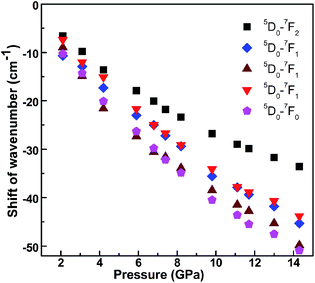 | ||
| Fig. 5 The shift of wavenumber of the upconversion photoluminescence peaks of 5D0–7F0, 5D0–7F1 and 5D0–7F2 transitions under high pressure. | ||
4. Conclusions
In this work, we present an analysis of upconversion luminescent spectra from Y2O3/Eu3+ nanotubes under high pressure by 633 nm laser light excitation. The intensity of 5D0–7FJ (J = 0,1,2) transitions increased with pressure up to 8.2 GPa due to the enhanced crystal field induced by compression. Above 8.2 GPa, luminescence intensity decreases rapidly. FWHM of all 5D0–7F0,1,2 transitions and I0–2/I0–1 of Eu3+ ions luminescence both exhibit obvious changes near 8.2 GPa, indicating short-range structural changes in the vicinity of the Eu3+-ion. We ascribe these changes to distortion of the YO6 octahedra in short-range, which causes disordering of local micro-structure in the vicinity of the Eu3+-ion. In summary, monitoring the luminescence of the doping Eu3+ ion is an effective probe to reveal slight changes in structure and the local crystalline environment of Y2O3/Eu3+ nanotubes under high pressure.Acknowledgements
This work was funded by the NSFC (11304380, 11404241, 51102277), the National Basic Research Program of China (2011CB808200), the Cheung Kong Scholars Programme of China, Tianjin Research Program of Application Foundation and Advanced Technology (11JCYBJC26900, 14JCQNJC03700), the Scientific Research Foundation of Civil Aviation University of China (2011QD23X), the Fundamental Research Funds for the Central Universities (3122013D008).References
- F. Vetrone, J. C. Boyer, J. A. Capobianco, A. Speghini and M. Bettinelli, J. Phys. Chem. B, 2003, 107, 1107 CrossRef CAS.
- T. Soukka, T. Rantanen and K. Kuningas, Ann. N. Y. Acad. Sci., 2008, 1130, 188 CrossRef CAS PubMed.
- F. Wang, Y. Han and X. G. Liu, Nature, 2010, 463, 1061 CrossRef CAS PubMed.
- F. Zhang and D. Y. Zhao, ACS Nano, 2009, 3, 159 CrossRef CAS PubMed.
- Z. Q. Li, Y. Zhang and S. Jiang, Adv. Mater., 2008, 20, 4765 CrossRef CAS.
- J. C. Boyer, F. Vetrone, A. C. Louis and J. A. Capobianco, J. Am. Chem. Soc., 2006, 128, 7444 CrossRef CAS PubMed.
- F. Wang and X. G. Liu, J. Am. Chem. Soc., 2008, 130, 5642 CrossRef CAS PubMed.
- X. M. Li, R. Wang, F. Zhang and D. Y. Zhao, Nano Lett., 2014, 14, 3634 CrossRef CAS PubMed.
- T. Sato and N. Funamori, Phys. Rev. Lett., 2008, 101, 255502 CrossRef.
- V. Swamy, A. Kuznetsov, L. S. Dubrovinsky, P. F. McMillan, V. B. Prakapenka, G. Shen and B. C. Muddle, Phys. Rev. Lett., 2006, 96, 135702 CrossRef.
- L. Wang, W. Yang, Y. Ding, Y. Ren, S. Xiao, B. Liu, S. V. Sinogeikin, Y. Meng, D. J. Gosztola, G. Shen, R. J. Hemley, W. L. Mao and H. K. Mao, Phys. Rev. Lett., 2010, 105, 095701 CrossRef.
- C. Y. Shang, X. Q. Wang, H. Kang and D. M. Han, J. Appl. Phys., 2011, 109, 104309 CrossRef PubMed.
- X. Bai, H. W. Song, G. H. Pan, Z. X. Liu, S. Z. Lu, W. H. Di, X. G. Ren, Y. Q. Lei, Q. L. Dai and L. B. Fan, Appl. Phys. Lett., 2006, 88, 143104 CrossRef PubMed.
- A. V. Murugana, A. K. Viswanath, V. Ravi, B. A. Kakade and V. Saaminathan, Appl. Phys. Lett., 2006, 89, 123120 CrossRef PubMed.
- L. Wang, Y. X. Pan, Y. Ding, W. G. Yang, W. L. Mao, S. V. Sinogeikin, Y. Meng, G. Y. Shen and H. K. Mao, Appl. Phys. Lett., 2009, 94, 061921 CrossRef PubMed.
- H. Y. Zhu, Y. Z. Ma, H. B. Yang, P. F. Zhu, J. G. Du, C. Ji and D. B. Hou, Solid State Commun., 2010, 150, 1208 CrossRef CAS PubMed.
- R. C. Dai, Z. M. Zhang, C. C. Zhang and Z. Ding, J. Nanosci. Nanotechnol., 2010, 107, 629 Search PubMed.
- X. Bai, H. W. Song, B. B. Liu, Y. Y. Hou, G. H. Pan and X. G. Ren, J. Nanosci. Nanotechnol., 2008, 8, 1404 CAS.
- R. C. Dai, Z. P. Wang, Z. M. Zhang and Z. J. Ding, J. Rare Earths, 2010, 28, 241 CrossRef.
- J. Zhang, H. Cui, P. F. Zhu, C. L. Mang, X. X. Wu, H. Y. Zhu, Y. Z. Ma and Q. L. Cui, J. Appl. Phys., 2014, 115, 023502 CrossRef PubMed.
- X. Bai, H. W. Song, L. X. Yu, L. M. Yang, Z. X. Liu, G. H. Pan, S. Z. Lu, X. G. Ren, Y. Q. Lei and L. B. Fan, J. Phys. Chem. B, 2005, 109, 15236 CrossRef CAS PubMed.
- J. Silver, M. I. Martinez-Rubio, T. G. Ireland, G. R. Fern and R. Withnall, J. Phys. Chem. B, 2001, 105, 9107 CrossRef CAS.
- M. Faucher and J. Pannetier, Acta Crystallogr., Sect. B: Struct. Crystallogr. Cryst. Chem., 1980, 36, 3209 CrossRef.
- K. Robinson, V. G. Gibbs and P. H. Ribbe, Science, 1971, 172, 567 CAS.
- M. J. Weber, Phys. Rev., 1968, 171, 283 CrossRef CAS.
- Z. P. Li, J. H. Wang, L. Wang, X. Bai, H. W. Song, Q. J. Zhou, T. Wei, D. M. An and B. B. Liu, Mater. Res Express, 2014, 1, 025013 CrossRef.
- D. E. Henrie, R. L. Fellows and G. R. Choppin, Coordin. Chem. Rev., 1976, 18, 199 CrossRef CAS.
- J. A. Capobianco, P. P. Proulx, M. Bettinelli and F. Negrisolo, Phys. Rev. B: Condens. Matter Mater. Phys., 1990, 42, 5936 CrossRef CAS.
- G. Chen, R. G. Haire and J. R. Peterson, J. Phys. Chem. Solids, 1995, 56, 1095 CrossRef CAS.
- B. R. Judd, Phys. Rev., 1962, 127, 750 CrossRef CAS.
- G. S. Ofeit, J. Chem. Phys., 1962, 37, 511 CrossRef PubMed.
- E. W. J. L. Oomen and A. M. A. Van Dongen, J. Non-Cryst. Solids, 1989, 111, 205 CrossRef CAS.
| This journal is © The Royal Society of Chemistry 2015 |
