(K0.5Na0.5)NbO3:Eu3+/Bi3+: a novel, highly efficient, red light-emitting material with superior water resistance behavior
Qiwei Zhang,
Haiqin Sun*,
Tao Kuang,
Ruiguang Xing and
Xihong Hao*
School of Materials and Metallurgy, Inner Mongolia University of Science and Technology, 7# Arerding Street, Kun District, Baotou 014010, China. E-mail: a8082sz@imust.edu.cn; xhhao@imust.edu.cn; Fax: +86 472 5951571; Tel: +86 472 6896872
First published on 10th December 2014
Abstract
Materials emitting red light (∼611 nm) under excitation with blue light (440–470 nm) are highly desired for fabricating high-performance white light-emitting diodes (LEDs). Conventionally used red light-emitting materials (e.g., Y2O3:Eu3+ or Y2O2S:Eu3+) exhibit a relatively poor blue light-absorption and a weak chemical stability. In this paper, we reported on a novel red light-emitting material based on a (K0.5Na0.5)NbO3 (KNN) matrix co-doped with Bi3+ and Eu3+ showing a strong absorption in the blue light region and superior water resistance properties. The crystal structure, photoluminescence, thermal stability, energy transfer mechanism and water resistance behavior of the samples were systematically investigated. A strongly enhanced red light-emission at 616 nm originating from the 5D0 → 7F2 transition of Eu3+ ions was observed after adding Bi3+ ions as an alternative to increasing the Eu3+ concentration due to the energy transfer from Bi3+ to Eu3+. After adding 0.05 mol of Bi3+ as sensitizer, the sample with the composition of (K0.5Na0.5)0.90Eu0.05Bi0.05NbO3 exhibited the strongest red light-emission and a high quantum yield under 465 nm excitation. Doping with Bi3+ also endowed the KNN:Eu3+ samples with a good thermal stability (83% of the initial intensity at 150 °C) and a superior water resistance behavior (94.3% of the initial intensity after 40 h of immersion). These results demonstrate the great potential of the Bi3+/Eu3+ co-doped KNN material for a future application in white LEDs and novel multifunctional devices.
1. Introduction
Lead-free piezoelectric materials, such as BaTiO3 (BT), (K0.5Na0.5)NbO3 (KNN), (Bi0.5Na0.5)TiO3 (BNT), and their derivatives, have stimulated increasing practical interest due to their excellent ferroelectric/piezoelectric properties and are widely used in smart sensors, actuators, piezoelectric transducers, and other electronic devices.1–4 Among these lead-free piezoelectric materials, sodium potassium niobate (KNN), i.e., a solid solution of ferroelectric KNbO3 and anti-ferroelectric NaNbO3 in the ratio of 1![[thin space (1/6-em)]](https://www.rsc.org/images/entities/char_2009.gif) :
:![[thin space (1/6-em)]](https://www.rsc.org/images/entities/char_2009.gif) 1 with an A1+B5+O32+ perovskite structure, is currently one of the most widely exploited materials due to its low coercive electric fields, high depolarization temperatures, and excellent piezoelectric properties (d33 of up to 80 pC N−1, Tc ∼ 420 °C, Pr ∼ 33 μC cm−2).5 The piezoelectric properties of KNN-based materials can be significantly enhanced by optimizing the processing conditions and by ion substitution (A-site and/or B-site substitution).6 For example, the piezoelectric constant d33 can reach up to 416 pC N−1 in Li, Ta, and Sb-doped KNN ceramics, which is comparable to values obtained for Pb(Zr,Ti)O3.7 Therefore, the majority of studies on KNN-based ceramics focus on an enhancement of the piezoelectric properties and a practical application in micro-electronic devices.
1 with an A1+B5+O32+ perovskite structure, is currently one of the most widely exploited materials due to its low coercive electric fields, high depolarization temperatures, and excellent piezoelectric properties (d33 of up to 80 pC N−1, Tc ∼ 420 °C, Pr ∼ 33 μC cm−2).5 The piezoelectric properties of KNN-based materials can be significantly enhanced by optimizing the processing conditions and by ion substitution (A-site and/or B-site substitution).6 For example, the piezoelectric constant d33 can reach up to 416 pC N−1 in Li, Ta, and Sb-doped KNN ceramics, which is comparable to values obtained for Pb(Zr,Ti)O3.7 Therefore, the majority of studies on KNN-based ceramics focus on an enhancement of the piezoelectric properties and a practical application in micro-electronic devices.
In addition to applications utilizing the piezoelectric and ferroelectric properties of KNN-based materials, e.g. in piezoelectric transducers, KNN is currently considered as a promising host matrix for luminescent materials, due to their superior chemical stability, successive structural phase transitions and non-linear optical behavior, with the luminescence achieved through the introduction of rare earth (RE) ions.8–10 In our previous work, we have shown that the emission of red light (617 nm and 650 nm) and green light (528 nm) can be realized in Pr3+-doped KNN materials.11 In fact, RE elements not only act as activator ions to achieve luminescence, but also act as structural modifiers, thereby improving the electrical properties of some ferroelectric perovskite-type compounds.
Recently, several studies on RE-doped ferroelectric oxides have been published.12–16 The simultaneous existence of luminescence and ferroelectric/piezoelectric properties has been realized, as well as a dual-enhancement of both the ferro-/piezoelectric and the photoluminescence performance in Pr3+-doped KNN ceramics.17 These results indicate that RE-doped ferroelectric oxides may see a potential application in novel multifunctional devices by integrating at least two characteristics. Unfortunately, compared to traditional phosphors, such as alkaline earth sulfide/oxysulfide phosphors and nitrides/oxynitrides, RE-doped ferroelectric oxides exhibit a relatively low luminescence efficiency (quantum yield < 15%), due to their relatively large phonon energy.18–20 Some approaches on controlling the electric fields and increasing the RE-doping concentrations were recently proposed by Hao et al.14 and Liu et al.21 However, so far, only a few studies have been reported on high-efficient RE-doped ferroelectric/piezoelectric materials. Hence, it is urgent to further improve the luminescence efficiency of this kind of materials to values comparable to traditional phosphors.
Eu3+ ions have been widely used in most commercial phosphors as activators, showing red light-emission at about 613 nm.22–24 Furthermore, the red light-emission intensity can be remarkably improved by an energy transfer from sensitizer ions to RE ions. Sensitizers can effectively compensate for the low luminescence efficiency of RE ions resulting from the small absorption cross section of the parity-forbidden intra-4f transition.25,26 Among the potential sensitizers, Bi3+ ions have been shown to be a very good sensitizer for Eu3+ ions. For example, Datta et al. reported an increase in the emission intensity by a factor of 2 for Bi3+-doped YVO4:Eu materials.27 Recently, Liu et al. reported on the ZnB2O4:10%Eu:10%Bi system.21 The emission intensity and quantum efficiency of the phosphor could be increased by 14% and 6%, respectively, due to the introduction of Bi3+ ions. These results suggest that it is possible to design and fabricate highly efficient red light-emitting ferroelectric/piezoelectric materials.
In this work, a novel lead-free luminescent ferroelectric material has been fabricated by co-doping Bi3+ and Eu3+ ions into a (K0.5Na0.5)TiO3 (KNN) host material. To the best of our knowledge, the photoluminescent properties of Bi3+/Eu3+-co-activated KNN ceramics have not been investigated so far. It is expected that a highly efficient red light-emission with a quantum yield of ∼0.34 can be achieved through an energy transfer from the sensitizer Bi3+ to the activator Eu3+ in the KNN host as an alternative to increasing the Eu3+ ion concentration, which might allow for an enhancement of luminescence efficiency at much lower cost. In this study, we systematically investigated the effect of the Bi3+ ions on the processing, phase structure, photoluminescence, thermal stability and water resistance properties of Bi3+/Eu3+-doped KNN ceramics.
2. Material and methods
2.1. Sample preparation
The KNN samples co-doped with Bi3+ and Eu3+ were synthesized utilizing the conventional solid-state reaction method. K2CO3 (99%, Alfa Aesar), Na2CO3 (99.5%, Alfa Aesar), Nb2O5 (99.5%, Alfa Aesar), Eu2O3 (99.99%, Alfa Aesar) and Bi2O3 (99.975%, Alfa Aesar) powders were used as raw materials and weighted according to the formula: (K0.5Na0.5)0.95−xEu0.05BixNbO3 (abbreviated as KNEBxN, x = 0, 0.005, 0.015, 0.025, 0.04, 0.05, 0.07, 0.10, 0.15). These weighted powders were mixed with ethanol, dried at 100 °C, and calcined in an alumina crucible at 880 °C for 6 h in air. Then, the calcined powders were crushed and mixed again. The obtained powders were mixed and pulverized with an 8 wt% polyvinyl alcohol binder and pressed into disk-shaped pellets with a diameter of 10 mm and a thickness of 1 mm thickness at a pressure of 100 MPa. Then, to remove the binder, the pellets were annealed at 550 °C for 10 h using a heating rate of 1 °C min−1.In order to suppress the evaporation of alkali elements during the sintering process, the green pellets with different composition were covered with the corresponding powders, and sintered at 1130–1150 °C for 4 h in air. The sintering process is schematically illustrated in Fig. 1. To investigate the effect of the sintering temperature on the luminescence properties, the sample with x = 0.05 was sintered at 900, 1000, 1050, 1080, 1110, 1130, 1150, 1170, and 1190 °C for 4 h in air, respectively.
2.2. Characterization
X-ray diffraction (XRD) analysis was performed to identify the phase structure of the samples utilizing Cu Kα radiation (D8 Advanced, Bruker, Germany). The microstructure of the sintered samples was investigated by field emission scanning electron microscopy (FE-SEM, JSM EMP-800, JEOL, Japan). Inductively coupled plasma atomic emission spectroscopy (ICP-AES) (PROFILE SPEC, Leeman, AMERICA) was adopted to investigate the degree of volatilization of K/Na/Bi at high temperature.The photoluminescence (PL) and photoluminescence excitation (PLE) spectra were recorded on a spectrofluorometer (F-7000, HITACHI, Japan) equipped with a temperature-controlled chamber (Linkam, THMS600, United Kingdom) in the temperature range from 20 to 320 °C and the wavelength range from 200 nm to 750 nm, with a 0.2 nm step size, at a scan speed of 240 nm min−1, a PMT voltage of 700 V, a response time of 0.002 s, and excitation and emission slits of 2.5 nm and 5.0 nm, respectively. The diffuse reflectance spectra of the samples were measured using a UV/Vis spectrophotometer (U-3900, HITACHI, Japan).
Before recording the PL and PLE spectra, all samples were polished to a thickness of 0.5 mm and washed with ethanol. The quantum yield and decay curves of the samples were measured using a combined steady state & time resolved fluorescence spectrometer (FLS920, Edinburgh Instruments, United Kingdom). To measure the materials' resistance to water, the powder samples were immersed in distilled water for 0, 1 h, 5 h, 10 h, 20 h and 40 h, respectively. Afterwards, the powders were dried at 100 °C prior to the PL measurements.
3. Results and discussions
3.1. Microstructure and crystal structure
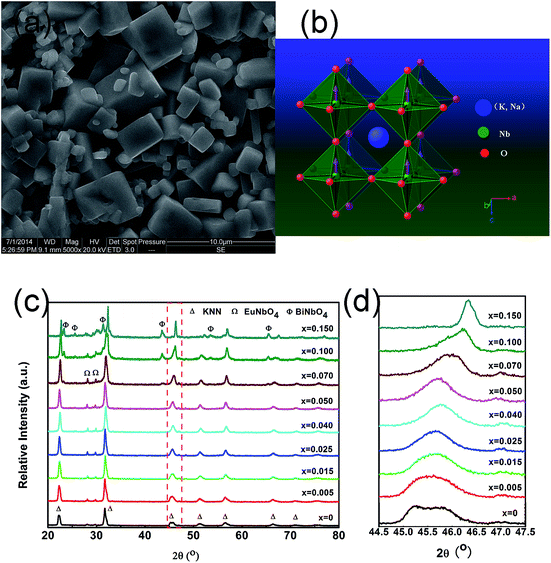
A representative SEM image of the KNEBxN (x = 0.05) sample sintered at 1150 °C is shown in Fig. 2(a). The sample exhibits a well-faceted and uniform morphology. A similar morphology was observed for the other samples (not shown here). The crystal structure of KNN at room temperature is an orthorhombic phase with Amm2 symmetry, and the perovskite-type ABO3 subcell exhibits a monoclinic symmetry with the lattice parameters am = cm > bm, as illustrated in Fig. 2(b).The XRD patterns (2θ range from 20 to 80°) obtained for the KNEBxN ceramic samples with different Bi3+ concentrations sintered at 1130–1150 °C are shown in Fig. 2(c). The samples with x ≤ 0.07 exhibit a main phase of KNN with a perovskite-type ABO3 structure and a small amount of a second phase, which was identified as the EuNbO4 phase, as reported by Fang et al.28 The samples with a comparatively higher Bi3+ concentration (x > 0.07) show additional diffraction lines, which could be attributed to the BiNbO4 phase.29 Because of the weak intensity of these impurity phase peaks, the influence of the impurity phase on the photoluminescence of KNEBxN is neglected in this paper.
These results suggest that the solubility limit of Bi3+ ions in the KNN:Eu matrix is about 0.07 mol. According to Fig. 2(d), the diffraction peaks of the (200) plane at 2θ = 45° gradually shift to higher angles with increasing Bi3+ content due to the relatively smaller ionic radius of K+ [1.64 Å, CN = 12] compared to Bi3+ [1.45 Å, CN = 12], resulting in a shrinkage of the KNN cell volumes. Based on the ionic radius and the ions' charges, we believe that Eu3+ and Bi3+ tend to occupy the A sites. In addition, a gradual broadening of the diffraction peaks was observed if the Bi3+ content exceeded 0.07 mol. This could be caused by the generation of A vacancies (VA): 3K+ → Bi3+ + VK. Similar results were observed for CaMoO4 co-doped with Bi3+ and Eu3+.30
It is known that the volatility of alkali elements in KNN-based ceramics by normal sintering is generally unavoidable, then resulting in composition deviation from the starting one.31 In this paper, considering the volatility of K/Na/Bi, we adopted the inductively coupled plasma atomic emission spectroscopy (ICP-AES) to investigate their loss degree and stoichiometric fluctuation behaviors. The measured results are shown in Fig. 3. It can be clearly seen that the volatilization of Na is the most serious, compared to the volatilization of K and Bi elements. The degree of volatilization of Bi and K elements changes slightly with increasing Bi concentrations. The K/Na mole ratio as a function of Bi concentrations is shown in the inset of Fig. 3. The apparent deviation from 1 in K/Na ratio indicates clearly that the Na elements volatilize more seriously than the K elements.32
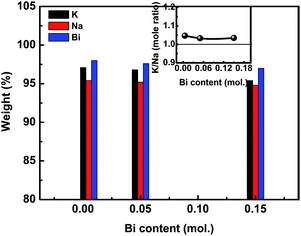 | ||
| Fig. 3 The degree of volatilization of K, Na and Bi elements in KNEBxN ceramics (x = 0.005, 0.050, 0.150), the inset is K/Na mole ratio as a function of Bi concentrations. | ||
3.2. Luminescence properties and energy transfer mechanism
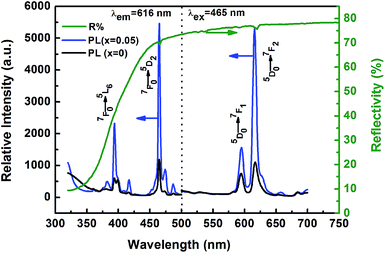
The typical photoluminescence (PL) and excitation (PLE) spectra obtained for the KNEBxN (x = 0, 0.05) samples at room temperature are shown in Fig. 4. The PL and PLE spectra of the samples with and without Bi3+ doping show a similar shape and no shift of excitation or emission peaks, indicating that the introduction of Bi3+ has no effect on the PL and PLE patterns. However, Bi3+ greatly enhances their relative intensity. In Fig. 4 (left image), the PLE spectra recoded at 616 nm exhibit two strong sharp absorptions located at 394 nm and 465 nm, respectively. These excitation peaks are attributed to the typical f–f transition of Eu3+, resulting from an excitation from the 7F0 ground state to the 5L6 and 5D2 excited states, respectively, corresponding to the 7F0 → 5L6 (394 nm) and 7F0 → 5D2 (465 nm) transition. The strongest absorption appears in the blue light region (465 nm), whose band covers the emission wavelength of all commercial blue LED chips (420–470 nm), emphasizing the material's potential for an application in white light-emitting diodes (W-LEDs).33The emission spectra excited by 465 nm light shows a strong line emission peak centered at 616 nm and a weak line emission peak at 595 nm, as shown in Fig. 4 (right). These two line emissions are ascribed to the 4f–4f transitions of Eu3+, i.e., 5D0 → 7F1 (595 nm) and 5D0 → 7F2 (616 nm). Compared to the emission intensity at 595 nm, the 5D0 → 7F2 transition at 616 nm exhibits a stronger red light-emission intensity with a full width at half maximum (FWHM) of 6 nm. Furthermore, the positions of the PLE and PL peaks observed above are in good agreement with the diffuse reflectance spectrum of the KNEBxN (x = 0.05) sample, as shown in Fig. 4. In the reflectance spectrum, two absorption bands with maxima at ∼466 nm and ∼617 nm were observed. The high-energy band corresponds to the absorption of the KNN host lattice, whereas the low-energy absorption band is attributed to the characteristic f–f transitions of Eu3+.
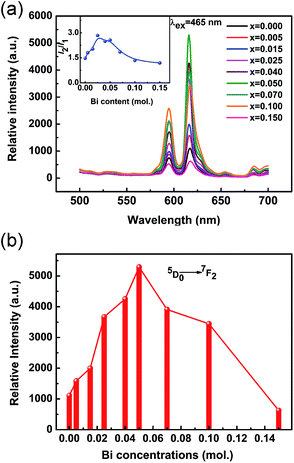
The PL spectra of KNEBxN samples with different Bi3+ content (x = 0, 0.005, 0.015, 0.025, 0.04, 0.05, 0.07, 0.10, 0.15) recorded under 465 nm blue light excitation are shown in Fig. 5. Similar to the results presented in Fig. 4, the emission spectra of all samples shows two line emission bands at 595 nm and 616 nm, assigned to the intra-4f transition from the excited 5D0 state to the 7FJ (J = 1, 2) ground state of Eu3+. The shape and position of the emission peaks do not change when the Bi3+ content is varied, whereas the emission intensity shows a strong dependence on the Bi3+ doping concentration.
According to the Judd-Ofelt theory, the 5D0 → 7F1 transition is a magnetic-dipole transition, which is nearly insensitive to local crystal field variations, while the forced electric dipole (ED) transition at 616 nm (5D0 → 7F2) is sensitive to the local environment.34 Therefore, the intensity ratio R (R = I2/I1) of the 5D0 → 7F2 (I2) and 5D0 → 7F1 (I1) transitions can be used to evaluate the local crystal field environment of the Eu3+ ion surroundings, and provide some information on the symmetry of the Eu3+ sites in the host lattice. The calculated R values are shown in the inset image in Fig. 5(a) as a function of the Bi3+ concentration. It can be seen that R increases with the Bi3+ concentration, and the highest R value of up to 3.48 was obtained for KNEBxN (x = 0.025), suggesting that the symmetry of the local crystal field of the Eu3+ ions decreased after adding Bi3+, and the red light-emission from the 5D0 → 7F2 transition is more closer to the optimal color chromaticity. These results are in agreement with the results of the structural analysis (Fig. 2).
To investigate the effect of the Bi3+ doping concentration on the emission intensity of the KNEBxN samples, the dependence of the red light-emission intensity of the 5D0 → 7F1 transition under 465 nm excitation on the Bi3+ concentration is shown in Fig. 5(b). Samples prepared with 5 mol% Bi2O3 addition show the strongest red light-emission, with an increase of almost 470% compared to the samples without Bi3+ doping. For samples prepared with a lower molar ratio of Bi2O3, the emission intensity monotonically increases with the Bi3+ concentration, whereas it greatly decreases for higher concentrations (>5 mol% Bi2O3).
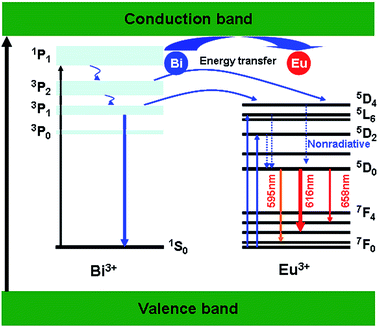
Several studies have shown that the emission peak (∼485 nm) and the excitation peak (∼380 nm) observed for Bi3+ ions correspond to the 3P1 → 1S0 and the 1S0 → 1P1 transition, respectively.21,35 Combined with the results shown in Fig. 4, we found that, in the present study, the emission band of Bi3+ corresponding to the 3P1 → 1S0 transition overlaps with the excitation bands of the Eu3+ ions, e.g., the 7F0 → 5L6 (394 nm) and the 7F0 → 5D2 (465 nm) transition. Therefore, we believe that the significant enhancement of the red light-emission with increasing Bi3+ concentration can mainly be ascribed to the effective energy transfer from Bi3+ to Eu3+.
The energy transfer mechanism between Bi3+ and Eu3+ ions can be described utilizing the energy level diagram, as shown in Fig. 6. For reasons of simplicity, only related energy states and transitions are shown. When Bi3+ ions are excited to high level states, the energy absorbed by Bi3+ can be transferred to the 5D4 level of the Eu3+ ions. At the same time, electrons on the 7F0 ground state of Eu3+ are excited to the higher 5L6 and 5D2 levels, and radiationless de-excited to 5D0 states. Subsequently, they recombine to 7FJ (J = 1, 2) lower levels. Finally, the strong red light-emission at 616 nm was observed from the 5D0 → 7F2 transition. The energy transfer process from Bi3+ to Eu3+ obviously depends on the Bi3+ doping concentration, as demonstrated by Fig. 5. When the Bi3+ concentration is higher than 0.05 mol, i.e., at a Bi3+ (sensitizer)/Eu3+ (activator) ratio higher than 1, more Bi3+ ions tend to form aggregates, as observed in other Bi3+-doped materials.36,37 These aggregates act as trapping centers and non-radiatively dissipate the absorbed energy, instead of transferring it to Eu3+, thus leading to a decrease of the emission intensity of the Eu3+ ions.
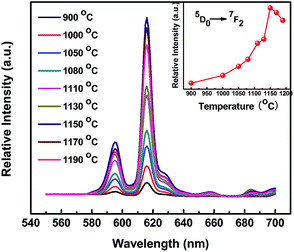
In addition to the influence of the Bi3+ doping concentration, the sintering temperature must be taken into account as another important factor affecting the grain size, crystal size or crystal nature. KNN-based ceramics are mostly fabricated within a narrow processing window in terms of the sintering temperature.5,38,39 Therefore, it is necessary to find the optimal sintering temperature. The PL spectra of KNEBxN (x = 0.05) samples fabricated at different sintering temperatures recorded under excitation at 465 nm are shown in Fig. 7. In Fig. 7, the emission spectra show patterns similar to the patterns in Fig. 5, including two narrow band emissions attributed to transitions of the Eu3+ ions, i.e., 5D0 → 7F2 (616 nm) and 5D0 → 7F1 (593 nm). The strongest emission peak is still centered at 616 nm without a visible shift.
The influence of the sintering temperature on the emission intensity of the 5D0 → 7F2 transition is shown in the inset image in Fig. 7. The PL emission intensity sharply increases as the sintering temperature increases from 900 °C to 1150 °C. The intensity decreases once the temperature exceeds 1150 °C. Generally, during the sintering process, the increase of the nucleation rate and enhanced crystallite growth with increasing temperature are very helpful for enhancing the emission intensity.40 In the present study, some results, including the increased density of the microstructure, the increased grain size and the higher R values with increasing temperature, indicate an increased degree of crystallinity. As a result, the samples prepared at low sintering temperatures (below 1150 °C) show low PL intensities due to their low degree of crystallinity. Nevertheless, at a sintering temperature of up to 1150 °C, which is close to the melting point at 1200 °C, a high loss of Na, K or Bi and a consequential compositional deviation from the intended stoichiometry (K/Na = 1) are unavoidable, as illustrated in Fig. 3, which might be the cause for the decreased PL intensity. Therefore, the optimum temperature for fabricating high-performance KNEBxN (x = 0.05) luminescent materials is 1150 °C.
Based on the results above, an optimized red light-emission intensity was obtained by properly controlling the Eu3+ content and the sintering temperature. For the KNEBxN system, the best results were found for 0.05 mol of Bi3+ and a sintering temperature of 1150 °C. To quantitatively evaluate the red light-emission intensity of the optimized sample composition, the absolute PL quantum yield (QY) (defined as the ratio of emitted photons to absorbed photons) was determined at room temperature using a combined steady state & time resolved fluorescence spectrometer (FLS920), and the results are shown in Fig. 8. The sample doped with 0.05 mol of Bi3+ and sintered at 1150 °C shows a relatively high QY value of 0.34, which is comparable or superior to the recently reported QY values of RE-doped ferroelectric materials or some phosphors, such as CaTiO3:Pr, BZCT:Pr, KNN:Pr, Y2O2S/Y2O3:Eu3+.11,39,41–43
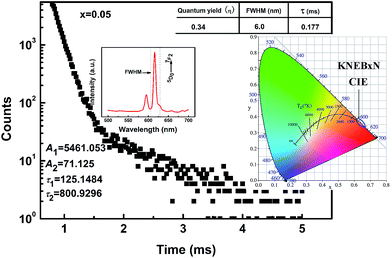 | ||
| Fig. 8 The decay curve of the KNEBxN (x = 0.05), and the insets are the quantum yield and CIE chromaticity diagram. | ||
The chromaticity coordinates (CIE) of the KNEBxN (x = 0, 0.005, 0.015, 0.025, 0.04, 0.05, 0.07, 0.10, 0.15) samples for 465 nm excitation were calculated based on the emission spectra, and the results are shown on the inset image in Fig. 8 and compared in Table 1. The chromaticity coordinates only slightly change when the Eu3+ content is varied, indicating that adding Bi3+ does only slightly affect the emission color. The CIE chromaticity coordinates obtained for the KNEBxN (x = 0.05) sample are (x = 0.6476, y = 0.352), which is much closer to the National Television Standard Committee (NTSC) coordinates for red color (x = 0.67, y = 0.33), and located in the red region.
| Samples | λex (nm) | CIE chromaticity coordinate | QY (η) | 5D0 → 7F2 relative intensity | |
|---|---|---|---|---|---|
| x | y | ||||
| (K0.5Na0.5)0.95Eu0.05NbO3 | 465 | 0.6348 | 0.3648 | — | 1.00 |
| (K0.5Na0.5)0.945Eu0.05Bi0.005NbO3 | 465 | 0.6345 | 0.3651 | — | 1.43 |
| (K0.5Na0.5)0.935Eu0.05Bi0.015NbO3 | 465 | 0.6378 | 0.3618 | — | 1.80 |
| (K0.5Na0.5)0.925Eu0.05Bi0.025NbO3 | 465 | 0.6463 | 0.3534 | — | 3.31 |
| (K0.5Na0.5)0.95−xEu0.05Bi0.04NbO3 | 465 | 0.6461 | 0.3535 | — | 3.83 |
| (K0.5Na0.5)0.95−xEu0.05Bi0.05NbO3 | 465 | 0.6476 | 0.3520 | 0.34 | 4.77 |
| (K0.5Na0.5)0.95−xEu0.05Bi0.07NbO3 | 465 | 0.6270 | 0.3726 | — | 3.52 |
| (K0.5Na0.5)0.95−xEu0.05Bi0.10NbO3 | 465 | 0.6429 | 0.3567 | — | 3.10 |
| (K0.5Na0.5)0.95−xEu0.05Bi0.15NbO3 | 465 | 0.6380 | 0.3616 | — | 0.56 |
| Y2O3S:Eu3+ (ref. 40) | 394 | — | 0.35 | — | |
| Y2O3:Eu3+ (ref. 41) | 465 | — | <1% | — | |
In Fig. 8, we also measured the decay curve for the 5D0 → 7F2 transition of the KNEBxN (x = 0.05) sample and determined the PL decay time, based on a double exponential fit, as follows:
I(t) = I0 + A1![[thin space (1/6-em)]](https://www.rsc.org/images/entities/char_2009.gif) exp(−t/τ1) + A2 exp(−t/τ1) + A2![[thin space (1/6-em)]](https://www.rsc.org/images/entities/char_2009.gif) exp(−t/τ2) exp(−t/τ2)
| (1) |
 | (2) |
The lifetimes calculated for the 5D0 → 7F2 transition in the KNEBxN (x = 0.05) sample are τ1 = 0.125 ms and τ2 = 0.801 ms, respectively. Thus, the average lifetime (t) of the 5D0 → 7F2 transition is about 0.177 ms. Compared to the average lifetime of the 5D0 → 7F1 (593 nm) transition (t = 0.050 ms), the long lifetime of the 5D0 → 7F2 transition would result in a high energy transfer efficiency, with strong red light-emission at 616 nm.
3.3. Thermal stability and water resistance behavior
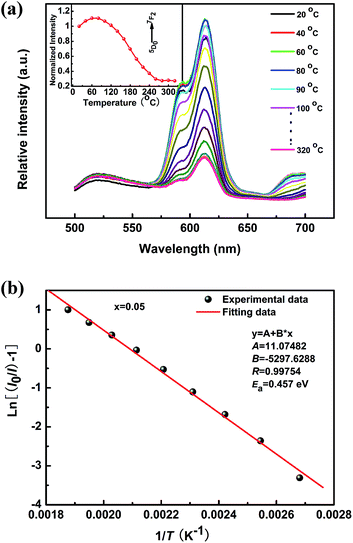
For the practical application of high-power W-LEDs, the luminescent materials are required to withstand temperatures of up to 150 °C resulting from the very high excitation energy of LED chips.44 Therefore, these materials need to exhibit a high thermal stability. Fig. 9 shows the temperature dependence of the PL emission intensity for the KNEBxN (x = 0.05) sample in the temperature range from room temperature to 320 °C. The temperature dependence of the integrated emission intensity normalized to the integral at 20 °C is shown in the inset imagine in Fig. 9. Under 465 nm excitation, the red-light emission intensity at 616 nm firstly increases and reaches its maximum at 100 °C. At 150 °C, the intensity retained about 83% of the initial intensity at 20 °C. When the temperature was further increased to values above 160 °C, the emission intensity became dramatically quenched. In summary, the KNEBxN (x = 0.05) sample has a good thermal stability in the temperature range from 20 °C to 160 °C, and is therefore superior to the present commercial red phosphor, e.g. YAG:Ce3+, SrS:Eu2+, or Y2O3:Eu3+.40,45,46The temperature dependence of the emission intensity was obtained using the Arrhenius equation:47
 | (3) |
In some applications, the luminescent material or the entire device could be exposed to different environmental conditions, for example, an aqueous environment. It has been reported that the luminescence intensity of some alkali earth sulfide-, oxysulfide- and aluminate-based (e.g. ZnS:Mn2+ or SrAl2O4:Eu2+) red phosphors rapidly decreases after immersion in water due to hydrolysis reactions. As a result, the application potential of these materials is rather limited.48,49 Thus, a material suitable for practical application not only needs to show a high luminescence efficiency and thermal stability, but also a superior resistance to water. For this purpose, the water resistance behavior of the KNEBxN (x = 0.05) sample was investigated.
The PLE and PL spectra of the KNEBxN (x = 0.05) sample recorded for different immersion times (0 h, 1 h, 5 h, 10 h, 20 h and 40 h) are shown in Fig. 10. The emission spectra for an excitation at 616 nm and the excited intensity at 465 nm show only a very slight decrease in intensity with increasing immersion time (inset image in Fig. 10), retaining approx. 94.3% of the initial intensities after 40 h of immersion. These results indicate that KNN materials co-doped with Bi3+ and Eu3+ are suitable for an application in an aqueous environment due to their excellent resistance to water.
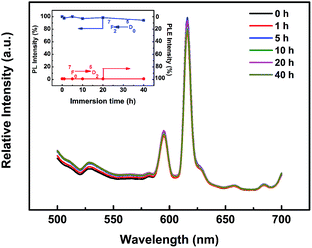 | ||
| Fig. 10 PL spectra of KNEBxN (x = 0.05) sample with various immersion time, the inset is immersion time (h) dependence of relative PL and PLE intensity from 5D0 → 7F2 transition. | ||
4. Conclusions
In summary, a novel red light-emitting material based on KNN co-doped with Bi3+ and Eu3+ was fabricated by the conventional solid state reaction method. The influence of the doping concentrations, the sintering temperature and the water immersion time on the photoluminescence properties were systematically investigated. The results showed that the PL spectra of the samples exhibited strong narrow red light-emissions at 616 nm, originating from the 5D0 → 7F2 (616 nm) transition of Eu3+, under excitation at 465 nm, which makes the material compatible with all commercial blue LED chips. The emission intensity and quantum yield can be effectively enhanced by adding Bi3+ ions (as sensitizer) as an alternative to increasing the Eu3+ concentration, and reach a maximum at a Bi3+ doping content of 0.05 mol. The optimal composition with x = 0.05 resulted in a high quantum yield of η = 0.34, a good thermal stability and superior water resistance properties. These experimental results indicate that the novel red light-emitting material based on a (K0.5Na0.5)NbO3 matrix co-doped with Bi3+ and Eu3+ ions, combined with its already admirable intrinsic piezoelectric properties, is a promising candidate for a future application in novel multifunctional devices.Acknowledgements
This work was supported by the Natural Science Foundation of China (no. 51462028 and 51072136), the Natural Science Foundation of Inner Mongolia (no. 2014MS0522 and 2014BS0202) and the Innovation Fund Project of Inner Mongolia University of Science and Technology (no. 2012NCL006 and 2012NCL002).References
- W. F. Liu and X. B. Ren, Phys. Rev. Lett., 2009, 103, 257602 CrossRef.
- Z. H. Luo, J. Glaum, T. Grranzow, W. Jo, R. Dittmer, M. Hoffman and J. Rödel, J. Am. Ceram. Soc., 2011, 94(2), 529 CrossRef CAS PubMed.
- Y. Saito, H. Takao, T. Tani, T. Nonoyama, K. Takatori, T. Homma, T. Nagaya and M. Nakamura, Nature, 2004, 432, 84 CrossRef CAS PubMed.
- K. Uchino, Piezoelectric Actuators and Ultrasonic Motors, Kluwer Academic Publishers, Boston, 1997 Search PubMed.
- J. F. Li, K. Wang, F. Y. Zhu, L. Q. Cheng and F. Z. Yao, J. Am. Ceram. Soc., 2013, 96(12), 3677 CrossRef CAS PubMed.
- Y. S. Sung, S. Baik, J. H. Lee, G. H. Ryu, D. Do, T. K. Song, M. H. Kim and W. J. Kim, Appl. Phys. Lett., 2012, 101, 012902 CrossRef PubMed.
- R. Z. Zuo, J. Fu and D. Y. Lv, J. Am. Ceram. Soc., 2009, 92(1), 283 CrossRef CAS PubMed.
- S. Pin, F. Piccinelli, K. U. Kumar, S. Enzo, P. Ghigna, C. Cannas, A. Musinu, G. Mariotto, M. Bettinelli and A. Speghini, J. Solid State Chem., 2012, 196, 1 CrossRef CAS PubMed.
- X. Wu, K. W. Kwok and F. L. Li, J. Alloys Compd., 2013, 580, 88 CrossRef CAS PubMed.
- R. S. Chaliha, K. Annapurna, A. Tarafder, V. S. Tiwari, P. K. Gupta and B. Karmakar, Opt. Mater., 2010, 32, 1202 CrossRef CAS PubMed.
- H. Q. Sun, D. F. Peng, X. S. Wang, M. M. Tang, Q. W. Zhang and X. Yao, J. Appl. Phys., 2012, 111, 046102 CrossRef PubMed.
- X. S. Wang, C. N. Xu, H. Yamada, K. Nishikubo and X. G. Zheng, Adv. Mater., 2005, 17, 1254 CrossRef CAS.
- H. Ryu, B. K. Singh, K. S. Bartwal, M. G. Brik and I. V. Kityk, Acta Mater., 2008, 56, 358 CrossRef CAS PubMed.
- J. H. Hao, Y. Zhang and X. H. Wei, Angew. Chem., 2011, 123, 7008 CrossRef.
- H. Q. Sun, D. F. Peng, X. S. Wang, M. M. Tang, Q. W. Zhang and X. Yao, J. Appl. Phys., 2011, 110, 016102 CrossRef PubMed.
- R. López-Juárez, R. Castañeda-Guzmán, F. Rubio-Marcos, M. E. Villafuerte-Castrejón, E. Barrera-Calva and F. González, Dalton Trans., 2013, 42, 6879 RSC.
- Y. B. Wei, Z. Wu, Y. M. Jia, J. Wu, Y. C. Shen and H. S. Luo, Appl. Phys. Lett., 2014, 105, 042902 CrossRef PubMed.
- Q. L. Dai, H. W. Song, M. Y. Wang, X. Bai, B. Dong, R. F. Qin, X. S. Qu and H. Zhang, J. Phys. Chem. C, 2008, 112(49), 19399 CAS.
- T. W. Kuo, W. R. Liu and T. M. Chen, Opt. Express, 2010, 18(8), 8187 CrossRef CAS PubMed.
- N. Kimura, K. Sakuma, S. Hirafune, K. Asano, N. Hirosaki and R. J. Xie, Appl. Phys. Lett., 2007, 90, 051109 CrossRef PubMed.
- W. R. Liu, C. C. Lin, Y. C. Chiu, Y. T. Yeh, S. M. Jang and R. S. Liu, Opt. Express, 2010, 18(3), 2946 CrossRef CAS PubMed.
- P. Pust, V. Weiler, C. Hecht, A. Tücks, A. S. Wochnik, A. K. Henß, D. Wiechert, C. Scheu, P. J. Schmidt and W. Schnick, Nat. Mater., 2014, 13, 891 CrossRef CAS PubMed.
- H. D. Xie, J. Lu, Y. Guan, Y. L. Huang, D. L. Wei and H. J. Seo, Inorg. Chem., 2014, 53(2), 827 CrossRef CAS PubMed.
- S. K. Mahesh, P. P. Rao, M. Thomas, T. L. Francis and P. Koshy, Inorg. Chem., 2013, 52(23), 13304 CrossRef CAS PubMed.
- L. L. Wang, Q. L. Wang, X. Y. Xu, J. Z. Li, L. B. Gao, W. K. Kang, J. S. Shi and J. Wang, J. Mater. Chem. C, 2013, 1, 8033 RSC.
- X. Min, Z. H. Huang, M. H. Fang, Y. G. Liu, C. Tang and X. W. Wu, Inorg. Chem., 2014, 53, 6060 CrossRef CAS PubMed.
- R. K. Datta, J. Electrochem. Soc., 1967, 114(10), 1057 CrossRef CAS PubMed.
- T. H. Fang, Y. J. Hsiao, Y. S. Chang and Y. H. Chang, Mater. Chem. Phys., 2006, 100, 418 CrossRef CAS PubMed.
- A. F. Tian, W. Ren, L. Y. Wang, H. L. Du and X. Yao, J. Mater. Sci. Eng. B, 2013, 178, 1240 CrossRef CAS PubMed.
- S. X. Yan, J. H. Zhang, X. Zhang, S. Z. Lu, X. G. Ren, Z. G. Nie and X. J. Wang, J. Phys. Chem., 2007, 111, 13256 CAS.
- J. F. Li, K. Wang, F. Y. Zhu, L. Q. Cheng and F. Z. Yao, J. Am. Ceram. Soc., 2013, 96(12), 3677 CrossRef CAS PubMed.
- Y. H. Zhen and J. F. Li, J. Am. Ceram. Soc., 2006, 89(12), 3669 CrossRef CAS PubMed.
- S. Nakamura and G. Fasol, The blue laser diode: GaN based light emitters and lasers, Springer, Berlin, 1997 Search PubMed.
- M. J. Weber, Phys. Rev., 1967, 157(2), 262 CrossRef CAS.
- P. Boutinaud, Inorg. Chem., 2013, 52, 6028 CrossRef CAS PubMed.
- H. N. Luitel, T. Watari, R. Chand, T. Torikai and M. Yada, Opt. Mater., 2012, 34, 1375 CrossRef CAS PubMed.
- W. J. Park, M. K. Jung, S. J. Im and D. H. Yoon, Colloids Surf., A, 2008, 313–314, 373 CrossRef PubMed.
- W. N. Wang, W. Widiyastuti, T. Ogi, I. W. Lenggoro and K. Okuyama, Chem. Mater., 2007, 19, 1723 CrossRef CAS.
- Q. W. Zhang, H. Q. Sun, X. S. Wang, Y. Zhang and X. Li, J. Eur. Ceram. Soc., 2014, 34, 1439 CrossRef CAS PubMed.
- X. Y. Yang, J. Liu, H. Yang, X. B. Yu, Y. Z. Guo, Y. Q. Zhou and J. Y. Liu, J. Mater. Chem., 2009, 19, 3771 RSC.
- P. T. Diallo, P. Boutinaud, R. Mahiou and J. C. Cousseins, Phys. Status Solidi A, 1997, 160, 255 CrossRef CAS.
- D. F. Peng, H. Q. Sun, X. S. Wang, J. C. Zhang, M. M. Tang and X. Yao, J. Mater. Sci. Eng. B, 2011, 176, 1513 CrossRef CAS PubMed.
- X. B. Qiao, Y. Cheng, L. Qin, C. X. Qin, P. Q. Cai, S. I. Kim and H. J. Seo, J. Alloys Compd., 2014, 617, 946 CrossRef CAS PubMed.
- C. Feldman, T. Jüstel, C. R. Ronda and P. J. Schmidt, Adv. Funct. Mater., 2003, 13, 51 Search PubMed.
- T. W. Kuo, C. H. Huang and T. M. Chen, Opt. Express, 2010, 18(102), A231 CrossRef CAS PubMed.
- Z. Sun, G. X. Cao, Q. H. Zhang, Y. G. Li and H. Z. Wang, Mater. Chem. Phys., 2012, 132, 937 CrossRef CAS PubMed.
- S. Murakami, M. Herren, D. Rau and M. Morita, Inorg. Chim. Acta, 2000, 300–342, 1014 CrossRef.
- L. Zhang, H. Yamada, Y. Imai and C. N. Xu, J. Electrochem. Soc., 2008, 155, J63 CrossRef CAS PubMed.
- Y. Imai, R. Momoda, Y. Adachi, K. Nishikubo, Y. Kaida, H. Yamada and C. N. Xu, J. Electrochem. Soc., 2007, 154, J77 CrossRef CAS PubMed.
| This journal is © The Royal Society of Chemistry 2015 |


