Complete recovery of Eu from BaMgAl10O17:Eu2+ by alkaline fusion and its mechanism
Shengen Zhang*a,
Hu Liua,
De'an Pana,
Jianjun Tiana,
Yifan Liua and
Alex A. Volinskyb
aInstitute for Advanced Materials, School of Materials Science and Engineering, University of Science and Technology Beijing, Beijing 100083, P. R. China
bDepartment of Mechanical Engineering, University of South Florida, Tampa, FL 33620, USA
First published on 19th November 2014
Abstract
An environmentally friendly and efficient process for recycling waste phosphors has been developed. The alkaline fusion process is used for recycling Eu from BaMgAl10O17:Eu2+ (BMA) completely. The comprehensive BMA disintegration via alkaline fusion is discussed. Relationships between the alkaline fusion temperature and various properties of the compounds have been examined by various techniques (DSC-TG, XRD, SEM and XPS) to elucidate their roles in BMA disintegration in the alkaline fusion process. X-ray diffraction analysis provides details of the phase change. Based on X-ray photoelectron spectroscopy, a scientific hypothesis of crystal structure disintegration is presented. Sodium ions would substitute the europium and barium ions in the mirror plane and magnesium ions in the spinel block successively, which results in more oxygen vacancies and interstitial sodium ions appearing. The unit cell (P63/mmc (194)) would break from the mirror plane, then changes into BaAl2O4 (P6322 (182)), and be decomposed into NaAlO2, and barium and europium ions combine with free OH− and CO2 to form BaCO3, Eu2O3 and H2O. In the end the Eu2O3 can be recycled easily by acidolysis, oxalic acid precipitation and ignition. The mechanism provides a fundamental basis for recycling REEs from waste phosphors.
1. Introduction
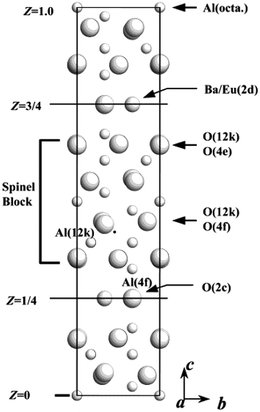
The recycling of rare earths is of importance for helping to reduce environmental pollution and maintain supplies of these critical elements.1 Eu2+ doped barium magnesium aluminate, BaMgAl10O17:Eu2+ (BMA) is an excellent matrix for phosphors used for fluorescent lamps, plasma display panels and Hg-free lamps, because of its chemical stability and efficient blue emission phosphor.2–4 The rare earth elements (REEs), terbium, neodymium, dysprosium, yttrium, europium and indium have the greatest short-term “criticality”. They are important to clean energy and run the risk of supply, based on the medium-term criticality matrix available from the Critical Raw Materials for the European Union report and the U.S. Department of Energy.5,6 Many researchers have focused on REE recycling from waste lamps.7–9 However, while waste lamps have been collected in many countries for many years, the commercial recovery of REEs from waste phosphors has rarely been considered. Recently, a commercial recovery of rare earths from waste phosphors developed by Solvay-Rhodia operated in France in Saint Fons (near Lyon) and in La Rochelle. Finally, the purified rare-earth oxides are processed in La Rochelle to new lamp phosphors, mainly Y2O3:Eu3+ and LaPO4:Ce3+, Tb3+.10 And OSRAM (owned by Siemens) developed a process to recover REEs from used phosphors, that consists of dissolution of the phosphor mixture in acids, followed by precipitation of the REEs as oxalates, and finally transformation of the oxalates into oxides.11,12 Technically, Eu in BMA is difficult to recycle due to its stable aluminate crystal structure.The BMA structure is derived from that of β-alumina (NaAl11O17), which was first discovered by Rankin and Merwin.13,14 The structure has a space group of P63/mmc and can be described as consisting of oxygen close-packed spinel blocks of the [Al11O16]+1 composition, separated by mirror planes of the [NaO]−1 composition (Fig. 1).15–18 Sodium occupies the Beevers–Ross site in the mirror plane.19 Aluminum ions occupy both octahedral and tetrahedral sites in the spinel block. In forming BAM, sodium is replaced by barium and the same number of aluminum ions is replaced by magnesium in order to keep the unit cell charge neutral. Thus the chemical formula of the spinel blocks becomes [MgAl10O16] and the mirror plane changes to [BaO], while both are charge neutral. Magnesium may substitute any of the four aluminum sites in the crystal.20 Alkali fusion of waste phosphor as a pretreatment process makes it possible to increase the leaching rate.21 Furthermore, an understanding of the alkali fusion mechanisms of BMA is still lacking, and there have been no reports from the structure viewpoint.
Therefore, the main objective of this study was to probe the specific decomposition mechanisms of the BMA crystal structure by alkali fusion to elucidate the condition and process. A series of BMA powders were performed at 300–450 °C by alkali fusion to discuss the condition. The transformation of the crystalline structure was discussed in the alkaline fusion process by thermal and XRD analyses. In addition, the chemical states of the samples were identified by using XPS analyses during alkali fusion.
2. Experimental
In this study, BMA, Ba1−xEuxMgAl16O27 (0.2 < x < 0.4), powders with the average particle size of 2–4 μm were obtained from the Dalian Luminglight (China). BMA powders were mixed with sodium hydroxide, according to the 1![[thin space (1/6-em)]](https://www.rsc.org/images/entities/char_2009.gif) :
:![[thin space (1/6-em)]](https://www.rsc.org/images/entities/char_2009.gif) 1 NaOH–BMA mass ratio by the ball milling. Differential scanning calorimetry (DSC) and thermogravimetric (TG) analysis were carried out using the NETZSCH STA 409C/CD thermal analyzer. The reference material was α-Al2O3 powder, and the parent glass powder samples (<74 μm) were heated from 23 °C to 700 °C at the heating rates 10 °C min−1. The mixtures were then placed into 200 ml iron crucibles. Fusion was performed in a furnace at 150–375 °C for 2 h separately, and quenching processing was needed to keeping the crystal structure in the condition. The main chemical reaction during the alkali fusion process is:21
1 NaOH–BMA mass ratio by the ball milling. Differential scanning calorimetry (DSC) and thermogravimetric (TG) analysis were carried out using the NETZSCH STA 409C/CD thermal analyzer. The reference material was α-Al2O3 powder, and the parent glass powder samples (<74 μm) were heated from 23 °C to 700 °C at the heating rates 10 °C min−1. The mixtures were then placed into 200 ml iron crucibles. Fusion was performed in a furnace at 150–375 °C for 2 h separately, and quenching processing was needed to keeping the crystal structure in the condition. The main chemical reaction during the alkali fusion process is:21| BMA + NaOH + CO2 → NaAlO2 + MgO + BaCO3 + Eu2O3 + H2O | (1) |
In order to remove the NaOH and NaAlO2, the fusion product was cleaned several times under stirring at 200 rpm for 20 min with deionized water at 60 °C. All obtained intermediate and final products were collected and dry roasted at 120 °C, and then ground to produce particle size smaller than 52 μm (270 mesh). X-ray diffraction (XRD) analysis was performed using Philips APD-10 X-ray diffractometer with Cu Kα radiation, 40 kV voltage and 150 mA current at 10° min−1 scanning rate, from 10° to 100° 2Theta angle range. The morphology and the mean particle size were observed in the scanning electron microscope (SEM, JSM-6510A, Japan). The XPS spectra were recorded using an ESCALAB 250Xi spectrometer from Thermo Scientific Ltd with monochromatized Al Kα source operated at 200 W. The measurements were done on fresh surfaces. During measurements the pressure in the main chamber was maintained below 10−9 mbar. All spectra were calibrated against the Au 4f7/2 signal from an Au foil (84.0 eV) and a pass energy/step of 30 eV/0.1 eV for narrow scans.
3. Results and discussions
3.1 Thermal analysis
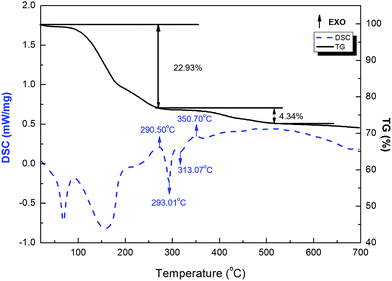
Fig. 2 is a typical DSC-TG pattern of the mixture. From the DSC curve, there are two endothermic peak at 60 °C and 150 °C, because of water evaporation, and part of water is evaporating at 150 °C due to high moisture-absorb of sodium hydroxide. The total weight loss between RT and 290.5 °C is measured to be about 22.93%. However, there is an exothermic peak at 290.5 °C, the reaction have begun. Next, the DSC curve shows one endothermic peak with a maximum at 293.01 °C, but there is less change from TG curve, it concludes that the internal structure of BAM is changing. While there is one endothermic peak at 313.07 °C, because of ball milling, NaOH begins to melt below the melting point of NaOH (318.4 °C). According to the TG curve, the weight loss between 290.5 °C and 500 °C is measured to be about 4.34%. The DSC curve shows one exothermic peak at 350.70 °C, then subsequently, DSC curve become more smooth, and TG curve become more smooth when the temperature is higher than 500 °C. The temperature range of the endothermic peak in the DSC curve fits well with that of the weight loss in the TG curve. Consequently, the reaction is started at 200 °C and finished at about 500 °C.3.2 Phase and microstructure analysis
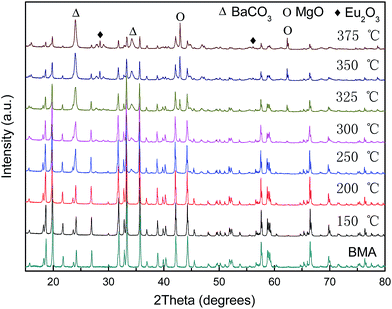
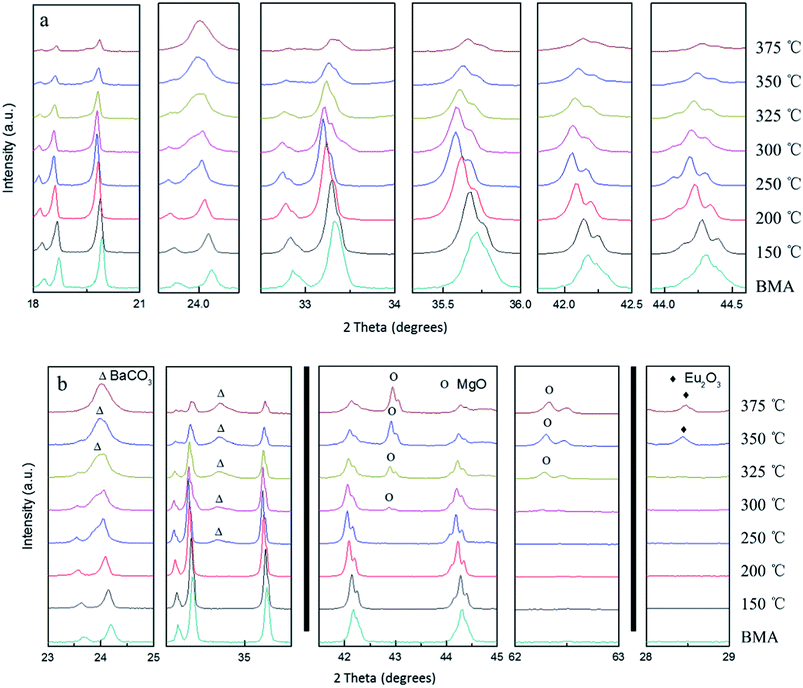
Fig. 3 shows X-ray diffractograms of the alkaline fusion BMA products at different temperatures (fusion condition: the mixed ratio of NaOH to BMA is 1). When the temperature increases from 150 to 375 °C, the BMA (JCPDS 50-0513) diffraction peak intensity is gradually reduced, and the main crystal phase was becoming MgO (JCPDS 45-0946), BaCO3 (JCPDS 41-0373) and Eu2O3 (JCPDS 34-0392).However, from the details of the X-ray diffractograms at different temperatures as Fig. 4, when the temperature increases from 150 to 250 °C, the BMA diffraction peak has the splitting and shifting to small angle (Fig. 4a). The growth of BMA crystalline size and phase transformation are observed. Then, the BaCO3, MgO and Eu2O3 diffraction peaks starts to appear at 250 °C, 300 °C and 350 °C, and the BMA diffraction intensity of peaks significantly reduced (Fig. 4b).
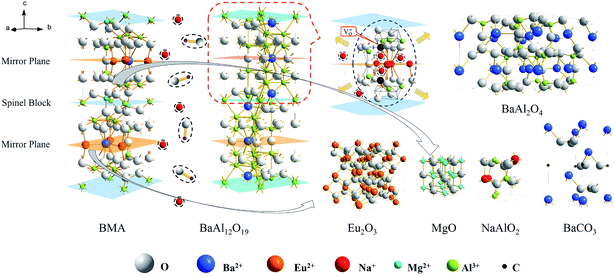
The phases analysed from the Fig. 4 are listed in the Table 1. According to the results of XRD analysis, it is concluded that the transformation of the crystalline structure in the alkaline fusion process is showed in Fig. 5. It showed that, Firstly, Eu2+ in BMA (P63/mmc (194)) moved from the crystal lattice reacts with oxygen in medium and form Eu2O3. The Mg2+ is moved as well, and the main phase changes into BaAl12O19 (P63/mmc (194)), then, Ba0.83Al11O17.33 (P63/mmc (194)), shortly afterwards, BaAl2O4 (P6322 (182)) as the reaction progress. Finally, it is decomposed into NaAlO2 and BaCO3. The details of phases' crystalline structures is obtained from the Table 2, it shows that the BMA is decomposed step by step in the alkaline fusion process.
| T/°C | Phase |
|---|---|
| RT | BaMgAl10O17:Eu2+ |
| 150 | BaMgAl10O17:Eu2+, Ba0.9Eu0.1MgAl16O27 |
| 200 | BaMgAl10O17:Eu2+, Ba0.9Eu0.1MgAl16O27, BaAl12O19 |
| 250 | Ba0.9Eu0.1MgAl16O27, BaAl12O19, BaCO3 |
| 300 | Ba0.9Eu0.1MgAl16O27, BaAl12O19, Ba0.83Al11O17.33, BaCO3, MgO, (NaAlO2) |
| 325 | Ba0.9Eu0.1MgAl16O27, BaAl12O19, Ba0.83Al11O17.33, Ba2Al10O17, BaAl2O4, BaCO3, MgO, Eu2O3, (NaAlO2) |
| 350 | Ba0.9Eu0.1MgAl16O27, BaAl12O19, Ba0.83Al11O17.33, Ba2Al10O17, BaAl2O4, BaCO3, MgO, Eu2O3, (NaAlO2) |
| 375 | Ba2Al10O17, BaAl2O4, BaCO3, MgO, Eu2O3, BaAl2O4, (NaAlO2) |
| Phases | Space group | a | b | c | α | β | γ | |
|---|---|---|---|---|---|---|---|---|
| BaMgAl10O17:Eu2+ | 26-0163 | P63/mmc (194) | 5.625 | 5.625 | 22.625 | 90 | 90 | 120 |
| Ba0.9Eu0.1MgAl16O27 | 50-0513 | 5.660 | 5.660 | 22.660 | 90 | 90 | 120 | |
| BaAl12O19 | 26-0135 | 5.607 | 5.607 | 22.900 | 90 | 90 | 120 | |
| Ba0.83Al11O17.33 | 48-1819 | 5.587 | 5.587 | 22.721 | 90 | 90 | 120 | |
| BaAl2O4 | 17-0306 | P6322 (182) | 10.447 | 10.447 | 8.794 | 90 | 90 | 120 |
| NaAlO2 | 33-1200 | Pna21 (33) | 5.387 | 7.033 | 5.218 | 90 | 90 | 90 |
The productions were dissolved completely in 2 mol L−1 HCl after alkaline fusion at 375 °C for 2 h, when solid to liquid ratio was 1![[thin space (1/6-em)]](https://www.rsc.org/images/entities/char_2009.gif) :
:![[thin space (1/6-em)]](https://www.rsc.org/images/entities/char_2009.gif) 5, 60 °C, 2 hours. The Eu2O3 would be obtained by oxalic acid precipitation and calcination. The results show that the yield is more than 99% and the purity more than 90% under the optimum conditions. And it would be finally purified to the purity of more than 99.5% by the extraction.
5, 60 °C, 2 hours. The Eu2O3 would be obtained by oxalic acid precipitation and calcination. The results show that the yield is more than 99% and the purity more than 90% under the optimum conditions. And it would be finally purified to the purity of more than 99.5% by the extraction.
Fig. 6 shows SEM images of the BMA and alkaline fusion products at different temperature. The raw BMA material is in the form of irregular particles with smooth surface and 3 μm size in Fig. 6a. However, there are many parallel gullies on the surface due to hot alkaline corrosion at 300 °C as seen in Fig. 6b. The particles break down into smaller rod-like grains with the 1–2 μm size, but they are severely agglomerated 350 °C in Fig. 6c. In the end, the particles separate into tiny grains seen in Fig. 6d.
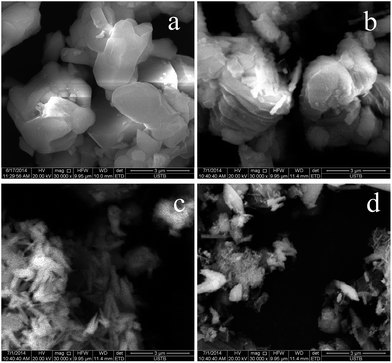 | ||
| Fig. 6 SEM images of BMA and alkaline fusion products at different temperatures: (a) BMA before alkaline fusion; (b) 300 °C; (c) 325 °C; (d) 350 °C. | ||
3.3 Reaction mechanism and the corresponding model
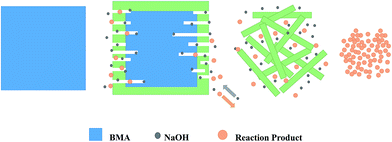
From the SEM results obtained at the macro particle scale, it is reasonable to conclude that the alkaline fusion process can be described by the shrinking core model.15 Fig. 7 illustrates the mechanism of the alkaline fusion reaction. It is hypothesized that (1) NaOH melted to liquid ions at about 300 °C. (2) The reaction occurred on the surface of the particles, and the products diffuse into the surrounding liquid phase. (3) Then the surface becomes rougher with small pores and cracks, particularly for the particles with a high conversion rate. The BMA particle break into plate-like and rod-like particle successively. (4) The reaction proceeds until complete decomposition of the particles, in the end the smaller grains aggregate in the liquid phase.3.4 X-ray photoelectron spectroscopy analysis
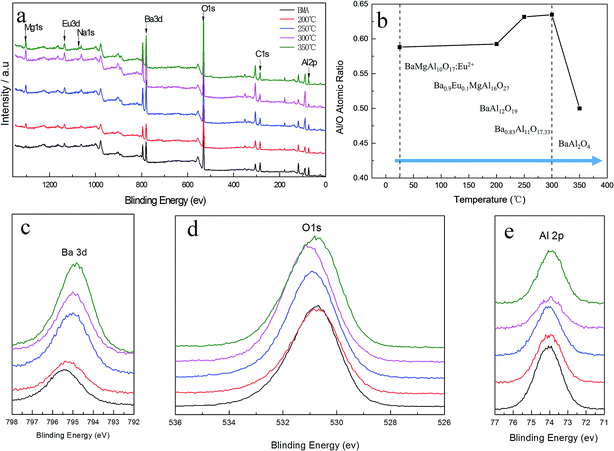
The elemental composition in the volume of BMA alkaline fusion was studied through XPS measurements. Fig. 8a show typical survey spectra of untreated BMA and treaded by fusion product under 200–350 °C. It is observed that besides the C 1s peak visible at about 284.78 eV, peaks corresponding to Mg 1s, Eu 3d, Na 1s, Ba 3d, O 1s and Al 2p core levels are identified in XPS spectra. The aluminum to oxygen atom ratio was showed in Fig. 8b. The aluminum to oxygen atom ratio increased as the temperature increased at RT to 300 °C. However the aluminum to oxygen atom ratio decreased at 350 °C, it shows variation trend of the aluminum to oxygen atom ratio according to phase transformation in the alkaline fusion process showed in Fig. 5.The typical XPS of Ba 3d, O 1s and Al 2p spectra are shown in Fig. 8c–e. It is observed that the characteristic Ba 3d, O 1s and Al 2p peak in BMA was present at a binding energy of 795.53 eV, 530.98 eV and 74.30 eV. The Ba 3d, and Al 2p bands all show shifts toward lower binding energies with the increase of temperature. The O 1s band shifts toward higher binding energy from RT to 300 °C, but shifts toward lower binding energy at 350 °C. And the typical XPS Na 1s, Na 2s and Na 2p spectra of fusion product at 300 °C are shown in the Fig. 9 which is not detected by XRD and the atomic percentage of Na is 1.43%. It is interpreted that Na is a doping induced change in the chemical potential.
In conclusion, at the micro level, Fig. 10 illustrates the basic mechanism of the unit cell formation, as the temperature increased, initially the sodium ions would substitute the europium ions sites having an active chemical property in the mirror plane, where sodium ions occupy the mirror plane of β-alumina (NaAl11O17). This results in more defects around the sodium ions sites, caused by the oxygen vacancies and interstitial sodium ions due to the different valence states of europium and sodium ions. Because of interstitial sodium ions, lattice constant of the mirror plane is increased and lattice is expanded. And oxygen vacancies, sharing in the sites of vertex between in alumina tetrahedral and polyhedral, would break the spinel block. Defects generally provide an extensive perturbation of the surrounding lattice in the mirror plane and increase the possibility of the ion diffusion. However, in order to keep the unit cell charge neutral, the sodium ions would keep diffusing into the spinel blocks. The sodium ions would substitute the magnesium ions sites in the spinel block. Thereafter, the unit cell would be break from mirror plane, the main phase changes into BaAl2O4 (P6322 (182)) from Ba0.83Al11O17.33 (P63/mmc (194)) showed in the XRD analysis as the reaction progress. And the BaAl2O4 would be decomposed into NaAlO2 by alkaline fusion, the Barium and europium ions combine with free OH− and CO2 into BaCO3, Eu2O3 and H2O.
4. Conclusions
The results presented in this paper show that Eu can be recovered by alkaline fusion completely. The comprehensive BaMgAl10O17:Eu2+ disintegration via alkaline fusion has been examined by various techniques to elucidate their roles in the expected BMA transformations. The yield of Eu2O3 is more than 99% and the purity more than 90% by alkaline fusion at 375 °C for 2 h. X-ray diffraction analysis indicates that the transition of BMA in the alkaline fusion process, from BMA to Ba0.9Eu0.1MgAl16O27, BaAl12O19, Ba0.83Al11O17.33, Ba2Al10O17 and BaAl2O4 and the final product. Through X-ray photoelectron spectroscopy, a scientific hypothesis of crystal structure disintegration was presented. The sodium ions would substitute the europium and barium ions in the mirror plane and magnesium ions in the spinel block successively, which results in more oxygen vacancies and interstitial sodium ions were appeared. The unit cell (P63/mmc (194)) would break from the mirror plane. Then changes into BaAl2O4 (P6322 (182)), and be decomposed into NaAlO2, and barium and europium ions combine with free OH− and CO2 into BaCO3, Eu2O3 and H2O. However, a more detailed investigation and direct evidence into structure change is needed.Acknowledgements
The work was supported by the National Key Project of the Scientific and Technical Support Program of China (Grants nos 2011BAE13B07, 2012BAC02B01 and 2011BAC10B02), the National Hi-tech R&D Program of China (Grant no. 2012AA063202) and the National Natural Science Foundation of China (Grants U1360202).References
- K. Binnemans, P. T. Jones, B. Blanpain, T. Van Gerven, Y. Yang, A. Walton and M. Buchert, J. Cleaner Prod., 2013, 51, 1–22 CrossRef CAS PubMed.
- V. Pike, S. Patraw, A. L. Diaz and B. G. Deboer, J. Solid State Chem., 2003, 173, 359–366 CrossRef CAS.
- Y. Wang, Q. Zhu, L. Hao, X. Xu and R. Xie, J. Am. Ceram. Soc., 2013, 96, 2562–2569 CrossRef CAS PubMed.
- S. Oshio, T. Matsuoka, S. Tanaka and H. Kobayashi, J. Electrochem. Soc., 2008, 145, 3903–3907 CrossRef PubMed.
- European Commission, Critical raw materials for the EU, Report of the Ad-hoc Working Group on Defining Critical Raw Materials, European Commission. Enterprise and Industry, Brussels, 2010 Search PubMed.
- U.S. Department of Energy, 2011. 2011 Critical Materials Strategy, 97.
- T. Horikawa and K. Machida, Mater. Integr., 2011, 24, 37–43 CAS.
- M. Tanaka, T. Oki, K. Koyama, H. Narita and T. Oishi, Handb. Phys. Chem. Rare Earths, 2013, 43, 159–212 Search PubMed.
- L. Meyer and B. Bras, IEEE International Symposium, Chicago, May 2011, pp. 16–18 Search PubMed.
- J. J. Braconnie r and A. Rollat, Patent: WO2010118967A1, 2010.
- R. Otto and A. Wojtalewicz-Kasprzac, US Patent: US 2012/0027651 A1, 2012.
- K. Binnemans and P. T. Jones, J. Rare Earths, 2014, 32, 195–200 CrossRef CAS.
- M. Bettman and L. L. Terner, Inorg. Chem., 1971, 10, 1442–1446 CrossRef CAS.
- N. Iyi, Z. Inoue and S. Kimura, J. Solid State Chem., 1986, 61, 81–89 CrossRef CAS.
- S. Kimura, E. Bannai and I. Shindo, Mater. Res. Bull., 1982, 17, 209–215 CrossRef CAS.
- N. Iyi, S. Takekawa, Y. Bando and S. Kimura, J. Solid State Chem., 1983, 47, 34–40 CrossRef CAS.
- N. Iyi, Z. Inoue, S. Takekawa and S. Kimura, J. Solid State Chem., 1984, 52, 66–72 CrossRef CAS.
- K. B. Kim, Y. I. Kim, H. G. Chun, T. Y. Cho, J. S. Jung and J. G. Kang, Chem. Mater., 2002, 14, 5045–5052 CrossRef CAS.
- M. Stephan, P. C. Schmidt, K. C. Mishra, M. Raukas, A. Ellens and P. Z. Boolchand, Z. Phys. Chem., 2001, 215, 1397–1412 CrossRef CAS.
- Z. Wu and A. N. Cormack, J. Electroceram., 2003, 10, 179–191 CrossRef CAS.
- H. Liu, S. Zhang, D. Pan, J. J. Tian, M. Yang, M. Wu and A. A. Volinsky, J. Hazard. Mater., 2014, 272, 96–101 CrossRef CAS PubMed.
| This journal is © The Royal Society of Chemistry 2015 |

