Mechanism of Pb(II) and methylene blue adsorption onto magnetic carbonate hydroxyapatite/graphene oxide
Limei Cuia,
Yaoguang Wangb,
Lihua Hub,
Liang Gaob,
Bin Du*a and
Qin Weib
aSchool of Resources and Environment, University of Jinan, Jinan 250022, China. E-mail: dubin61@gmail.com; Fax: +86-531-82767370; Tel: +86-531-82767872
bKey Laboratory of Chemical Sensing & Analysis in Universities of Shandong, School of Chemistry and Chemical Engineering, University of Jinan, Jinan 250022, China
First published on 8th January 2015
Abstract
Magnetic carbonate hydroxyapatite/graphene oxide (M-CHAP/GO) was successfully prepared by loading magnetic carbonate hydroxyapatite (M-CHAP) onto graphene oxide sheets and was found to be an ideal adsorbent for heavy metal (Pb(II)) and dye (methylene blue). The obtained adsorbent was characterized by SEM, FTIR, XRD, BET, TGA, XPS and zeta potential, respectively. M-CHAP/GO nano-particles possessed a favorable and stable morphology. Moreover, the good magnetic properties of M-CHAP/GO made it simple to recover from water with magnetic separation. The equilibrium adsorption capacity was 277.7 mg g−1 for Pb(II) and 546.4 mg g−1 for methylene blue under the optimal conditions. The pseudo-second-order equation and the Langmuir model showed good correlation with the experimental data and explained well the mechanism of adsorption. It was found that the adsorption process was accomplished mainly via chelation and ion exchange. Thermodynamic studies (ΔG < 0, ΔH > 0, ΔS > 0) implied that the adsorption process was endothermic and spontaneous in nature. The other adsorption mechanisms are further researched in this article. All the experimental results show that M-CHAP/GO nano-particles have potential application in the future of environmental management.
1. Introduction
Wastewater discharged from various human activities has caused serious threats to the environment and drinking water. Heavy metals ions and dyes are two of the most basic environmental pollutants due to the indiscriminate disposal of wastewater.1 Wastewaters from many industries, such as mining, metallurgical, chemical industry and battery manufacturing, contain plentiful kinds of toxic heavy metal ions.2 They are non-biodegradable and accumulate in living organisms, causing various diseases and disorders.3 Lead ions, for example, accumulate mainly in bones, brain, kidney and muscles and may cause some serious disorders like kidney disease, nervous disorders, anaemia and sickness, even death.4 The discharge of dyes into the environment is also worthy of concern for both toxicological and esthetical reasons. Textile, paper, leather and plastics industries are some of the sources for dye effluents.5 Methylene blue (MB) is the most commonly used substance for dying cotton, wood or silk. Long-term surface contact with MB can give rise to permanent injury on the eyes. Moreover, long-term MB inhalation may cause nausea, vomiting and mental disorders, etc.6 The enormous harmfulness of heavy metals pollution and dye wastewater makes it particularly important to remove them from aqueous solution. Among several chemical or physical methods, adsorption has been found to be superior compared with other techniques (chemical precipitation, conventional coagulation, ion-exchange, line softening, reverse osmosis and so on) for wastewater treatment in terms of its simplicity of design, low cost and capability for efficiently adsorbing a broad range of pollutants.7–9 In recent years, designing a suitable adsorbent for Pb(II) or MB removal has attracted wide attention. What's more, some careless disposal behaviors probably bring about a mixture of the two kinds of pollutants, which surely increases the difficulty in the industrial wastewater treatment. So, it is significant to investigate an effective adsorbent to remove both lead and MB.Hydroxyapatite (HAP) is a stable and inexpensive salt produced through precipitation from calcium phosphate solutions.10 The structure of hydroxyapatite is hexagonal, with space group P63/m: essentially a 6-fold c-axis perpendicular to three equivalent a-axes at angles of 120° to each other. HAP is a principal component of animal hard tissues and shows excellent potential in water treatment because of its environment friendly nature, low cost, high stability and adsorption capacity for heavy metals.11,12 It has been reported in removal of a wide variety of metals (e.g., Cu, Cr, Co, Cd, Zn, Ni, Pb, As, Sb and Sr) by many investigators.9,11,13–18 The adsorption takes place through ionic exchange reaction, surface complexation with phosphate, calcium and hydroxyl groups and/or co-precipitation. More recently, the synthetic carbonate hydroxyapatite (CHAP) had higher efficiency in the removal of heavy metals (Pb(II), Cd(II), Cu(II), Hg(II)) than HAP, but its dissolution, crystallizability, surface activity and thermal stability don't change much.19,20
However, there are still some shortcomings for CHAP in the application of adsorption. On the one hand, the tiny size of pure CHAP nano-particles may increase the burden of solid–liquid separation. Much effort has been made to modify CHAP nano-particles.21 Magnetic nano-materials, like Fe3O4 nano-particles have drawn considerable attention because of their great potential applications in magnetic felids.22 The use of a magnet can provide a very simple and effective method to separate the particles along with target pollutants from the aqueous phase. In principle, adsorption can remove heavy metals and then recover and recycle them back to industrial processes.23,24 With the help of magnetic materials, it will be easy to realize. Meanwhile, the excellent magnetic recycle performance of nano-materials can effectively avoid the release of nano-scale adsorbent into environment which may result in unknown damage.25 If Fe3O4 can be introduced into CHAP, they will significantly improve the adsorption process. On the other hand, CHAP nano-particles are very limited in dye adsorption. Dye adsorption is mainly depended on the action of groups between dye and adsorbent or conjugation effect.26,27 The single hydroxyl groups on the surface of CHAP are not beneficial to react with most dyes. Compared with inorganic compounds, organic materials generally have a better affinity with dyes. Graphene oxides, which are considered as the oxidized graphene, contain oxygen-containing functional groups (–COOH, –OH, C![[double bond, length as m-dash]](https://www.rsc.org/images/entities/char_e001.gif) O) on the surfaces, these functional groups can widely react with MB as well as Pb(II).28–30 Considering the high surface area (theoretical value of 2620 m2 g−1) has attracted considerable attention as a two dimensional carbon-based material of atomic thickness,2 the graphene oxide nano-sheets should have high adsorption capacity in removal of dyes and heavy metals from large volumes of aqueous solutions.
O) on the surfaces, these functional groups can widely react with MB as well as Pb(II).28–30 Considering the high surface area (theoretical value of 2620 m2 g−1) has attracted considerable attention as a two dimensional carbon-based material of atomic thickness,2 the graphene oxide nano-sheets should have high adsorption capacity in removal of dyes and heavy metals from large volumes of aqueous solutions.
From the above, developing adsorbents which combine the advantages of GO, Fe3O4 and CHAP will be an excellent method to clean up the heavy metals pollution and dye wastewater. The primary objective of this work is to develop magnetic carbonate hydroxyapatite/graphene oxide (M-CHAP/GO) for heavy metals (Pb(II)) and dye (MB) adsorption, which can take full advantage of abundant oxygen-containing functional groups and large specific surface area of GO, strong ion exchange properties of CHAP and the magnetic separation performance of Fe3O4. In particular, the magnetic CHAP in such composite could also serve as a stabilizer against the aggregation of individual GO sheets due to a strong van der Waals interaction between the GO layers.31 Therefore, M-CHAP/GO is potential to be a cost-effective adsorbent for removal of Pb(II) and MB from wastewater. The present work investigated the influence of various parameters on the adsorption process and determined the optimum conditions. In addition, both adsorption behavior and mechanism were explored at the microcosmic level.
2. Materials and methods
2.1 Reagents and solutions
All chemicals in this experiment were from Sinopharm Chemical Reagent Beijing Co., Ltd, China, which are analytical reagent grade or better quality. The solutions were prepared with ultrapure water (EASY-pure LF, Barnstead International, Dubuque, Iowa USA).2.2 Synthesis of M-CHAP/GO
Graphene oxide (GO) were prepared from purified natural graphite by the modified Hummers method.32 Fe3O4 nano-particles were prepared by hydrothermal method.33 M-CHAP/GO was prepared according to the following steps: firstly, 300 mL of calcium nitrate (0.025 mol L−1) was added into a three-necked round-bottomed flask provided with a mechanical stirrer and heated to 45 °C. 38.42 mL of ammonium bicarbonate (0.3 mol L−1) mixed with 174.65 mL of diammonium phosphate (0.3 mol L−1). 0.1 g Fe3O4 nano-particles were dispersed in the above mixture by ultrasonic dispersion for 8 min. Then, the dispersion was slowly added into calcium nitrate solution dropwise. In this process, the pH of the mixed system was kept at 10 by using ammonia. The reaction was kept for 40 min at 45 °C under severe mechanical agitation. The last compounding step: 0.1 g GO was dispersed in 20 mL of ultrapure water by ultrasonic dispersion for 20 min and then added to the above reaction system, and then kept reacting at 45 °C for 5 h. After that, the obtained precipitate was aged for 24 h. The final product, named M-CHAP/GO, was collected by the aid of an adscititious magnet and dried in a vacuum oven at 50 °C for 24 h.2.3 Characterization methods and instruments
The morphology of M-CHAP/GO was investigated by SEM images obtained from a field emission SEM (ZEISS, Germany). FTIR spectra were recorded in the spectral range of 4000–400 cm−1 on a Perkin-Elmer Spectrum One FTIR spectrometer (Perkin-Elmer, United States). XRD patterns were acquired with a Rigaku D/MAX 2200 X-ray diffractometer (Tokyo, Japan). BET analysis was performed on Micromeritics ASAP 2020 surface area and porosity analyzer (Quantachrome, United States). XPS analysis was performed on ESCALAB 250 (Thermo Fisher Scientific, USA). Pore distributions and pore volume were calculated using the adsorption branch of the N2 isotherms based on the BJH model. The zeta potential was measured at various pH with a JS94H (Shanghai, China).2.4 Batch adsorption experiments
All of pollutant solutions in the experiment were prepared by dissolving Pb(NO3)2 and MB into ultrapure water. Fresh dilutions were used in each experiment.In order to determine the optimum adsorption conditions and study the adsorption mechanism of Pb(II) and MB adsorption, batch adsorption experiments were performed in 100 mL stopper conical flask and shaken on a temperature controlled shaker. The effect of dosage was tested in the range of 3–20 mg (natural pH, contact time for 3 h, temperature at 298 K). The effect of contact time was studied in the time range of 3–180 min (dosage of 10 mg for Pb(II) and 12 mg for MB, natural pH, temperature at 298 K). The effect of pH was investigated in the range of 3–8 for Pb(II) and 2–12 for MB. Adsorption equilibrium isotherms were carried out with the initial concentrations rang of 40–200 mg L−1 for Pb(II) and 30–300 mg L−1 for MB. Adsorption thermodynamics were conducted at temperatures ranging from 298 K to 318 K with varying initial concentration.
At the end of adsorption, M-CHAP/GO was separated from the solution by magnetic separation. Pollutant was determined by a UV-Vis spectrophotometer (TU-1901, Beijing Purkinje General Instrument Co., Ltd.) at a wavelength of maximum absorbance of Pb(II) (λmax = 479 nm) and MB (λmax = 665 nm).
The removal efficiency and the amount of Pb(II) and MB adsorbed onto M-CHAP/GO were computed using the following equations:
 | (1) |
 | (2) |
2.5 Interference of competing cations
K+, Na+, Ca2+ and Mg2+, contained in most water, may have competition with Pb(II) on the active sites on the surface of M-CHAP/GO, batch experiments on the interference of competing cations were carried out using KNO3, NaNO3, Ca(NO3)2 and Mg(NO3)2 as the ionic medium in the range of 0–300 mg L−1. All the initial concentration of Pb(II) is 100 mg L−1 and the adsorbed volume is 25 mL. Pb(II) was determined by the same spectrophotometry method with adsorption.3. Results and discussion
3.1 Characterization of M-CHAP/GO
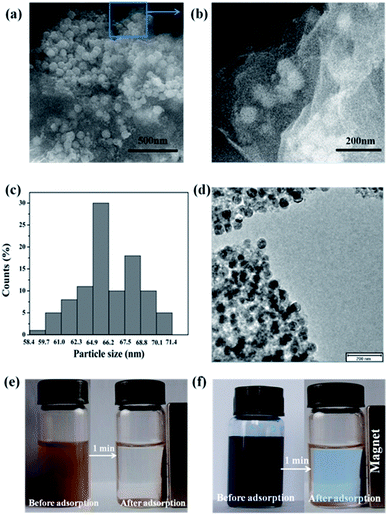 | ||
| Fig. 1 Characterization of the adsorbent prepared in the study: SEM images (a and b), particle size distribution (c), TEM images (d) and demonstration of magnetic separation (e and f). | ||
After combination, the M-CHAP spheres were uniformly diffused and firmly anchored on the wrinkled GO layers with a high density. Notably, the pleats structure of GO might enable the good distribution of M-CHAP on the surface of GO, meanwhile, the M-CHAP spheres served as a stabilizer separate GO sheets against the aggregation.
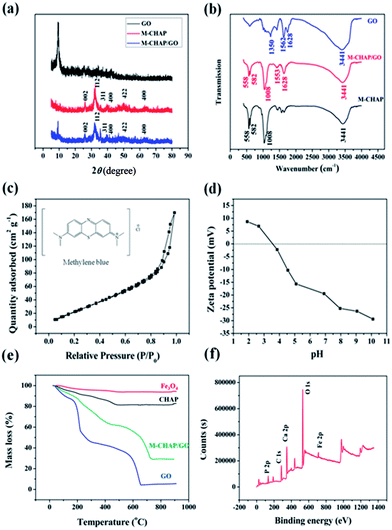
![[double bond, length as m-dash]](https://www.rsc.org/images/entities/char_e001.gif) O and C–OH, which often widely appeared in the GO surface.37 The absorption bands at 582 cm−1 were attributed to the Fe–O bond vibration of Fe3O4.38 The peaks at 1008 cm−1 and 558 cm−1 were well assigned to the molecular vibration of PO4.3–39 These oxygen-containing functional groups were conducive to promote the adsorption performance of M-CHAP/GO.
O and C–OH, which often widely appeared in the GO surface.37 The absorption bands at 582 cm−1 were attributed to the Fe–O bond vibration of Fe3O4.38 The peaks at 1008 cm−1 and 558 cm−1 were well assigned to the molecular vibration of PO4.3–39 These oxygen-containing functional groups were conducive to promote the adsorption performance of M-CHAP/GO.3.2 Factors affecting efficiency of Pb(II) and MB adsorption on M-CHAP/GO
Pb(S)2+ + ![[triple bond, length as m-dash]](https://www.rsc.org/images/entities/char_e002.gif) Ca(H)2+ → Ca(H)2+ → ![[triple bond, length as m-dash]](https://www.rsc.org/images/entities/char_e002.gif) Pb(H)2+ + Ca(S)2+ Pb(H)2+ + Ca(S)2+ |
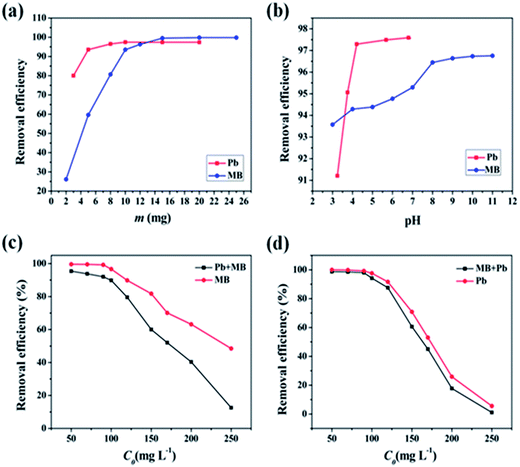
Subscripts (S) and (H) denoted solution and M-CHAP/GO phase, respectively. The metals in the solution (Pb(S)2+) replace a surface Ca2+ of the adsorbent (![[triple bond, length as m-dash]](https://www.rsc.org/images/entities/char_e002.gif) Ca(H)2+). The lower pH brought about a large number of H3O+, it caused a fierce competition in the ion-exchange sites inside the CHAP. Meanwhile, as pH increased, the protonated hydroxy and carboxyl function groups in GO were deprotonated, enhancing the adsorption capacity of M-CHAP/GO for Pb(II) ions. A further increasing in the solution pH would bring about a decreasing of Pb(II) concentration and other species become primary, such as PbOH+,43 which diminished Pb(II) adsorption at solution pH higher than 6.8. Meanwhile, precipitate (Pb(OH)2) could occur at a higher solution pH. Consequently, a pH 4.5 was chosen for further adsorption experiment to avoid the precipitation of Pb(OH)2 above pH 6.8 and the decomposition of adsorbent at an excessive low pH.
Ca(H)2+). The lower pH brought about a large number of H3O+, it caused a fierce competition in the ion-exchange sites inside the CHAP. Meanwhile, as pH increased, the protonated hydroxy and carboxyl function groups in GO were deprotonated, enhancing the adsorption capacity of M-CHAP/GO for Pb(II) ions. A further increasing in the solution pH would bring about a decreasing of Pb(II) concentration and other species become primary, such as PbOH+,43 which diminished Pb(II) adsorption at solution pH higher than 6.8. Meanwhile, precipitate (Pb(OH)2) could occur at a higher solution pH. Consequently, a pH 4.5 was chosen for further adsorption experiment to avoid the precipitation of Pb(OH)2 above pH 6.8 and the decomposition of adsorbent at an excessive low pH.
The maximum removal efficiency (96.64%) was achieved at solution pH 9.1 for MB. This behavior can be mainly explained by the change in the ionic state of the hydroxy and carboxyl function groups in M-CHAP/GO, which also worked crucially in reaction between M-CHAP/GO and MB. The structure of MB was shown in Fig. 2(c). MB usually acted as a positive ion (MB+) in the aqueous solution. So, the negative surface charge of the adsorbent would be beneficial to the removal of MB. When the solution pH was low, functional groups were protonated. The electrostatic attraction between M-CHAP/GO and MB weakened. As a result, MB uptake capacity decreased. When the solution pH increased gradually, hydroxy and carboxyl function groups were deprotonated and MB+ can be bound to negatively charged groups by electrostatic attraction. To make sure the maximum removal efficiency, all the following experiments were carried out at solution pH 9.1 for MB.
To further analyze the adsorption kinetics, the pseudo-first-order equation, pseudo-second-order equation, Elovich equation, intraparticle diffusion equation and Bangham equation were applied to describe the kinetics of Pb(II) and MB adsorbing onto M-CHAP/GO. Each model is expressed as follows:
(1) Pseudo-first-order model:
log(qe − qt) = log![[thin space (1/6-em)]](https://www.rsc.org/images/entities/char_2009.gif) qe − k1t qe − k1t
| (3) |
(2) Pseudo-second-order model:
 | (4) |
(3) Elovich model:
 | (5) |
(4) Intraparticle diffusion model:
| qt = kdift1/2 + C | (6) |
(5) Bangham model:
 | (7) |
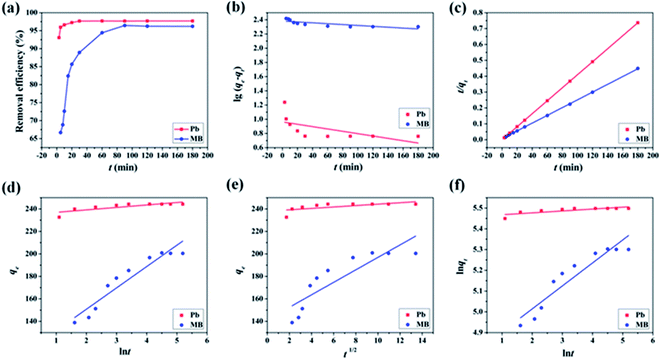
The linear fitting results of kinetics were shown in Fig. 4 and the relevant calculative results were listed in Table 1. The pseudo-second-order kinetic model gave a satisfactory fit to all the experimental data compared to other kinetic models for Pb(II) (R2 = 0.9999) and MB (R2 = 0.9998), which mean that the main rate determining step was chemisorptions. That is to say, the overall rate of Pb(II) and MB adsorption process seemed to be controlled by the chemical process through exchanging of electrons or a chemical reaction between adsorbent and adsorbates.44 Besides, the calculated qe according to pseudo-second-order kinetic model was 244.5 mg g−1 for Pb(II) and 409.8 mg g−1 for MB, which were consistent with the experimental data (244.2 mg g−1 for Pb(II) and 403.7 mg g−1 for MB).
| Kinetic model | Parameter | Pb(II) | R2 | MB | R2 |
|---|---|---|---|---|---|
| Pseudo-first-order | K1 (mg min g−1) | 0.001655 | 0.3757 | 0.0006174 | 0.5642 |
| qe (mg g−1) | 29.87 | 241.3 | |||
| Pseudo-second-order | K2 (mg min g−1) | 0.04508 | 0.9999 | 0.008556 | 0.9998 |
| qe (mg g−1) | 244.5 | 409.8 | |||
| Elovich | α (mmol g−1 min−1) | 8.066 | 0.6291 | 7.268 | 0.8256 |
| β (g mmol−1) | 0.4567 | 0.05269 | |||
| Intraparticle diffusion | kdif (mg g−1 min−1/2) | 0.6309 | 0.3774 | 5.5445 | 0.9253 |
| Bangham | M | 0.5839 | 0.6236 | 0.6086 | 0.8736 |
| kb (mg g−1) | 1.025 | 1.275 |
In addition, the linear fitting results of the MB adsorption process was in conformity with the intraparticle diffusion model, which indicated the MB adsorption process could be explained by the following three portions:45 (i) the first portion corresponded to boundary layer diffusion or external surface adsorption, about 25 min; (ii) the second stage was a gradual adsorption stage attributed to intraparticle diffusion, about 65 min; (iii) the final plateau region was equilibrium adsorption. For MB removal by M-CHAP/GO, the intraparticle process might be another rate-limiting step.
3.3 Adsorption isotherms
When the adsorption occurs, the progress will proceed until the remaining adsorbate is in dynamic equilibrium with that on the adsorbent surface. Adsorption isotherms can provide some physicochemical information on how the adsorption proceeds and how adsorbate interacts with adsorbent surface.46 The adsorption behavior was described by four common adsorption models as follow:(1) Henry equation:
| qe = KHCe | (8) |
(2) Langmuir equation:
 | (9) |
(3) Freundlich equation:
 | (10) |
(4) Temkin equation:
 | (11) |
 is related to the adsorption heat. AT is the equilibrium constant corresponding to the maximum binding-energy.
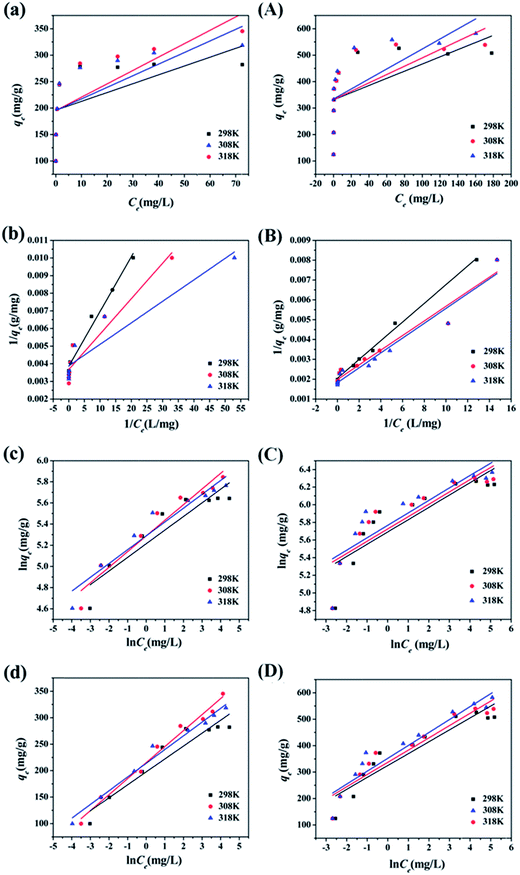
The four common adsorption models showed in Fig. 5. The isotherm parameters calculated from the slope and intercept of Fig. 5 and presented in Table 2. Taking the correlation coefficient as a criterion for good fit of the system, the equilibrium adsorption data were well fitted Langmuir model for both Pb(II) (R2 = 0.9645, R2 = 0.9547, R2 = 0.8984) and MB (R2 = 0.9943, R2 = 0.9549, R2 = 0.9538) at 298 K, 308 K and 318 K. The Langmuir isotherm indicated that the surface of M-CHAP/GO was monolayer covered with Pb(II) or MB.47 According to the Langmuir isotherm parameters, the maximum adsorption capacity of M-CHAP/GO nano-particles for Pb(II) and MB was 277.7 mg g−1 and 546.4 mg g−1 at 318 K, respectively. 0 < 1/n < 0.5 indicated that Pb(II) or MB was facile to be adsorbed onto M-CHAP/GO. Furthermore, the correlation coefficients for Temkin isotherm model of Pb(II) and MB adsorption onto M-CHAP/GO were all higher than 0.9285 at the three temperature, which revealed that the adsorption system based on the heat.48 Table 2 also presented that the adsorption capacity from experiment significantly increased with the increase of temperature. It could be explained from two aspects: firstly, an increase in temperature is known to increase the diffusion rate of the adsorbate across the external boundary layer and within the pores of the porous adsorbent.49 So, the adsorption capacity increased, especially for heavy metals; secondly, more bond ruptures of the functional groups on the adsorbent surface at a higher temperature may increase the number of active adsorption sites, it also contributes to an enhanced adsorption capacity of the adsorbent.
| Temperature | Adsorption isotherm | Parameter | Pb(II) | R2 | MB | R2 |
|---|---|---|---|---|---|---|
| 298 K | Henry | KH | 1.871 | 0.5773 | 1.355 | 0.5281 |
| Langmuir | b | 12.41 | 0.9645 | 4.375 | 0.9943 | |
| qm | 246.1 | 405.4 | ||||
| Freundlich | KF | 184.1 | 0.8422 | 296.4 | 0.7161 | |
| 1/n | 0.1287 | 0.1393 | ||||
| Temkin | bT | 215.3 | 0.9812 | 352.2 | 0.9399 | |
| AT | 1235 | 1348 | ||||
| 308 K | Henry | KH | 2.530 | 0.6239 | 1.577 | 0.5846 |
| Langmuir | B | 18.34 | 0.9547 | 5.516 | 0.9549 | |
| qm | 271.7 | 502.5 | ||||
| Freundlich | KF | 198.1 | 0.9151 | 307.7 | 0.7443 | |
| 1/n | 0.1478 | 0.1396 | ||||
| Temkin | bT | 213.9 | 0.9285 | 324.9 | 0.9645 | |
| AT | 3849 | 1370 | ||||
| 318 K | Henry | KH | 2.191 | 0.5431 | 1.891 | 0.6469 |
| Langmuir | B | 31.84 | 0.8984 | 5.901 | 0.9538 | |
| qm | 277.7 | 546.4 | ||||
| Freundlich | KF | 198.4 | 0.8811 | 319.5 | 0.7312 | |
| 1/n | 0.1307 | 0.1412 | ||||
| Temkin | bT | 197.7 | 0.9551 | 337.2 | 0.9493 | |
| AT | 3287 | 1448 |
3.4 Adsorption thermodynamic
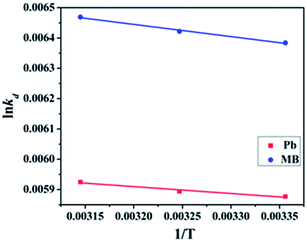
To further evaluate the effect of temperature influence on the adsorption and investigate the possible mechanism involved in the adsorption progress, the thermodynamic behaviors were evaluated by the following equations:
ΔG = −RT![[thin space (1/6-em)]](https://www.rsc.org/images/entities/char_2009.gif) ln ln![[thin space (1/6-em)]](https://www.rsc.org/images/entities/char_2009.gif) Kd Kd
| (12) |
 | (13) |
| Pollutants | Temperature | ln![[thin space (1/6-em)]](https://www.rsc.org/images/entities/char_2009.gif) Kd Kd |
ΔG (kJ mol−1) | ΔH (kJ mol−1) | ΔS (J mol−1 K−1) |
|---|---|---|---|---|---|
| Pb(II) | 298 K | 0.005877 | −14.56 | 1.885 | 55.21 |
| 308 K | 0.005894 | −15.09 | |||
| 318 K | 0.005925 | −15.66 | |||
| MB | 298 K | 0.006384 | −15.81 | 3.372 | 64.27 |
| 308 K | 0.006422 | −6.44 | |||
| 318 K | 0.006469 | −17.11 |
3.5 Effect of ionic strength on adsorption
Generally, wastewaters from industries contain cations such as K+, Na+, Ca2+ and Mg2+, they have similar physical and chemical properties with heavy metal ions, thus, their presence in aqueous solution may compete with Pb(II) on the adsorption sites in M-CHAP/GO and thus affect the adsorption capacity. In order to investigate the effect of K+, Na+, Ca2+ and Mg2+ on Pb(II) adsorption, the competing experiments were carried out using KNO3, NaNO3, Ca(NO3)2 and Mg(NO3)2 as cations source in a range of 0–300 mol L−1. From the tested data shown in Fig. 7, the removal efficiency of Pb(II) reduced less than 1% with the presence of K+, Na+, Ca2+ and Mg2+ in the solution. Compared with K+ and Na+, Ca2+ and Mg2+ resulted in a little larger reduction on the adsorption capacity of Pb(II). It is because Ca2+, Mg2+ and Pb2+ are bivalent cations, they have more similar physical and chemical properties. On the whole, K+, Na+, Ca2+ and Mg2+ had a little effect on the adsorption of Pb(II) onto M-CHAP/GO.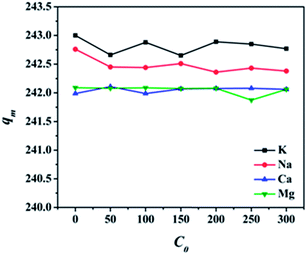 | ||
| Fig. 7 Effect of ionic strength on adsorption (m = 10 mg, V = 25 mL, t = 3 h, pH at 4.5, temperature at 298 K). | ||
3.6 Adsorption capacity comparison of different composition unit
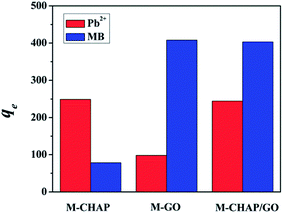
Sole M-GO and M-CHAP samples were prepared to compare the adsorption capacity difference in Pb(II) and MB. In Fig. 8, adsorption results compared M-CHAP with M-CHAP/GO can be found that M-CHAP play a major role in the adsorption of Pb(II). Similar to this, comparison of M-GO and M-CHAP/GO implied that M-GO mainly worked in the adsorption of MB. A combination of M-CHAP and M-GO make M-CHAP/GO has a good adsorption performance in the removal of both heavy metals and dyes.3.7 Performance evaluations
Various adsorbents have been reported for removal of heavy metal ions or dye. Table 4 listed the comparison of the maximum adsorption capacities (qm) of M-CHAP/GO with other adsorbents in literature for heavy metal ions or dye adsorption. Considering whether qm or the simple feasibility, M-CHAP/GO showed superior performance. Some composite adsorbents perform better for one or two contaminants, but they have an expensive or complex synthetic process. Taking the economic cost and applied scope into consideration, M-CHAP/GO has a better prospect in adsorption or other field.| Material | Target element | Isotherm | Kinetic | qm (mg g−1) | Ref. |
|---|---|---|---|---|---|
| MCD-GO-R | Pb(II) | Langmuir | PSO | 277.7 | This paper |
| Methylene blue | 546.4 | ||||
| Chitosan spheres | Hg(II) | Langmuir | PSO | 31.1 | 50 |
| Fe3O4–cyclodextrin | Pb(II) | Langmuir | PSO | 64.5 | 51 |
| Cd(II) | 27.7 | ||||
| Ni(II) | 13.2 | ||||
| Ion exchange resins | Hg(II) | Freundlich | PSO | 215.75 | 52 |
| Chitosan beads-supported Fe0-nanoparticles | Cu(II) | — | — | 55.19 | 53 |
| Pb(II) | — | — | 22.66 | ||
| Cr(VII) | — | — | 55.96 | ||
| Cd(II) | — | — | 30.75 | ||
| Fe3O4@SiO2–NH2 | Pb(II) | Langmuir | PSO | 243.9 | 54 |
| Polyethersulfone/hydrous manganese dioxide | Pb(II) | Langmuir | PSO | 204.1 | 55 |
| Freundlich | |||||
| Activated carbon | Methylene blue | Langmuir | PSO | 454.2 | 56 |
| Commercial activated carbon | Methylene blue | Langmuir | B–V | 298.9 | 57 |
| I–D | |||||
| Freundlich | Lagergren | ||||
| Tea waste | Methylene blue | Langmuir | PSO | 85.16 | 58 |
| Oil palm fibre activated carbon | Methylene blue | Langmuir | PSO | 277.8 | 59 |
| Cinnamomum camphora sawdust | Malachite green | Langmuir | PSO | 157.5 | 60 |
| Freundlich | |||||
| Temkin | |||||
| Amino functionalized graphenes | Metanil yellow | Langmuir | PSO | 71.6 | 61 |
4. Conclusions
In this work, M-CHAP/GO was prepared through two steps: M-CHAP was first synthesized by the coprecipitation method and then loaded onto graphene oxide sheet. M-CHAP/GO performed well on the adsorption of Pb(II) and MB. The equilibrium adsorption capacity was 277.7 mg g−1 for Pb(II) and 546.4 mg g−1 for MB at 308 K. The pseudo-second-order equation and the Langmuir model were found to fit the experimental data for both contaminants. The adsorption process was efficient and rapid. Furthermore, the thermodynamic studies illustrated that the adsorption process was endothermic and spontaneous in nature, which showed a good economic efficiency. In terms of high efficiency and feasibility, M-CHAP/GO could be a promising absorbent for removing heavy metals and dye from aqueous solution.Acknowledgements
This study was supported by the National Natural Science Foundation of China (no. 21175057, 21375047 and 21377046), the Science and Technology Plan Project of Jinan (no. 201307010), and QW thanks the Special Foundation for Taishan Scholar Professorship of Shandong Province and UJN (no. ts20130937).References
- X. Yang, C. Chen, J. Li, G. Zhao, X. Ren and X. Wang, RSC Adv., 2012, 2, 8821–8826 RSC.
- G. Zhao, J. Li, X. Ren, C. Chen and X. Wang, Environ. Sci. Technol., 2011, 45, 10454–10462 CrossRef CAS PubMed.
- L. Järup, Br. Med. Bull., 2003, 68, 167–182 CrossRef PubMed.
- V. K. Gupta, M. Gupta and S. Sharma, Water Res., 2001, 35, 1125–1134 CrossRef CAS.
- I. Tan, A. L. Ahmad and B. Hameed, J. Hazard. Mater., 2008, 154, 337–346 CrossRef CAS PubMed.
- D. Ghosh and K. G. Bhattacharyya, Appl. Clay Sci., 2002, 20, 295–300 CrossRef CAS.
- D. Manohar, K. Anoop Krishnan and T. Anirudhan, Water Res., 2002, 36, 1609–1619 CrossRef CAS.
- Y. Sun, C. Chen, D. Shao, J. Li, X. Tan, G. Zhao, S. Yang and X. Wang, RSC Adv., 2012, 2, 10359–10364 RSC.
- M. Srinivasan, C. Ferraris and T. White, Environ. Sci. Technol., 2006, 40, 7054–7059 CrossRef CAS.
- Y. Xu, F. W. Schwartz and S. J. Traina, Environ. Sci. Technol., 1994, 28, 1472–1480 CrossRef CAS PubMed.
- R. Sheha, J. Colloid Interface Sci., 2007, 310, 18–26 CrossRef CAS PubMed.
- Y. Li, C. Liu, H. Zhai, G. Zhu, H. Pan, X. Xu and R. Tang, RSC Adv., 2014, 4, 25398–25403 RSC.
- X. Chen, J. V. Wright, J. L. Conca and L. M. Peurrung, Environ. Sci. Technol., 1997, 31, 624–631 CrossRef CAS.
- P. K. Chaturvedi, C. S. Seth and V. Misra, Chemosphere, 2006, 64, 1109–1114 CrossRef CAS PubMed.
- S. McGrellis, J.-N. Serafini, J. JeanJean, J.-L. Pastol and M. Fedoroff, Sep. Purif. Technol., 2001, 24, 129–138 CrossRef CAS.
- J. C. Seaman, J. S. Arey and P. M. Bertsch, J. Environ. Qual., 2001, 30, 460–469 CrossRef CAS.
- K. Elkabouss, M. Kacimi, M. Ziyad, S. Ammar and F. Bozon-Verduraz, J. Catal., 2004, 226, 16–24 CrossRef CAS PubMed.
- A. G. Leyva, J. Marrero, P. Smichowski and D. Cicerone, Environ. Sci. Technol., 2001, 35, 3669–3675 CrossRef CAS.
- D. Liao, W. Zheng, X. Li, Q. Yang, X. Yue, L. Guo and G. Zeng, J. Hazard. Mater., 2010, 177, 126–130 CrossRef CAS PubMed.
- W. Zheng, X. Li, Q. Yang, G. Zeng, X. Shen, Y. Zhang and J. Liu, J. Hazard. Mater., 2007, 147, 534–539 CrossRef CAS PubMed.
- B. Ma, W. S. Shin, S. Oh, Y.-J. Park and S.-J. Choi, Sep. Sci. Technol., 2010, 45, 453–462 CrossRef CAS.
- Z. Xu and J. Dong, Emerging Environ. Technol., 2008, 278, 105–148 Search PubMed.
- J. Gómez-Pastora, E. Bringas and I. Ortiz, Chem. Eng. J., 2014, 256, 187–204 CrossRef PubMed.
- S. Zhang, J. Li, T. Wen, J. Xu and X. Wang, RSC Adv., 2013, 3, 2754–2764 RSC.
- X. Guo, B. Du, Q. Wei, J. Yang, L. Hu, L. Yan and W. Xu, J. Hazard. Mater., 2014, 278, 211–220 CrossRef CAS PubMed.
- S. Wang, Y. Boyjoo and A. Choueib, Chemosphere, 2005, 60, 1401–1407 CrossRef CAS PubMed.
- T. Robinson, B. Chandran and P. Nigam, Water Res., 2002, 36, 2824–2830 CrossRef CAS.
- G. Sheng, Y. Li, X. Yang, X. Ren, S. Yang, J. Hu and X. Wang, RSC Adv., 2012, 2, 12400–12407 RSC.
- G. Ramesha, A. Vijaya Kumara, H. Muralidhara and S. Sampath, J. Colloid Interface Sci., 2011, 361, 270–277 CrossRef CAS PubMed.
- C. J. Madadrang, H. Y. Kim, G. Gao, N. Wang, J. Zhu, H. Feng, M. Gorring, M. L. Kasner and S. Hou, ACS Appl. Mater. Interfaces, 2012, 4, 1186–1193 CAS.
- L. Ai, C. Zhang and Z. Chen, J. Hazard. Mater., 2011, 192, 1515–1524 CrossRef CAS PubMed.
- L. Sun, H. Yu and B. Fugetsu, J. Hazard. Mater., 2012, 203, 101–110 CrossRef PubMed.
- S. Guo, D. Li, L. Zhang, J. Li and E. Wang, Biomaterials, 2009, 30, 1881–1889 CrossRef CAS PubMed.
- H. Su, Z. Li, Q. Huo, J. Guan and Q. Kan, RSC Adv., 2014, 4, 9990–9996 RSC.
- C. C. Ribeiro, I. Gibson and M. A. Barbosa, Biomaterials, 2006, 27, 1749–1761 CrossRef CAS PubMed.
- Z. H. Cheng, A. Yasukawa, K. Kandori and T. Ishikawa, J. Chem. Soc., Faraday Trans., 1998, 94, 1501–1505 RSC.
- P. Kumar, G. Singh, D. Tripathi and S. L. Jain, RSC Adv., 2014, 4, 50331–50337 RSC.
- S. Li, H. Bai, J. Wang, X. Jing, Q. Liu, M. Zhang, R. Chen, L. Liu and C. Jiao, Chem. Eng. J., 2012, 193, 372–380 CrossRef PubMed.
- K. Lin, P. Liu, L. Wei, Z. Zou, W. Zhang, Y. Qian, Y. Shen and J. Chang, Chem. Eng. J., 2013, 222, 49–59 CrossRef CAS PubMed.
- J. Zhou, C. Tang, B. Cheng, J. Yu and M. Jaroniec, ACS Appl. Mater. Interfaces, 2012, 4, 2174–2179 CAS.
- G. Moussavi and B. Barikbin, Chem. Eng. J., 2010, 162, 893–900 CrossRef CAS PubMed.
- C. Belin, C. Quellec, M. Lamotte, M. Ewald and P. Simon, Environ. Technol., 1993, 14, 1131–1144 CrossRef CAS.
- V. K. Gupta, M. Gupta and S. Sharma, Water Res., 2001, 35, 1125–1134 CrossRef CAS.
- A. Mohammadi, H. Daemi and M. Barikani, Int. J. Biol. Macromol., 2014, 69, 447–455 CrossRef CAS PubMed.
- J. H. Chen, Q. L. Liu, S. R. Hu, J. C. Ni and Y. S. He, Chem. Eng. J., 2011, 173, 511–519 CrossRef CAS PubMed.
- C. Ng, J. N. Losso, W. E. Marshall and R. M. Rao, Bioresour. Technol., 2002, 85, 131–135 CrossRef CAS.
- L. Wang, J. Zhang and A. Wang, Desalination, 2011, 266, 33–39 CrossRef CAS PubMed.
- E. Malkoc, J. Hazard. Mater., 2006, 137, 899–908 CrossRef CAS PubMed.
- J. H. Chen, H. T. Xing, H. X. Guo, G. P. Li, W. Weng and S. R. Hu, J. Hazard. Mater., 2013, 248, 285–294 CrossRef PubMed.
- R. S. Vieira and M. M. Beppu, Water Res., 2006, 40, 1726–1734 CrossRef CAS PubMed.
- A. Z. M. Badruddoza, Z. B. Z. Shawon, W. J. D. Tay, K. Hidajat and M. S. Uddin, Carbohydr. Polym., 2013, 91, 322–332 CrossRef CAS PubMed.
- S. Chiarle, M. Ratto and M. Rovatti, Water Res., 2000, 34, 2971–2978 CrossRef CAS.
- T. Liu, X. Yang, Z. L. Wang and X. X. Yan, Water Res., 2013, 47, 6691–6700 CrossRef CAS PubMed.
- J. Zhang, S. Zhai, S. Li, Z. Xiao, Y. Song, Q. An and G. Tian, Chem. Eng. J., 2013, 215, 461–471 CrossRef PubMed.
- R. Jamshidi Gohari, W. Lau, T. Matsuura, E. Halakoo and A. Ismail, Sep. Purif. Technol., 2013, 120, 59–68 CrossRef CAS PubMed.
- B. Hameed, A. M. Din and A. Ahmad, J. Hazard. Mater., 2007, 141, 819–825 CrossRef CAS PubMed.
- N. Kannan and M. M. Sundaram, Dyes Pigm., 2001, 51, 25–40 CrossRef CAS.
- M. T. Uddin, M. A. Islam, S. Mahmud and M. Rukanuzzaman, J. Hazard. Mater., 2009, 162, 53–60 CrossRef PubMed.
- I. Tan, B. Hameed and A. Ahmad, Chem. Eng. J., 2007, 127, 111–119 CrossRef CAS PubMed.
- H. Wang, X. Yuan, G. Zeng, L. Leng, X. Peng, K. Liao, L. Peng and Z. Xiao, Environ. Sci. Pollut. Res., 2014, 1–13 Search PubMed.
- X. Guo, Q. Wei, B. Du, Y. Zhang, X. Xin, L. Yan and H. Yu, Appl. Surf. Sci., 2013, 284, 862–869 CrossRef CAS PubMed.
| This journal is © The Royal Society of Chemistry 2015 |

