DOI:
10.1039/C4RA13897J
(Paper)
RSC Adv., 2015,
5, 7515-7521
Synthesis, growth and photoluminescence behaviour of Gd2O2SO4:Eu3+ nanophosphors: the effect of temperature on the structural, morphological and optical properties
Received
5th November 2014
, Accepted 18th December 2014
First published on 19th December 2014
Abstract
Gd2(SO4)3·8H2O, Gd2O2SO4, and Gd2O2SO4:Eu3+ nanoparticles have been synthesized in the presence of Gd3+ ions and sodium dodecyl sulphate (SDS) by the simple complexation-thermal decomposition (CTD) method. The structural analysis, growth mechanism and optical properties of the Gd2(SO4)3·8H2O, and Gd2O2SO4 are described by the diffraction pattern, functional group analysis, Raman, morphology, elemental analysis, and absorbance spectra. The most intriguing factor was that the Gd2O2SO4 nanoplates are in the range of 42–50 nm without adding any external stabilizer. The results revealed that the Gd2O2SO4 nanoparticles with an orthorhombic structure have a band gap of 3.12 eV. Furthermore, Gd2O2SO4 shows an intense red photoluminescence associated with the 5D0 → 7F2 transition in the presence of Eu3+. The results suggest that the Gd2O2SO4:Eu3+ nanophosphors, may have a beneficial approach in the field of biomedical application as luminescent probe/labels.
1. Introduction
Phosphors have stimulated intensive interest within research in the last few years, due to their technological importance and scientific application. Rare earth (RE) phosphors with unique physico-chemical properties (magnetic, electrical, electronic, optical and so forth) makes them critically important in magnets, superconducting and electronic materials, medical imaging and cancer therapy, pigments, phosphor screens and fluorescent materials.1–6 It is important to systematically research the rare earth host in different kinds of crystals with good structural, morphology, and optical properties as efficient emitting materials. The optical activation of RE ions doped crystals can be enhanced significantly because of energy transfer from the host and charge transfer to RE.7 Especially, Eu3+ ion (4f6) results very intense luminescence in the red region (610–620 and 690–710 nm). The red emission is included to the biological window, which can be used in many display applications. These red emitter nanoparticles (RENPs) are used in biomedical applications as luminescence probes/labels. In particular, the nanostructured rare-earth compounds with high unpaired f-electron spin values have been applied to the biomedical field of therapeutic agent, MRI contrast agent, single phase multifunctional bio-probes and drug delivery host matrix for upconversion fluorescence.8–11
Rare earth oxysulfate (RE2O2SO4) has considered as a host matrix for activates the electronic transition with the Eu3+ ions to reveals luminescence. Not only RE2O2SO4, but also several fluorides,12 molybdates,13 phosphates,14 and sulfites15 have also been reported as the host crystals of phosphor. Amongst, RE2O2SO4 has some unique chemical and optical features, such as low toxicity, sharp emission lines, high magnetic moment due to the seven unpaired electrons (8S7/2), and long lifetimes.16–18 It was well known that, the behaviour of nanostructured materials purely depends on their particle size and shape.19 In addition, it has been widely reported that the bulk to nanoscale size reduction play the major role on the physico-chemical properties of various nanomaterials.20 synthesis of advanced materials with controlled size and/or polydispersity to obtain improved or novel properties by using colloidal assemblies as templates.21 Anionic surfactant like sodium dodecyl sulphate (SDS) was good candidate for controlling the size and shape of nanoparticles in various methods including thermal and nonthermal method.22,23 Gadolinium, the most abundant element in the rare-earth metal family has notable importance, because of its high magnetic moment due to the seven unpaired electrons (8S7/2). However, relatively few publications about the synthesis, controlled size and growth mechanism of Gd2O2SO4 have been reported and the resulting products are limited to needle-like hierarchical and plate morphology. The focus of this work has been to explore the structural, growth, and optical property of size-reduced Gd2O2SO4 obtained by the absence of any external capping agents. Interestingly, dodecyl sulphate itself acts as a complexing agent as well as size controller. To the best of our knowledge, the investigation on growth mechanism of gadolinium oxysulfate from gadolinium dodecyl sulphate by the simple complexation-thermal decomposition (CTD) method has not been reported so far. In this present work, Gd2(SO4)3·8H2O, Gd2O2SO4 nanoparticles and Gd2O2SO4:Eu3+ nanophosphors were synthesized by the simple CTD method. The synthetic experiments indicate that the formation of gadolinium dodecyl sulphate needle-like hierarchical nanostructure is through the reaction between Gd3+ and DS− ions by an orientation mechanism. The oriented nanoneedles deformed to plate-like nanostructure by the Ostwald ripening method. Growth mechanism, crystal structure, optical band gap, morphology, and photoluminescence property of Gd2O2SO4 have been investigated.
2. Experimental section
2.1. Materials
Gadolinium(III) nitrate hexahydrate (Gd(NO3)3·6H2O, 99.9%), and europium(III) acetate hydrate (Eu(CH3CO2)3·H2O, 99.9%) was purchased from Sigma-Aldrich. Sodium dodecyl sulphate (C12H25NaO4S, 99%) and ethanol were purchased from SRL India Ltd., and used as received. Double distilled water used as solvent throughout the experiment.
2.2. Synthesis of the gadolinium dodecyl sulphate (GdDS), gadolinium sulphate and gadolinium oxysulfate (GdOS)
Gadolinium dodecyl sulphate was synthesized by reacting stoichiometric amount of gadolinium nitrate and SDS. 0.45 g of gadolinium nitrate was dissolved in 150 mL distilled water and stirred for 20 min. After 20 min, 0.83 g of SDS in 50 mL distilled water was added slowly into the gadolinium nitrate solution. After few seconds the colourless-cloudy colloidal particles were formed. The resulting colourless foam-like product was filtered and washed with de-ionized water. The obtained gadolinium dodecyl sulphate was redispersed in ethanol and evaporated. Further, gadolinium sulphate (Gd2(SO4)3), and gadolinium oxysulfate (Gd2O2SO4) were obtained by decomposing the gadolinium dodecyl sulphate complex in air atmosphere at 400 °C and 900 °C for 2 h, respectively. The obtained samples were collected for further characterization.
2.3. Synthesis of the europium-doped gadolinium oxysulfate (EuGdOS)
5% (w/w) europium-doped gadolinium oxysulfate (Gd0.95Eu0.05)2O2SO4 was synthesized by the above mentioned CTD method. 0.43 g of gadolinium nitrate and 0.02 g of europium acetate was dissolved in 150 mL distilled water, which was homogenized for 20 min with stirring. After 20 min, 0.83 g of SDS in 50 mL distilled water was added slowly into the europium–gadolinium nitrate solution. The obtained gadolinium oxysulfate (EuGdOS) by the above mentioned procedure was collected for further analysis.
2.4. Characterization techniques
Crystal structure, crystallite size and lattice parameter of the products were determined by Rich Siefert 3000 diffractometer with Cu Kα1 radiation (λ = 1.5406 Å). Fourier Transform Infrared spectra (FTIR) were recorded on a Perkin Elmer FTIR spectrophotometer in the region of 4000 to 400 cm−1. The morphology was analyzed by HITACHI SU6600 (FE-SEM) Field Emission Scanning Electron Microscopy coupled with Energy Dispersive X-ray analysis (EDAX) and High Resolution Transmission Electron Microscopy (HRTEM) using a FEI TECNAI G2 model T-30 at accelerating voltage of 250 kV. Raman spectrum was recorded using laser confocal microscope, Raman-11 Nanophoton Corporation, Japan and Ultraviolet-Visible Diffuse Reflectance spectroscopy (DRS-UV-Vis) was recorded using Perkin Elmer lambda650 spectrophotometer. Photoluminescence spectra were recorded using a Perkin-Elmer LS45 luminescence spectrophotometer.
3. Results and discussion
Gadolinium oxysulfate nanoparticles were synthesized by a simple approach involving calcination of gadolinium dodecyl sulphate complex. The dodecyl sulphate (DS−) self-assembled with gadolinium nitrate by complexation method was re-dissolved in ethanol to form a transparent colloidal solution under ambient condition. GdDS complex results numerous products including gadolinium sulphate and gadolinium oxysulfate at various condition. The graphical representation of possible growth mechanism was shown in Scheme 1. The X-ray diffraction (XRD) pattern of the prepared sample calcined at (a) 400 °C, (b) 700 °C, and (c) 900 °C were given in Fig. 1. The powder XRD pattern in Fig. 1a, all the diffraction peaks could be indexed to the end centered monoclinic phase matched with standard value (JCPDS no. 081-1794) of Gd2(SO4)3·8H2O, with C2/c (15) space group. The lattice constants were calculated using the XRD pattern, a = 11.97 Å, b = 7.09 Å, c = 17.95 Å. In Fig. 1b, the mixed phase of (a) and (c) occur in the calcination at 700 °C, which gives clue about the phase transformation from Gd2(SO4)3 to GdO2SO4, which has grown on (013) plane. When the temperature was raised to 900 °C, well defined diffraction peaks appeared and the lattice parameters (a = 4.04 Å, b = 4.17 Å, c = 12.97 Å) could be indexed to the orthorhombic phase of Gd2O2SO4 matched with the standard value (JCPDS no. 029-0613) of Gd2O2SO4, suggesting that the Gd2(SO4)3 crystal structure has been converted into Gd2O2SO4. The similarity of peak broadening in the entire diffraction patterns indicates there were no vast changes in crystallite size. The FTIR spectra are showed in Fig. 2 depicts the changes occurring in the GdDS under the various heat treatment conditions (100 °C to 900 °C). The obtained peaks were assigned to S–O asymmetric stretching vibration at 1236 cm−1, and symmetric stretching vibration at 1060, and 1004 cm−1. The peaks at 2976, 2914, 2854, and 823 cm−1 were assigned as C–H stretching and bending modes.24 Fig. 2 demonstrates characteristic broad intense bands in the range of 3000–3750 cm−1, and 1620 cm−1 were corresponds to the H–OH vibrations. The peaks near 1384 and 1523 cm−1 were assigned to the impurities like C–O absorbed on the sample surface at the decomposition stages. The peaks in the region of 570 to 670 cm−1 corresponds to the vibration of Gd–S bond and 526 cm−1 corresponds to the vibration of Gd–O bond.25 In FTIR spectrum, the deformation of H–OH and C–H and the appearance of Gd–O bond at corresponding decomposition stages clearly explain the growth mechanism of Gd2(SO4)3, and Gd2O2SO4 from gadolinium dodecyl sulphate.
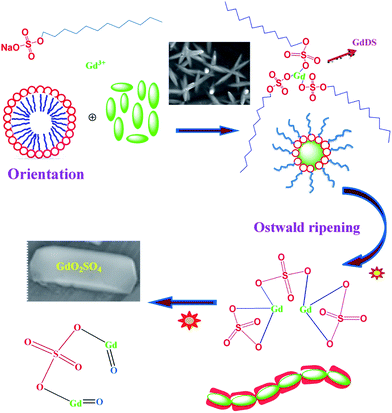 |
| | Scheme 1 Schematic representation of the processes occurring at different stages leads to the growth of GdOS nanoplates. | |
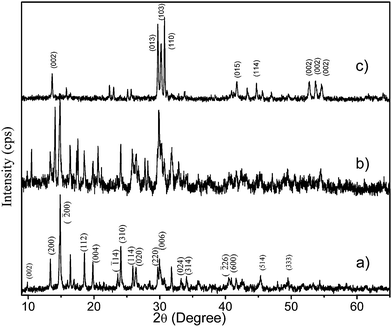 |
| | Fig. 1 XRD pattern of GdDS decomposed at various temperatures (a) 400, (b) 700, and (c) 900 °C. | |
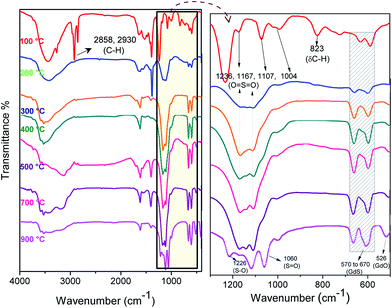 |
| | Fig. 2 FT-IR spectra of GdDS decomposed at various temperatures 100, 200, 300, 400, 500, 700, and 900 °C. | |
Fig. 3a and b shows the FESEM-EDAX images of the as prepared GdDS, which clearly indicates that the product consists of cactus needle-like nanorices assembled by orientation mechanism. The high magnification FESEM image (Fig. 3b) exhibits the formation of needle shaped particle with sharp headed tips. The inspection of images suggests that the coalescence between the particles may contribute to the growth by the orientation mechanism in the complexation method. In addition, the elemental analysis was obtained by EDAX analysis, shown in Fig. 3c, which clearly demonstrates a homogeneous distribution of gadolinium, carbon, oxygen, and sulphur elements. HRTEM images of GdDS shown in Fig. 4a and b reveals that the observed results well-matched with the FESEM results. In agreement with the FE-SEM results, the average breadth in the middle part of needles was measured in the range of 50–55 nm. Selected area energy diffraction (SAED) pattern shown in Fig. 4c reveals that the nanoneedles were highly crystalline in nature. Fig. 5a represents FESEM-EDAX images of hydrated Gd2(SO4)3 at 400 °C, reveals that the particles were close to elongated spheroids with aggregation due to the temperature. Ripening at this stage leads to the formation of elongated spheroid shaped particle from melted needles. FESEM-EDAX images of sample at 700 °C shown in Fig. 5b reveals that the shape transformation from spheroid into plate shape has taken place. According to the results the possible formation mechanism of the cactus needle like nanorices, the experimental results could be explained as follows. Self-assembly of surfactant (SDS) will results the formation of oil-in-water aggregates, commonly called as micelles. To make particles, the metal ion of the surfactant (sodium) is replaced by the reactive ion (gadolinium) in the chemical reaction. The increasing concentration of SDS concentration acts as one of the reactant, which reduces flocculation and stimulates the formation of well-defined particles due to the inherent van der Waals attraction between particle and dispersion forces.21,26 While increasing temperature at the thermal decomposition state the ripening process takes place due to the thermal diffusion of ions, which induces the structural and shape deformation. The following inspection of the results reveals that the formation of GdDS nanorices obtained by the orientation mechanism and further growth process begun to nanoplates from nanorices by the Ostwald ripening mechanism. The growth of the plate like structure was further confirmed by the FESEM-EDAX images of sample calcined at 900 °C shown in Fig. 5c, which evidences the presence of gadolinium, oxygen, sulphur and absence of carbon elements, and it was in good agreement with the results shown above.
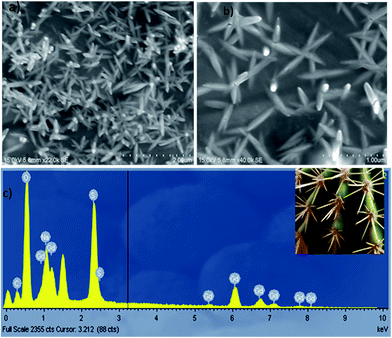 |
| | Fig. 3 (a) FESEM image of GdDS, (b) high magnified view of GdDS, and (c) EDAX spectrum of GdDS nanoneedles. | |
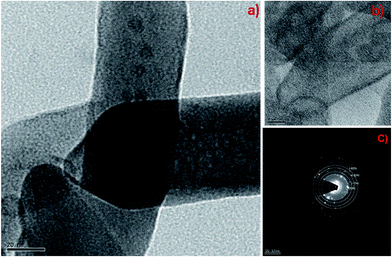 |
| | Fig. 4 (a) HRTEM image of GdDS, (b) high magnified view of GdDS, and (c) SAED pattern of GdDS nanoneedles. | |
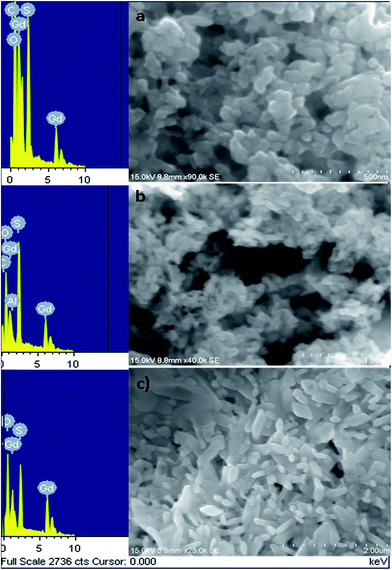 |
| | Fig. 5 FESEM-EDAX images of GdDS decomposed at various temperatures (a) 400, (b) 700, and (c) 900 °C. | |
Fig. 6 shows the absorption spectra of the GdDS nanoparticles calcined at different temperatures 400, 700, and 900 °C, respectively, carried out using DRS UV-Vis spectrometer, in order to characterize the optical absorbance properties. It can be seen from spectra for samples calcined at 700, and 900 °C temperatures, the UV absorption in the region of short wavelength consist of a significant broad band at 240 nm, small hump at 274 nm and the predominant peak at 344 nm. While increasing the calcination temperature of GdOS nanoparticles from 700 to 900 °C, the relative intensity of the two broad band's increases significantly, this elucidates that the intensity of the composed bands strongly depends on the calcination temperature. The absorption band near short wavelength region at 344 nm in the spectra can be related to the transition from the ground state 8S7/2 to emitting state 6P7/2 of Gd3+ ion.27,28 The weaker absorption band located at 240 nm was due to the transition from the 2p orbitals of O2− to the 4f orbitals Gd3+ ion, the band ascribed to the absorption of Gd2O2SO4 host crystal. Another peak with weak absorption at 274 nm was attributed to the 8S7/2 to 6I7/2 internal f–f transition.29 The band gap (Eg) of the Gd2O2SO4 can be calculated from Tauc equation.
where
α – absorption coefficient,
h – Planck constant,
ν – frequency,
A – constant, and
n = 1/2, 2, 3/2, or 3 for direct allowed transition, indirect allowed transition, direct forbidden or indirect forbidden transitions, respectively. The optical band gap of the GdDS calcined at 900 °C inferred from the Tauc plot was shown in
Fig. 6. The value of hν extrapolated to
α = 0 gives the band gap energy of GdOS is approximately 3.12 eV, which exhibits the nature of semiconductivity. The Raman spectra of GdDS under various heat treatment conditions (100 to 900 °C) are shown in
Fig. 7, recorded at ambient condition. The bands were located in between the region of 60 to 2400 cm
−1 was listed in
Table 1. The D and G bands in the region of 1330–1555 cm
−1 have disappeared after 400 °C. The disappearance of D and G bands confirms the removal of hydrocarbon from the GdDS and the formation of Gd
2(SO
4)
3 begun at 400 °C. Strong band located in the region of 980–1010 cm
−1 corresponds to the symmetric stretching vibration of SO
42− ions. However, little signal intensity was observed for the triply degenerate (
νas-SO
42−) modes in the region of 1080–1170 cm
−1 in accordance with the weak Raman transition for asymmetric stretching vibrations.
30,31 After calcination at 700 °C, appearance of new bands in the low frequency region evidences the formation of Gd
2O
2SO
4 from gadolinium sulphate. Raman spectrum obtained for GdDS decomposed at 900 °C was corresponding to the gadolinium oxysulfate, is in good agreement with the results reported.
7 The obtained Raman results have good relationship with the discussed FTIR results. Accordingly, temperature consequences the phase transition and the phase was identified to be orthorhombic Gd
2O
2SO
4.
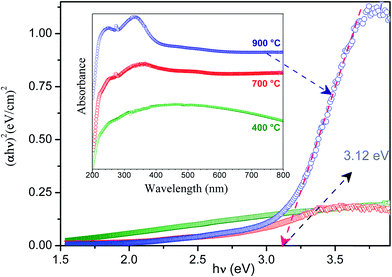 |
| | Fig. 6 Tauc plot (inset: DRS-UV-Vis absorption spectra) of GdDS with optimum conditions. | |
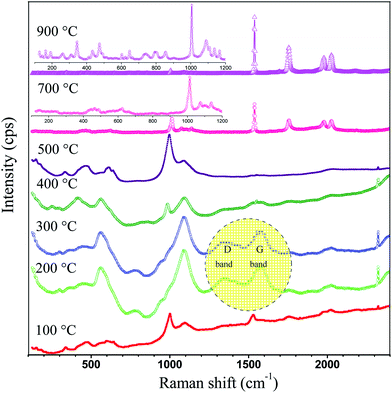 |
| | Fig. 7 Confocal Raman spectra of GdDS decomposed at various temperatures 100, 200, 300, 400, 500, 700, and 900 °C. | |
Table 1 Raman bands listed for GdDS samples decomposed at various temperatures in the region of 60 to 2400 cm−1
| Temperature °C |
Raman bands (cm−1) |
| 100 |
339, 464, 540, 598, 998, 1097, 1357, 1531, 1761, 2030 |
| 200 |
566, 790, 941, 999, 1082, 1334, 1554, 2026, 2323 |
| 300 |
423, 564, 790, 1096, 1331, 1551, 2022, 2389 |
| 400 |
254, 414, 558, 987, 1097, 2325 |
| 500 |
149, 329, 469, 613, 998, 2330 |
| 700 |
618, 1002, 1072, 1137, 1557, 1756, 1975, 2030 |
| 900 |
125, 162, 191, 343, 473, 602, 646, 739, 794, 852, 1005, 1087, 1135, 1167, 1531, 1697, 1753, 1974, 2030, 2326 |
FESEM and HRTEM images of (Gd0.95Eu0.05)2O2SO4 nanoplates were shown in Fig. 8b and c, respectively. The HRTEM-EDX spectrum of Gd2O2SO4:Eu3+ (Fig. 8a) confirms the presence of europium in the Gd2O2SO4 host. It confirms that successful doping could be attained through current synthetic approach. The HRTEM higher magnification image was shown in Fig. 8d, which elucidate that the particles have nanoscale with plate like morphology. The average breadth of the plates was measured in the range of 42–50 nm and the length was estimated to be 520–560 nm. SAED spectrum shown in Fig. 8e explains the crystalline nature of the orthorhombic (Gd(0.95)Eu0.05)2O2SO4 nanophosphors. Europium-doped gadolinium oxysulfate nanophosphors have been calcined for 2 h at 900 °C in order to study the Eu3+ emission spectra evolution in the hosts. Eu3+ (4f6) were inside orthorhombic Gd2O2SO4 nanoparticles, it tends to capture an oxygen 2p electron to move towards the highly stable 4f7 configuration.31,32 Therefore a low-energy state was created in the triplet state, which was well suited for energy transfer by trivalent europium f–f transition leading to the emission lines for the (5D0 → 7FJ (J = 0 to 4) transitions. The photoluminescence spectrum of the Gd2O2SO4:Eu3+ were shown in Fig. 9. The broad dominant peaks splits as 614, 618 nm arising from the 5D0 → 7F2 transition usually associated with Eu3+ cations occupying crystallographic sites,33 which is exist with the displacement of Gd3+ by Eu3+ ions. The remaining bands have been assigned as 5D0 → 7F0 at 578.9 nm, 5D0 → 7F1 the group of peaks at 588, 597 nm, 5D0 → 7F3 at 657 nm, and 5D0 → 7F4 at 701 nm. The 5D0 → 7F0 of Eu3+ was a transition between two non-degenerate levels. Some weak bands were appeared around its expected location due to the presents of Eu3+ ions at defect sites. The 0–0 (zero phonon) line transitions between 5D0 → 7F0 gives information on the environment around the doped Eu3+ ion at low-symmetry sites in crystal.34 Moreover, the presence of oxygen in the Gd2O2SO4 particles gave rise to a charge transfer (at 400 nm) which could be used to excite the 4f orbital of Eu3+ ions more efficiently and the energy position of the lines from trivalent europium ions is basically independent on the host. Orthorhombic Gd2O2SO4 nanoplates synthesized by CTD method have a long-term stability and further lanthanide sensitization indispensible and responsible for the optical properties and life science application.
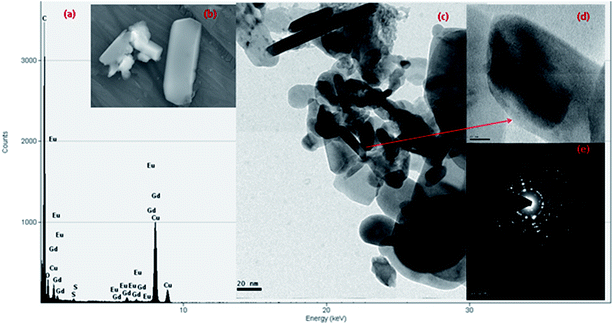 |
| | Fig. 8 (a) EDX spectrum (b) FESEM image (c) HRTEM image (d) high magnified view and (e) SAED pattern of Gd2O2SO4:Eu3+ nanoplates. | |
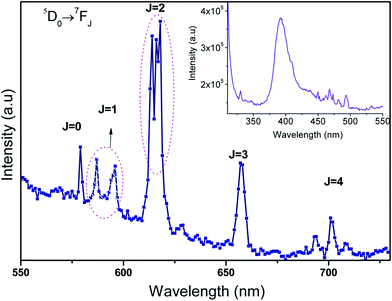 |
| | Fig. 9 Photoluminescence spectra of Gd2O2SO4:Eu3+, inset: excitation spectrum of Gd2O2SO4:Eu3+. | |
4. Conclusions
A simple method has been developed to synthesize Gd2(SO4)3, and Gd2O2SO4 by CTD method. The possible growth mechanism is discussed based on the FE-SEM, HRTEM, XRD, FTIR, DRS-UV-Vis, and Raman results. CTD method has a number of advantages including the simple reaction conditions, environmentally friendly, and high reproducibility. The simple CTD method offers a convenient method to synthesize nanostructured materials. This result suggests that the Gd2O2SO4 nanophosphors with tailorable nanostructures were hopeful for life science applications as luminescent probe/labels. These finding are important not only for enabling life science application but also for providing sensor platform as well as optoelectronics due to its band gap and emission properties.
Acknowledgements
The authors acknowledge National Centre for Nanoscience and Nanotechnology, University of Madras for providing financial support and FE-SEM, HRTEM, DRS-UV-Vis and Raman facilities.
References
- K. Bernot, L. Bogani, A. Caneschi, D. Gatteschi and R. Sessoli, J. Am. Chem. Soc., 2006, 128, 7947–7956 CrossRef CAS PubMed.
- S. J. Litzelman, J. L. Hertz, W. Jung and H. L. Tuller, Fuel Cells, 2008, 8, 294–302 CrossRef CAS.
- L. Faucher, A. A. Guay Begin, J. Lagueux, M. F. Cote, E. Petitclerc and M. A. Fortin, Contrast Media Mol. Imaging, 2011, 6, 209–218 CAS.
- S. Radhika, K. J. Sreeram and B. U. Nair, ACS Sustainable Chem. Eng., 2014, 2, 1251–1256 CrossRef CAS.
- Z. Xia and R. Liu, J. Phys. Chem. C, 2012, 116, 15604–15609 CAS.
- J. L. Bridot, D. Dayde, C. Riviere, C. Mandon, C. Billotey, S. Lerondel, R. Sabattier, G. Cartron, A. Le Pape, G. Blondiaux, M. Janier, P. Perriat, S. Roux and O. J. Tillement, Mater. Chem., 2009, 19, 2328–2335 RSC.
- T. Grzyb, R. J. Wiglusz, V. Nagirnyi, A. Kotlov and S. Lis, Dalton Trans., 2014, 6925–6934 RSC.
- Z. Liu, X. Liu, Q. Yuan, K. Dong, L. Jiang, Z. Li, J. Ren and X. Qu, J. Mater. Chem., 2012, 22, 14982–14990 RSC.
- G. Tian, Z. Gu, X. Liu, L. Zhou, W. Yin, L. Yan, S. Jin, W. Ren, G. Xing, S. Li and Y. J. Zhao, J. Phys. Chem. C, 2011, 115, 23790–23796 CAS.
- L. Cheng, K. Yang, Y. Li, J. Chen, C. Wang, M. Shao, S. T. Lee and Z. Liu, Angew. Chem., Int. Ed., 2011, 50, 7385–7390 CrossRef CAS PubMed.
- P. Caravan, J. J. Ellison, T. J. McMurry and R. B. Lauffer, Chem. Rev., 1999, 99, 2293–2352 CrossRef CAS PubMed.
- Q. Zhao, B. Shao, W. Lu, Y. Jia, W. Lv, M. Jiao and H. You, CrystEngComm, 2013, 15, 9930–9937 RSC.
- A. K. Parchur and R. S. Ningthoujam, Dalton Trans., 2011, 7590–7594 RSC.
- A. I. Prasad, A. K. Parchur, R. R. Juluri, N. Jadhav, B. N. Pandey, R. S. Ningthoujam and R. K. Vatsa, Dalton Trans., 2013, 4885–4896 RSC.
- F. Wang, X. Chen, D. Liu, B. Yang and Y. Dai, J. Mol. Struct., 2012, 1020, 153–159 CrossRef CAS PubMed.
- J. Kim, Y. Piao and T. Hyeon, Chem. Soc. Rev., 2009, 38, 372–390 RSC.
- I. F. Li, C. H. Su, H. S. Sheu, H. C. Chiu, Y. W. Lo, W. T. Lin, J. H. Chen and C. S. Yeh, Adv. Funct. Mater., 2008, 18, 766–776 CrossRef CAS.
- J. Lian, F. Liu, X. Wang and X. Sun, Powder Technol., 2014, 253, 187–192 CrossRef CAS PubMed.
- J. Lian, X. Sun and X. Li, Mater. Chem. Phys., 2011, 125, 479–484 CrossRef CAS PubMed.
- J. Thirumalai, R. Chandramohan, R. Divakar, E. Mohandas, M. Sekar and P. Parameswaran, Nanotechnology, 2008, 19, 395703 CrossRef CAS PubMed.
- M. P. Pileni, Langmuir, 1997, 13, 3266–3276 CrossRef CAS.
- Y. Lu, X. Tang, L. Yan, K. Li, X. Liu, M. Shang, C. Li and J. Lin, J. Phys. Chem. C, 2013, 117, 21972–21980 CAS.
- M. Machida, K. Kawamura, T. Kawano, D. Zhang and K. Ikeue, J. Mater. Chem., 2006, 16, 3084–3090 RSC.
- J. D. Lee, W. C. Choi and J. D. Kim, CrystEngComm, 2010, 12, 3249–3254 RSC.
- R. Manigandan, K. Giribabu, R. Suresh, L. Vijayalakshmi, A. Stephen and V. Narayanan, Mater. Res. Bull., 2013, 48, 4210–4215 CrossRef CAS PubMed.
- J. Liang, R. Ma, F. Geng, Y. Ebina and T. Sasaki, Chem. Mater., 2010, 22, 6001–6007 CrossRef CAS.
- N. Dhananjaya, H. Nagabhushana, B. M. Nagabhushana, B. Rudraswamy, C. Shivakumara, K. P. Ramesh and R. P. S. Chakradhar, Phys. B, 2011, 406, 1645–1652 CrossRef CAS PubMed.
- A. Vijayaraj, R. Prabu, R. Suresh, R. Sangeetha Kumari, V. Kaviyarasan and V. Narayanan, Bull. Korean Chem. Soc., 2012, 33, 3581–3588 CrossRef CAS.
- B. Umesh, H. Nagabhushana, S. C. Sharma, B. Eraiah, N. Dhananjaya, B. M. Nagabhushana, J. L. Rao and R. P. S. Chakradhar, J. Alloys Compd., 2014, 591, 286–292 CrossRef CAS PubMed.
- J. Cejka, J. Sejkora, R. L. Frost and E. C. Keeffe, J. Raman Spectrosc., 2009, 40, 1464–1468 CrossRef CAS.
- Y. Song, H. You, Y. Huang, M. Yang, Y. Zheng, L. Zhang and N. Guo, Inorg. Chem., 2010, 49, 11499–11504 CrossRef CAS PubMed.
- S. A. Osseni, S. Lechevallier, M. Verelst, P. Perriat, J. Dexpert-Ghys, D. Neumeyer, R. Garcia, F. Mayer, K. Djanashvili, J. A. Peters, E. Magdeleine, H. Gros-Dagnac, P. Celsis and R. Mauricot, Nanoscale, 2014, 6, 555–564 RSC.
- A. Escudero, E. Moretti and M. Ocana, CrystEngComm, 2014, 16, 3274–3283 RSC.
- P. A. Tanner, Chem. Soc. Rev., 2013, 42, 5090–5101 RSC.
|
| This journal is © The Royal Society of Chemistry 2015 |
Click here to see how this site uses Cookies. View our privacy policy here. 


