High-flux, antibacterial ultrafiltration membranes by facile blending with N-halamine grafted halloysite nanotubes
Linlin Duana,
Wei Huangb and
Yatao Zhang*ac
aSchool of Chemical Engineering and Energy, Zhengzhou University, Zhengzhou 450001, China. E-mail: zhangyatao@zzu.edu.cn
bHenan Fuping New Energy Technology Co., Ltd., Zhengzhou 450008, China
cUNESCO Centre for Membrane Science and Technology, University of New South Wales, Sydney, NSW 2052, Australia
First published on 17th December 2014
Abstract
N-Halamine grafted halloysite nanotubes (N-halamine@HNTs) were used as an antibacterial agents to fabricate polyethersulfone (PES) ultrafiltration (UF) hybrid membranes. N-Halamine@HNTs were characterized by Fourier transform infrared spectroscopy (FTIR) and X-ray photoelectron spectra (XPS). The chemical compositions, storage modulus, tan![[thin space (1/6-em)]](https://www.rsc.org/images/entities/char_2009.gif) δ, morphology and performance of the membranes were characterized by attenuated total reflection-Fourier transform infrared spectra (ATR-FTIR), dynamic mechanical analysis (DMA), water contact angle, scanning electron microscopy (SEM), transmission electron microscopy (TEM), atomic force microscopy (AFM), overall porosity and pore size measurements. The results showed that the hydrophilicity of the membranes was improved greatly after adding N-halamine@HNTs. Water flux of the hybrid membrane could reach as high as 248.3 L m−2 h−1 when the content of N-halamine@HNTs was 1.0 wt%. In addition, the antibacterial test indicated that the hybrid membranes showed good antibacterial activity against E. coli.
δ, morphology and performance of the membranes were characterized by attenuated total reflection-Fourier transform infrared spectra (ATR-FTIR), dynamic mechanical analysis (DMA), water contact angle, scanning electron microscopy (SEM), transmission electron microscopy (TEM), atomic force microscopy (AFM), overall porosity and pore size measurements. The results showed that the hydrophilicity of the membranes was improved greatly after adding N-halamine@HNTs. Water flux of the hybrid membrane could reach as high as 248.3 L m−2 h−1 when the content of N-halamine@HNTs was 1.0 wt%. In addition, the antibacterial test indicated that the hybrid membranes showed good antibacterial activity against E. coli.
Introduction
Polyethersulfone (PES) is one of the most useful materials for preparing ultrafiltration membranes due to its excellent chemical resistance, and good thermal and mechanical properties.1–3 PES ultrafiltration membranes have been widely used in many industry separation processes, especially in water and wastewater treatment. However, membrane biofouling is one of the most common and serious problems in the application such as membrane filtration technologies, especially in the wastewater treatment with relative high biological components.4,5 For membrane systems, biofouling could cause many problems, such as decreasing the permeate flux, increasing energy costs and shortening the lifetime.4–6 Unlike other kinds of fouling, biofouling could not be reduced by pre-treatment because of its self-replicating nature.7The biofouling is initiated by bacteria that attach and grow on the surface of the membranes.5,8 Therefore, the common strategy in preventing membrane biofouling is to improve the self-antibacterial property of the membrane for inhibiting the development of biofilm.6 Several antibacterial agents have been introduced to prepare antibacterial membranes, such as TiO2,8 silver ions/nanoparticles,9,10 copper ions,11,12 various polycations6,13 and N-halamines.14 Among the above mentioned antibacterial agents, N-halamine-structural antibacterial materials have received intensive interest because of their unique properties, such as antibacterial efficacy, stability in aqueous solution and in dry storage, lack of corrosion, durability and regenerability upon exposure to washing cycles, low toxicity, and relatively low expense.15–17 It is reported that 2,2,5,5-tetramethyl-imidozalidin-4-one (TMIO) was successfully grafted onto micro-porous polyurethane (PU) membrane surface as an N-halamine precursor through a two-step grafting procedure, then the grafted TMIO hydantoin structures were successfully converted into N-halamines by chlorination. The chlorinated PU membranes showed powerful antimicrobial properties.14
However, it is relatively difficult to chemically graft antibacterial agents onto the most polymers, which are inert and do not possess necessary functionality.18 An alternative approach is to use N-halamine nanocomposites as antibacterial additives.17 Several kinds of N-halamine additives loaded on different mineral fillers, magnetic silica nanoparticles15,19 and calcium carbonate,17 have been developed. Halloysite (Al2Si2O5(OH)4·2H2O) is one of the most widely used mineral fillers to modify various polymer materials such as polyetherimide, polyamide, epoxy resin and rubbers due to its high surface area, large aspect ratio and hollow structure.20–24 In our previous work,10,25 halloysite nanotubes (HNTs) have been used as additive for the preparation of PES hybrid membrane via the blending method. And the results showed that HNTs could improve the hydrophilicity and permeability of the hybrid membranes. Moreover, the adequate hydroxyl groups and tubular structure of HNTs make them easily dispersed in the polymer matrix.26–29
In this study, a novel hybrid ultrafiltration membrane was prepared by blending with N-halamine grafted HNTs, which is expected to enhance the antibacterial activity and the permeability of the membranes. The effect of N-halamine grafted HNTs content on the hydrophilicity, separation performance, morphology and antibacterial activity was investigated in detail. The hybrid membranes were also analyzed using water contact angle, SEM, TEM, AFM, overall porosity and pore size measurements. Finally, in order to prove the antibacterial activity of the membranes, the antibacterial test against E. coli was preformed.
Experimental
Materials
Halloysite clay from Henan Province (China) was milled and sieved followed by oven dried at 200 °C for 5 h to obtain dried halloysite nanotubes (HNTs) and the TEM image of HNTs is shown in Fig. 1(a). 3-Chloropropyltrimethoxysilane (CPS) was purchased from Aladdin Chemistry Co., Ltd. Toluene was obtained from Sinopharm Chemical Reagent Co., Ltd and dried over 4 Å molecular sieves for 48 h before use. 5,5-Dimethylhydantoin (DMH) was provided from TCI Shanghai. Polyethersulfone (PES, Mw = 58 kDa) was obtained from BASF, Germany. The test strains, E. coli (8099) used for this study was provided by College of Public Health of Zhengzhou University. All the other chemicals (analytical grade) were obtained from Tianjin Kermel Chemical Reagent Co., Ltd, China, and were used without further purified. The used water is deionized water.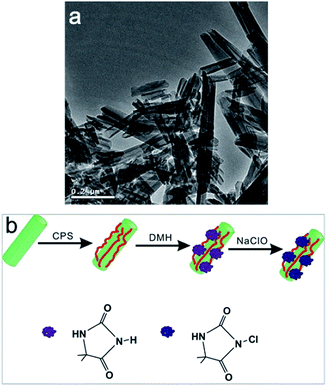 | ||
| Fig. 1 (a) TEM image of halloysite nanotubes; (b) schematic illustration of the preparation procedure of the N-halamine@HNTs nanocomposites. | ||
Modification of HNTs
The procedure employed to obtain N-halamine grafted HNTs is illustrated in Fig. 1(b). First, HNTs were modified with a silane coupling agent (CPS), and chlorine groups on the surface of HNTs could easily attach to DMH (the precursor of N-halamine) in the next reaction. Finally, the hydantoin groups of DMH transformed into N-halamine structures by chlorination treatment to produce N-halamine grafted HNTs.Chemical modification of HNTs by CPS was carried out according to the following procedure: HNTs (6.0 g) were suspended in toluene (100 mL), and an excess amount of CPS (9.0 g), and triethylamine (as a catalyst, 1.0 mL) was then added. Thereafter, the suspension was refluxed at 125 °C for 48 h under constant stirring. The products were collected by centrifugation and washed with isopropanol for 4–5 times and were dried in a vacuum drying chamber at 60 °C.
The CPS modified HNTs (CPS-HNTs) were then immobilized with DMH. DMH (6.4 g) was dissolved in the deionized water (25 mL) in the presence of potassium hydroxide (2.8 g). And then, CPS-HNTs (1.5 g) and methanol (10 mL) were added into the above mixtures and this reaction lasted for 12 h at 60 °C. The products were collected by centrifugation, washed with deionized water and pure ethanol, respectively. Finally, the products DMH-immobilized HNTs were dried in a vacuum drying chamber at 60 °C.
Chlorination of DMH-immobilized HNTs (DMH-HNTs) was carried out as followed. DMH-HNTs (ca. 1.3 g) were dispersed into 150 mL of sodium hypochlorite solution, and chlorination was carried out by vigorously stirring for 12 h at room temperature. The products were collected by centrifugation, washed by repeating re-dispersion in deionized water and pure ethanol. Finally, the products N-halamine grafted HNTs (N-halamine@HNTs) were dried in a vacuum drying chamber at 60 °C.
Preparation of the membranes
All membranes were prepared by the phase inversion method. Casting solution of the PES dissolved in DMAc was prepared using polyvinylpyrrolidone (PVP) as pore former by stirring at room temperature. After formation of homogeneous solution, N-halamine@HNTs was added into the casting solution with vigorous stirring for 12 h. The casting solutions were then degassed at room temperature for at least 24 h to remove air bubbles.Various N-halamine@HNTs concentrations (0–3 wt%, by weight of PES) of polymer dopes consisting of PES (18 wt%, by weight of the solution), DMAc (73.2 wt%, by weight of the solution), PVP (8 wt%, by weight of the solution), and acetone (0.8 wt%, by weight of the solution) were prepared. The solutions were cast uniformly onto a glass substrate by means of a hand-casting knife with the thickness of 0.3 mm and then immersed in a bath filled with deionized water. The formed membranes were kept in distilled water for at least 24 h and this allows the water soluble components in the membrane to be leached out.
Characterization of HNTs
Characterization of the membranes
![[thin space (1/6-em)]](https://www.rsc.org/images/entities/char_2009.gif) δ) were measured with a heating rate of 5 °C per min from 30–300 °C.
δ) were measured with a heating rate of 5 °C per min from 30–300 °C.![[thin space (1/6-em)]](https://www.rsc.org/images/entities/char_2009.gif) 000 (0.5 g L−1) solution was forced to permeate through the membrane at the same pressure. The permeation flux (J) and rejection (R) were calculated using the following equations:
000 (0.5 g L−1) solution was forced to permeate through the membrane at the same pressure. The permeation flux (J) and rejection (R) were calculated using the following equations:
 | (1) |
 | (2) |
![[thin space (1/6-em)]](https://www.rsc.org/images/entities/char_2009.gif) 000 were obtained by UV spectrophotometer.
000 were obtained by UV spectrophotometer.
 | (3) |
Guerout–Elford–Ferry equation (eqn (5)) was utilized to determine the mean pore radius (rm) on the basis of the pure water flux and porosity data.30,31
 | (4) |
Moreover, bacteriostasis rate was often used in order to quantitatively analyze the antibacterial activity of the membranes. E. coli were inoculated in 5 mL of LB liquid nutrient medium respectively, and shaken for 12 h at 37 °C. The actual number of cells used for a given experiment was determined by the standard serial dilution method. The membrane samples (ca. 0.03 g) were cut and sterilized by autoclaving for 20 min, respectively. To test the antibacterial activity, the membrane samples were added into the 5 mL solution incubated by about 106 CFU per mL of E. coli, which were incubated at room-temperature. After 24 h, the samples were retrieved from cultures and washed by normal saline. The wash solutions were collected and diluted it with deionized water till its concentration becomes to 10−3 of the original value. Dilution solution (0.2 mL) was spread onto LB culture medium and all plates were incubated at 37 °C for 24 h. The numbers of colonies on the plates were determined by the plate count method and bacteriostasis rate (BR) was defined by the following equation:
 | (5) |
 | (6) |
 | (7) |
Results and discussion
Characterization of HNTs
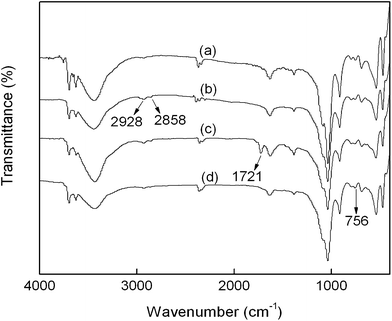
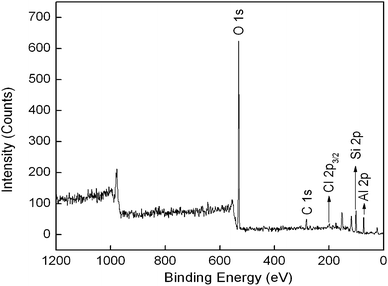
Fig. 2 shows the FT-IR spectra of HNTs, CPS-HNTs, DMH-HNTs, and N-halamine@HNTs. The spectrum of raw HNTs exhibits two Al2OH stretching bands at 3696 and 3625 cm−1, each O–H being linked to two Al atoms, a single Al2OH bending band at 913 cm−1, and in-plane Si–O–Si stretching vibrations (1092 cm−1 and 1030 cm−1).33,34 Compared with HNTs, CPS-HNTs exhibit two new peaks at 2928 and 2858 cm−1, which are attributed to asymmetric and symmetric CH2− stretching vibration, these two peaks originated from the C–H in CPS.35 The presence of chlorine was confirmed by XPS measurement. As shown in Fig. 3, XPS survey spectrum of CPS-HNTs shows the oxygen peak at 531 eV, carbon peak at 283 eV, chlorine peak at 199 eV, silicon peak at 101 eV and aluminum peak at 74 eV.36,37 From the above results, silane coupling was successfully grafted onto HNTs. From FTIR of DMH-HNTs, an obvious absorption peak at 1721 cm−1 was observed, which was attributed to the C![[double bond, length as m-dash]](https://www.rsc.org/images/entities/char_e001.gif) O amide stretching of the hydantoin groups from DMH molecule.19 This result confirmed that DMH has been successfully grafted onto HNTs. Compared with DMH-HNTs, the absorption broad peak at 756 cm−1 become larger and wider in the FTIR of N-halamine@HNTs, which was due to the formation of N–Cl group after chlorination.15,19
O amide stretching of the hydantoin groups from DMH molecule.19 This result confirmed that DMH has been successfully grafted onto HNTs. Compared with DMH-HNTs, the absorption broad peak at 756 cm−1 become larger and wider in the FTIR of N-halamine@HNTs, which was due to the formation of N–Cl group after chlorination.15,19
Characterization of membranes
The ATR-FTIR spectra of pure PES membrane and hybrid membrane containing 3 wt% N-halamine@HNTs are shown in Fig. 4. It could be seen that the most significant change was the appearance of a new absorption peak at 3398 cm−1, which is the characteristic peak of –OH stretching vibration. These could be attributed to the presence of N-halamine@HNTs on the surface of the membrane. The same results have been obtained when the other hydrotropic substance were added into the membranes.31,38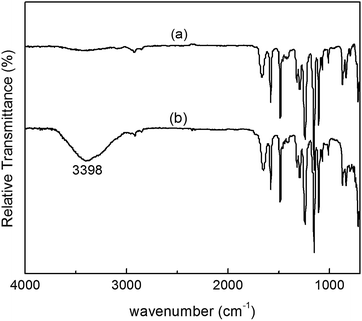 | ||
| Fig. 4 ATR-FTIR spectra of (a) pure PES membrane and (b) PES membrane containing 3% N-halamine@HNTs. | ||
The temperature dependency of storage modulus and the variation in tan![[thin space (1/6-em)]](https://www.rsc.org/images/entities/char_2009.gif) δ of virgin PES membrane and PES membrane containing 3 wt% N-halamine@HNTs were represented in Fig. 5. It was observed that the storage modulus increased after adding N-halamine@HNTs. This may be due to bulkiness of PES caused by bond formation between PES and HNTs.39 In all the cases, the storage modulus decreased with the increase in temperature and in particular, at 200–240 °C, there was significant fall in matrix modulus. It was also noted that the glass transition temperature (Tg) increased after adding HNTs. Tg for pure PES membrane was determined to be ca. 229 °C, whereas for PES membrane with containing 3 wt% N-halamine@HNTs, the temperature shifted to ca. 232 °C. This reflects an increased intermolecular association after adding HNTs. Also, the peak loss tangent values decreased after adding N-halamine@HNTs. This is probably due to the restriction of mobility of polymer chains caused by the adding HNTs.40
δ of virgin PES membrane and PES membrane containing 3 wt% N-halamine@HNTs were represented in Fig. 5. It was observed that the storage modulus increased after adding N-halamine@HNTs. This may be due to bulkiness of PES caused by bond formation between PES and HNTs.39 In all the cases, the storage modulus decreased with the increase in temperature and in particular, at 200–240 °C, there was significant fall in matrix modulus. It was also noted that the glass transition temperature (Tg) increased after adding HNTs. Tg for pure PES membrane was determined to be ca. 229 °C, whereas for PES membrane with containing 3 wt% N-halamine@HNTs, the temperature shifted to ca. 232 °C. This reflects an increased intermolecular association after adding HNTs. Also, the peak loss tangent values decreased after adding N-halamine@HNTs. This is probably due to the restriction of mobility of polymer chains caused by the adding HNTs.40
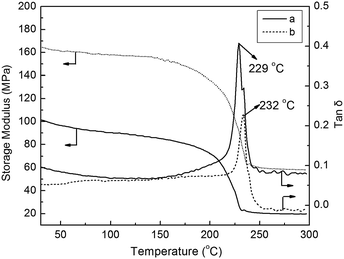 | ||
Fig. 5 Storage modulus and loss tangent (tan![[thin space (1/6-em)]](https://www.rsc.org/images/entities/char_2009.gif) δ) of (a) pure PES membrane and (b) PES membrane containing 3% N-halamine@HNTs. δ) of (a) pure PES membrane and (b) PES membrane containing 3% N-halamine@HNTs. | ||
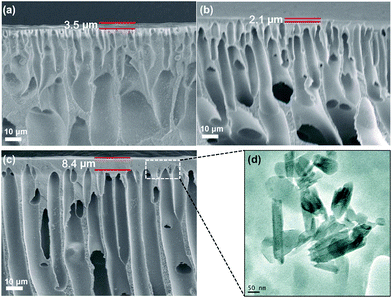
Fig. 6(a–c) shows the cross-section morphologies of the membranes. As shown in the images, all the membranes had a dense skin layer and a support layer with finger-like structure, which is the typical structure of asymmetric ultrafiltration membrane. However, the thickness of the top dense layer initially decreased (Fig. 6b) and then increased (Fig. 6c). This result might be explained by the fact that increasing the amount of N-halamine@HNTs in the casting solution to 1 wt% decreased the thickness of the top dense layer, due to the enhanced phase separation with N-halamine@HNTs. Further increases in N-halamine@HNTs amount led to a thicker skin layer, due to the delayed phase separation with increased viscosity.41,42 Moreover, TEM was used to study the presence of HNTs in PES matrix. In Fig. 6(d), the tubular structure of HNTs could be seen clearly, and these particles could be readily dispersed in the PES matrix.
The porosity and pore size information of the membranes are listed in Table 1. The porosity of all the membranes is nearly similar. But the mean pore size is initially increased and then decreased with increasing of N-halamine@HNTs. The addition of N-halamine@HNTs could promote a rapid phase separation, leading to the large pore formation in lower amount. However, excess amounts could result in the smaller pore size, which was caused by increased viscosity by addition of more N-halamine@HNTs. On the contrary, high viscosity could delay the phase separation and result in a smaller pore size.31,41
| N-Halamine@HNTs content/wt% | ε | rm/nm |
|---|---|---|
| 0 | 0.651 | 29.9 |
| 1 | 0.628 | 53.1 |
| 2 | 0.642 | 49.1 |
| 3 | 0.629 | 43.5 |
The water contact angle measurement is one of the methods for characterization the hydrophilic property of the membrane and the result was shown in Fig. 7. The water contact angle decreased with increasing of the N-halamine@HNTs content, which indicated that the membrane surface became more hydrophilic after adding N-halamine@HNTs. The lowest contact angle could reach to be 71.6° when the addition amount of N-halamine@HNTs was 3 wt%. It could be explained that N-halamine@HNTs had good hydrophilicity due to the presence of a great deal of hydroxyl groups on the surface of HNTs. In the phase inversion preparation of hybrid membranes, hydrophilic HNTs migrated spontaneously to the membrane/water interface to reduce the interface energy.31,41
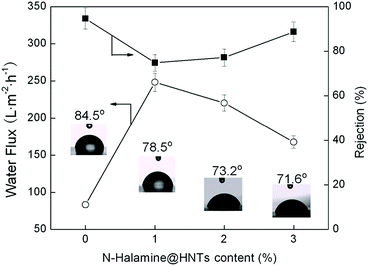 | ||
Fig. 7 Effect of N-halamine@HNTs content on the static water contact angle, the pure water permeation flux, and the rejection of PEG 20![[thin space (1/6-em)]](https://www.rsc.org/images/entities/char_2009.gif) 000 of the membranes. 000 of the membranes. | ||
The effect of N-halamine@HNTs content on the pure water flux and the rejection of PEG 20![[thin space (1/6-em)]](https://www.rsc.org/images/entities/char_2009.gif) 000 were shown in Fig. 7. The pure water flux reached a maximum as high as 248.3 L·m−2 h−1 when the N-halamine@HNTs content was 1% and then, the flux gradually decreased with increasing of the N-halamine@HNTs content. When the N-halamine@HNTs content reached to 3%, the flux was still 101% higher than that of the control PES membrane. Similar results have been reported by other researchers.31,41,42 The increase of the flux for the hybrid membranes is mainly because of the increase in hydrophilicity and pore size. For the membranes with the more N-halamine@HNTs content, although the hydrophilicity was improved, the water flux decreased. These findings revealed that the pore size had more significant effect rather than the hydrophilicity in the pure water flux.
000 were shown in Fig. 7. The pure water flux reached a maximum as high as 248.3 L·m−2 h−1 when the N-halamine@HNTs content was 1% and then, the flux gradually decreased with increasing of the N-halamine@HNTs content. When the N-halamine@HNTs content reached to 3%, the flux was still 101% higher than that of the control PES membrane. Similar results have been reported by other researchers.31,41,42 The increase of the flux for the hybrid membranes is mainly because of the increase in hydrophilicity and pore size. For the membranes with the more N-halamine@HNTs content, although the hydrophilicity was improved, the water flux decreased. These findings revealed that the pore size had more significant effect rather than the hydrophilicity in the pure water flux.
The rejection of PEG 20![[thin space (1/6-em)]](https://www.rsc.org/images/entities/char_2009.gif) 000 reached a minimum when the N-halamine@HNTs content was 1% and then increased gradually. These results indicate that low contents of N-halamine@HNTs could promote rapid phase separation, resulting in large pore formation. However, higher content of N-halamine@HNTs could decrease the pore size due to the increased viscosity of the polymer solution. They were also supported by the changes of membrane pore size. As shown in Table 1, the maximum pore size of the hybrid membrane was 53.1 nm. For comparison, the Flory radius for PEG 20
000 reached a minimum when the N-halamine@HNTs content was 1% and then increased gradually. These results indicate that low contents of N-halamine@HNTs could promote rapid phase separation, resulting in large pore formation. However, higher content of N-halamine@HNTs could decrease the pore size due to the increased viscosity of the polymer solution. They were also supported by the changes of membrane pore size. As shown in Table 1, the maximum pore size of the hybrid membrane was 53.1 nm. For comparison, the Flory radius for PEG 20![[thin space (1/6-em)]](https://www.rsc.org/images/entities/char_2009.gif) 000 with a mushroom-like configuration was only about 14 nm.43,44 The lowest rejections of the membranes for PEG 20
000 with a mushroom-like configuration was only about 14 nm.43,44 The lowest rejections of the membranes for PEG 20![[thin space (1/6-em)]](https://www.rsc.org/images/entities/char_2009.gif) 000 were 74.8%. This is reasonable, the configuration of PEG could be transformed from mushroom to brush regime, with long, thin bristles of PEG chains.43,44 According to the report of Sotto et al., the steric exclusion was the most important mechanism during PEG filtration experiments, and the rate of solute rejection should be determined by the ratio of pore and solute dimensions.45
000 were 74.8%. This is reasonable, the configuration of PEG could be transformed from mushroom to brush regime, with long, thin bristles of PEG chains.43,44 According to the report of Sotto et al., the steric exclusion was the most important mechanism during PEG filtration experiments, and the rate of solute rejection should be determined by the ratio of pore and solute dimensions.45
Fig. 8 displays three-dimensional AFM images of the membrane surfaces. In these images, the brightest area presents the highest point of the membrane surface and the dark regions indicate valleys or membrane pores. It can be seen that abundant nodular structure was formed in the top surface of pure PES membrane, whereas the hybrid membrane (containing 3 wt% N-halamine@HNTs) was smooth, which indicated that the modifications reduced the roughness of the membrane. Furthermore, the mean roughness (Ra) of the membranes was reduced from 9.6 nm for pure membrane to 2.1 nm for hybrid membrane. This finding is consistent with the other researchers who reported that the surface roughness of the pure membrane was higher than that of the hybrid membrane.10,31,46 It is well established that membrane with lower roughness and surface energy has stronger antifouling abilities.31,46 Therefore, it is important to fabricate a membrane with less surface energy and roughness to improve antifouling ability and performance of the membrane.
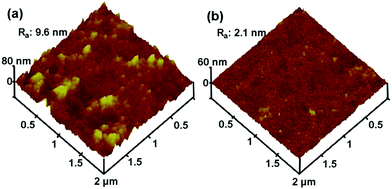 | ||
| Fig. 8 AFM surface images of the membranes: (a) pure PES membrane, (b) PES membrane with 3% of N-halamine@HNTs. | ||
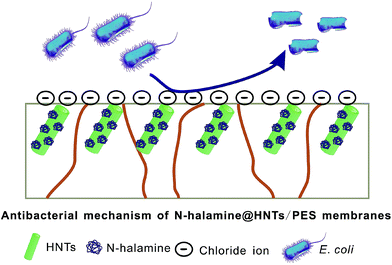
The antibacterial activity of the membranes against E. coli was tested by using SEM to study the morphology of cells on surface of the membranes, and the results were shown in Fig. 9(a). It can be seen that the surface morphology of the E. coli cells on pure PES membrane were intact, peritrichous and rod-shaped. It indicates that the PES membrane had no antibacterial activity, because the cells were healthy on the membrane surface. In contrast, the morphology of a large fraction of E. coli cells on the hybrid membrane was significantly damaged. This morphological change suggests that the intracellular contents had leaked out of the cells and gathered together owing to the damage and disorganization of the cell membrane of E. coli. The result shows that E. coli cells on the hybrid membrane lost the integrity of membranes, which was responsible for the bacteria-killing effect of the hybrid membrane. It is also proved that the PES did not have the antibacterial activity, so the antibacterial activity of the hybrid membranes was mainly caused by the N-halamine@HNTs.9 The antibacterial effect of the N-halamine@HNTs should be due to the chemical reaction involving the direct transfer of chloride ions from the N-halamines to the appropriate receptors in the cells. This chemical reaction can effectively destroy or inhibit metabolic cell processes, resulting in the expiration of the organisms. In addition, bacteriostasis rate was used to quantitatively analyze the antibacterial activity of the test membranes by the viable cell counting technique. As shown in Fig. 9(b), the number of colonies on the plates treated with N-halamine@HNTs/PES hybrid membranes decreased significantly with a high bacteriostasis rate against E. coli of 81.5%. The higher bacteriostasis rate demonstrates the better antibacterial ability and the above results suggested that N-halamine@HNTs/PES membrane has a preferable antibacterial ability which is reasonably attributed to the introduction of N-halamine@HNTs nanomaterial. The schematic illustration of antibacterial mechanism of the hybrid membranes is shown in Fig. 10.
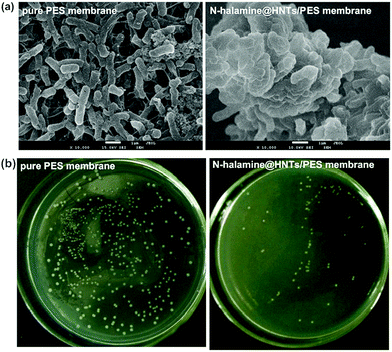 | ||
| Fig. 9 (a) SEM images of E. coli attached to pure PES membrane and PES membrane containing 3% N-halamine@HNTs; (b) measurement of antibacterial activity of the membranes by the bacteriostasis rate. | ||
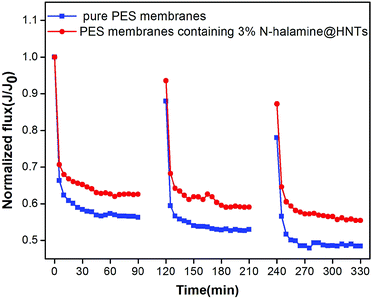
Normalized flux (J/J0) was used to analyze the antifouling performance of the tested membranes. As shown in Fig. 11, the flux for the membranes dropped dramatically by replacing pure water with the BSA solution, followed by a long period with a steady value. For pure PES membrane, J/J0 decreased sharply, due to severe fouling because PES is a hydrophobic polymer. However, the membranes containing 3 wt% N-halamine@HNTs showed lower flux decline than virgin PES membrane. It is suggested that the antifouling performance of the hybrid membranes was better than that of pure PES membrane. To quantitatively investigate the resistant fouling ability of the membrane, RFD value was calculated and the lower value of RFD implied the higher resistant fouling ability of the membrane.32 The RFD was 37.5% for the hybrid membranes, which was lower than that of pure PES membrane (43.7%). It is indicated that the hybrid membranes could maintain a higher flux in BSA UF process. In order to further verify the better antifouling performance for the hybrid membranes, the flux recovery ratio (RFR) after cleaning was analyzed for tested membranes. After cleaning with 0.1 M NaOH solution, the RFR were 88.0% and 93.6% for the pure PES membrane and the membrane containing 3 wt% N-halamine@HNTs, respectively. As the increase of operating time, the RFR decreases for both pure PES and hybrid membranes. However, at the end of the second cycle, the RFR for hybrid membranes were still higher than that of pure PES membrane. It is clear that the hybrid membranes modified by N-halamine@HNTs had better antifouling performance. These results may be attributed to the two factors. One is the higher hydrophilicity of N-halamine@HNTs modified PES membranes (as shown in Fig. 7), which would decrease the interaction between membrane surface and the proteins, the proteins sorption content on the membrane surface and membrane pore blocking decreases.31 Another is the smoother surface of the hybrid membranes (as shown in Fig. 8(b)), which could decrease trapping and aggregation of the foulants in the membrane pores and valleys of the surface.31
Conclusions
N-Halamine@HNTs/PES hybrid ultrafiltration membranes were prepared via phase inversion method by blending with different amounts of the N-halamine@HNTs particles in PES casting solution. FTIR and XPS analysis showed that the N-halamine@HNTs particles were successfully synthesized. TEM results confirmed the presence of N-halamine@HNTs particles in the PES polymer matrix. DMA tests implied that the hybrid membrane was thermo mechanically more stable than the pure PES membrane. AFM results indicated that the hybrid had lower surface roughness than the pure PES membrane. In addition, the hydrophilicity of membrane was enhanced by the addition of N-halamine@HNTs. The addition of N-halamine@HNTs enhanced the water flux of the membranes. Moreover, the antibacterial test revealed that the hybrid membranes had a good antibacterial performance. Thus, the hybrid membranes had a potential application to reduce bacterial fouling in membrane treatment of wastewater with relative high biological components.Acknowledgements
We gratefully acknowledge the support from National Natural Science Foundation of China (nos 21106137 and 21376225), and China Postdoctoral Science Foundation (nos 2014T70686 and 2013M531684). We sincerely acknowledge the financial assistance of visiting research program in University of New South Wales by the China Scholarship Council (CSC).Notes and references
- J. Qin, M. H. Oo and Y. Li, J. Membr. Sci., 2005, 247, 137–142 CrossRef CAS PubMed.
- M. Sun, Y. Su, C. Mu and Z. Jiang, Ind. Eng. Chem. Res., 2010, 49, 790–796 CrossRef CAS.
- W. Zhao, J. Huang, B. Fang, S. Nie, N. Yi, B. Su, H. Li and C. Zhao, J. Membr. Sci., 2011, 369, 258–266 CrossRef CAS PubMed.
- J. Huang, G. Arthanareeswaran and K. Zhang, Desalination, 2012, 285, 100–107 CrossRef CAS PubMed.
- X. Zhu, R. Bai, K. Wee, C. Liu and S. Tang, J. Membr. Sci., 2010, 363, 278–286 CrossRef CAS PubMed.
- Y. Yang, H. Hu, Y. Li, L. Wan and Z. Xu, J. Membr. Sci., 2011, 376, 132–141 CrossRef CAS PubMed.
- A. K. Singh, P. Singh, S. Mishra and V. K. Shahi, J. Mater. Chem., 2012, 22, 1834–1844 RSC.
- S. Ciston, R. M. Lueptow and K. A. Gray, J. Membr. Sci., 2008, 320, 101–107 CrossRef CAS PubMed.
- Y. Chen, J. Dang, Y. Zhang, H. Zhang and J. Liu, Water Sci. Technol., 2013, 67, 1519–1524 CrossRef CAS PubMed.
- Y. Chen, Y. Zhang, H. Zhang, J. Liu and C. Song, Chem. Eng. J., 2013, 228, 12–20 CrossRef CAS PubMed.
- Y. Chen, Y. Zhang, J. Liu, H. Zhang and K. Wang, Chem. Eng. J., 2012, 210, 298–308 CrossRef CAS PubMed.
- J. Dang, Y. Zhang, Z. Du, H. Zhang and J. Liu, Water Sci. Technol., 2012, 66, 799–803 CrossRef CAS PubMed.
- C. Yao, X. Li, K. G. Neoh, Z. Shi and E. T. Kang, J. Membr. Sci., 2008, 320, 259–267 CrossRef CAS PubMed.
- K. Tan and S. K. Obendorf, J. Membr. Sci., 2007, 289, 199–209 CrossRef CAS PubMed.
- A. Dong, S. Lan, J. Huang, T. Wang, T. Zhao, W. Wang, L. Xiao, X. Zheng, F. Liu, G. Gao and Y. Chen, J. Colloid Interface Sci., 2011, 364, 333–340 CrossRef CAS PubMed.
- H. B. Kocer, S. D. Worley, R. M. Broughton and T. S. Huang, React. Funct. Polym., 2011, 71, 561–568 CrossRef CAS PubMed.
- R. V. Padmanabhuni, J. Luo, Z. Cao and Y. Sun, Ind. Eng. Chem. Res., 2012, 51, 5148–5156 CrossRef CAS PubMed.
- Y. Chen and Q. Han, Appl. Surf. Sci., 2011, 257, 6034–6039 CrossRef CAS PubMed.
- A. Dong, S. Lan, J. Huang, T. Wang, T. Zhao, L. Xiao, W. Wang, X. Zheng, F. Liu, G. Gao and Y. Chen, ACS Appl. Mater. Interfaces, 2011, 3, 4228–4235 CAS.
- M. Du, B. Guo and D. Jia, Polym. Int., 2010, 59, 574–582 CAS.
- M. Du, B. Guo, Y. Lei, M. Liu and D. Jia, Polymer, 2008, 49, 4871–4876 CrossRef CAS PubMed.
- A. F. Ismail, S. A. Hashemifard and T. Matsuura, J. Membr. Sci., 2011, 379, 378–385 CrossRef CAS PubMed.
- B. Lecouvet, J. G. Gutierrez, M. Sclavons and C. Bailly, Polym. Degrad. Stab., 2011, 96, 226–235 CrossRef CAS PubMed.
- M. Liu, B. Guo, M. Du, X. Cai and D. Jia, Nanotechnology, 2007, 18, 455703 CrossRef.
- J. Zhang, Y. Zhang, Y. Chen, L. Du, B. Zhang, H. Zhang, J. Liu and K. Wang, Ind. Eng. Chem. Res., 2012, 51, 3081–3090 CrossRef CAS.
- J. Zhang, Y. Zhang, Y. Chen, S. Yi, B. Zhang, H. Zhang and J. Liu, Adv. Sci. Lett., 2012, 11, 57–62 CrossRef CAS PubMed.
- Z. Wang, H. Wang, J. Liu and Y. Zhang, Desalination, 2014, 344, 313–320 CrossRef CAS PubMed.
- H. Yu, Y. Zhang, X. Sun, J. Liu and H. Zhang, Chem. Eng. J., 2014, 237, 322–328 CrossRef CAS PubMed.
- J. Zhu, N. Guo, Y. Zhang, L. Yu and J. Liu, J. Membr. Sci., 2014, 465, 91–99 CrossRef CAS PubMed.
- J. Li, Z. Xu, H. Yang, L. Yu and M. Liu, Appl. Surf. Sci., 2009, 255, 4725–4732 CrossRef CAS PubMed.
- V. Vatanpour, S. S. Madaeni, L. Rajabi, S. Zinadini and A. A. Derakhshan, J. Membr. Sci., 2012, 401–402, 132–143 CrossRef CAS PubMed.
- T. Wang, Y. Wang, Y. Su and Z. Jiang, J. Membr. Sci., 2006, 280, 343–350 CrossRef CAS PubMed.
- S. Barrientos-Ramírez, G. M. Oca-Ramírez, E. V. Ramos-Fernández, A. Sepúlveda-Escribano, M. M. Pastor-Blas and A. González-Montie, Appl. Catal., A, 2011, 406, 22–33 CrossRef PubMed.
- S. Barrientos-Ramírez, E. V. Ramos-Fernández, J. Silvestre-Albero, A. Sepúlveda-Escribano, M. M. Pastor-Blas and A. González-Montiel, Microporous Mesoporous Mater., 2009, 120, 132–140 CrossRef PubMed.
- J. Wang, X. Zhang, B. Zhang, Y. Zhao, R. Zhai, J. Liu and R. Chen, Desalination, 2010, 259, 22–28 CrossRef CAS PubMed.
- Z. C. Liu, Y. F. Luo, Z. X. Jia, B. C. Zhong, S. Q. Li, B. C. Guo and D. M. Jia, eXPRESS Polym. Lett., 2011, 5, 591–603 CrossRef.
- A. Siokou and S. Ntais, Surf. Sci., 2003, 540, 379–388 CrossRef CAS.
- Z. Meng, H. Liu, Y. Liu, J. Zhang, S. Yu, F. Cui, N. Ren and J. Ma, J. Membr. Sci., 2011, 372, 165–171 CrossRef CAS PubMed.
- S. K. J. Rahaman, M. Mukherjee and G. Sarkhel, Int. J. Polym. Mater., 2012, 61, 655–668 CrossRef CAS.
- L. Unnikrishnan, S. K. Nayak, S. Mohanty and G. Sarkhel, Polym.-Plast. Technol. Eng., 2010, 49, 1419–1427 CrossRef CAS.
- E. Celik, H. Park, H. Choi and H. Choi, Water Res., 2011, 45, 274–282 CrossRef CAS PubMed.
- S. Majeed, D. Fierro, K. Buhr, J. Wind, B. Du, A. Boschetti-de-Fierro and V. Abetz, J. Membr. Sci., 2012, 403–404, 101–109 CrossRef CAS PubMed.
- J. V. Jokerst, T. Lobovkina, R. N. Zare and S. S. Gambhir, Nanomedicine, 2011, 6, 715–728 CrossRef CAS PubMed.
- D. Marsh, R. Bartucci and L. Sportelli, Biochim. Biophys. Acta, 2003, 1615, 33–59 CrossRef CAS.
- A. Sotto, A. Boromand, R. Zhang, P. Luis, J. M. Arsuaga and J. Kim, J. Colloid Interface Sci., 2011, 363, 540–550 CrossRef CAS PubMed.
- A. Razmjou, J. Mansouri and V. Chen, J. Membr. Sci., 2011, 378, 73–84 CrossRef CAS PubMed.
| This journal is © The Royal Society of Chemistry 2015 |

