
Transcriptome analysis reveals the oxidative stress response in Saccharomyces cerevisiae†
Hongwei Zhao,
Jingyu Chen,
Jingjing Liu and
Beizhong Han*
Beijing Laboratory for Food Quality and Safety, College of Food Science and Nutritional Engineering, China Agricultural University, Beijing, 100083, China. E-mail: hbz@cau.edu.cn; Fax: +86 10 62737078; Tel: +86 10 62737078
First published on 24th February 2015
Abstract
The oxidation stress tolerance of Saccharomyces cerevisiae was improved by global transcription machinery engineering in our previous work. To explore the global perturbation induced by the mutant transcription factor Taf25, an RNA-Seq based gene expression analysis was conducted. Compared to the control strain, a total of 1006 genes with significantly differential expression levels were identified in the mutant strain taf25-3 upon oxidation stress. Fifteen transcription factor-encoding genes were determined, most of which displayed consistent up-regulated signature expressions in response to the challenge of 2 mM H2O2. Based on GO and KEGG enrichment analysis, the identified genes were involved in many metabolic pathways including carbon metabolism, fatty acid degradation, peroxisomal, and synthesis of several amino acids. The genes related to MAP kinase and cAMP-dependent protein kinase A (PKA) signaling pathways were also enriched significantly. The results suggested that the MAP kinase and PKA signaling pathways could be involved in mediation of yeast tolerance against oxidation stress, especially the mating regulation module in MAP kinase which could be reprogrammed by mutation of transcription factor Taf25 in yeast.
Introduction
Molecular oxygen can be used as an electron acceptor for respiration or oxidation of nutrients by almost all aerobic organisms to generate energy.1 During the reduction, the molecular oxygen could be reduced to not only water, but also some reactive oxygen species (ROS) such as superoxide anion radicals (O2˙−), hydrogen peroxide (H2O2) and hydroxyl radicals (˙OH). These ROS could pose damages on almost cell components including DNA, protein and lipid membrane. Besides the damage of the cell components, ROS could also trigger the activation of specific signaling pathways. Both of the two effects pose serious influences on numerous cellular processes related to ageing and/or the age-related diseases.2,3 To survive, cells have developed the intricate antioxidant defense system including superoxide dismutase, catalase, and several peroxidases.1 Other non-enzymatic, low molecular mass antioxidants such as ascorbate, tocopherol, uric acid, t-carotene and glutathione also play an important role in scavenging ROS.4 Under some extreme environmental conditions, such as heat, low pH, osmolality, radiation, the balance between ROS production and antioxidant defenses will be disturbed and then the oxidation stress can be generated.5 How to improve the balance-maintain ability in cells has becoming a hotspot in medical, agricultural and food research areas.In our previous work, global transcription machinery engineering (gTME) was employed to improve the oxidative stress tolerance in Saccharomyces cerevisiae.6 Random mutations were introduced into Taf25, the TATA-binding protein-associated factor. After screening from the mutation library, a mutant, strain taf25-3, showed improved adaptation ability to H2O2-induced oxidative stress and higher fermentation efficiency. Several amino acid substitutions in Taf25 including D106Y, R108Q, Q158R, P160T, K180I and L188P were observed.6 These mutation sites could change the RNA polymerase II-mediated mRNA gene transcription profiles and modify the cellular oxidation defense systems to improve the anti-oxidation ability.7
To uncover the regulation mechanism, RNA sequencing (RNA-Seq) technique was used to explore the global perturbations of cell transcription profile resulted from the mutation of Taf25. RNA-Seq is based on high-throughput DNA sequencing techniques and rapidly becoming the method for transcriptional profiling experiments. In contrast to Sanger sequencing- and microarray-based methods, RNA-Seq shows some advantages such as identification of novel transcripts, circumvents background noise associated with fluorescence quantification and far higher resolutions.8 In this study, the transcriptome profiles of S. cerevisiae mutant strain and wild-type strain with or without oxidation stress were analyzed. The mutant strain showed a specific pattern of gene expression in response to oxidative environment. Meanwhile, Gene Ontology (GO) and KEGG pathway enrichment analysis of the identified genes were also carried out to understand the gene functions and metabolic pathways. This work could provide a strong basis to understand the response mechanism of S. cerevisiae to oxidation stress from a systemic view and could be helpful to develop the more tolerant strain in industry.
Materials and methods
Strains and culture conditions
Strain taf25-3 and the negative control strain were employed in our current study. Strain taf25-3 is a mutant strain originated from S. cerevisiae BY4741 (MATa; his3Δ1; leu2Δ0; met15Δ0; ura3Δ0). It was obtained by gTME method that a pZHW4 plasmid carrying the mutated TATA-binding protein-associated factor Taf25 was introduced into the cell. The oxidation stress tolerance of strain taf25-3 was improved. The negative control strain was generated by introducing only the blank pZHW4 plasmid. The detailed information about the construction and screening of the mutant strain was fully elucidated in our previous work.6 Cells were pre-grown at 28 °C on an orbital shaker (200 rpm) in 50 mL SC-URA medium (6.7 g L−1 yeast nitrogen base, 20 g L−1 glucose, a mixture of appropriate nucleotides and amino acids without URA) to get the fresh inoculum. The freshly grown cells were inoculated in 100 mL SC-URA medium supplemented with or without 2 mM hydrogen peroxide (30% (w/w) in H2O, Sigma-Aldrich, Beijing, China) in 250 mL flask. The rubber stoppers with small-bore needle were employed in the flasks to generate micro-aerobic conditions. The initial cell density of OD600 was around 0.05, which equaled to 0.0543 g L−1 dry cell weight (DCW). The control group was set up using the control strain as per the same method. Two biological replicates were prepared under each condition. The samples were taken at the specific time intervals to measure DCW. After entering the mid-exponential phase for each group (DCW was about 0.6 g L−1), the cells were collected and washed twice using deionized water by centrifugation. The collected cells were then immediately frozen in liquid nitrogen and stored in −80 °C until use for the RNA isolation.RNA isolation and examination
Total RNA was isolated and purified using RNeasy Mini Kit (QIAGEN, Alameda, USA) as per the production protocol. RNA degradation and contamination was monitored on 1% agarose gels. RNA purity was checked using the NanoPhotometer® spectrophotometer (IMPLEN, CA, USA). RNA concentration was measured using Qubit® RNA Assay Kit in Qubit® 2.0 Flurometer (Life Technologies, CA, USA). RNA integrity was assessed using the RNA Nano 6000 Assay Kit of the Bioanalyzer 2100 system (Agilent Technologies, CA, USA).Library preparation for digital gene expression (DGE) sequencing
A total amount of 3 μg RNA of each sample was used for the RNA sample preparations. Sequencing libraries were generated using NEBNext® Ultra™ RNA Library Prep Kit for Illumina® (NEB, USA) following manufacturer's instruction and index codes were added to attribute sequences to each sample. Briefly, mRNA was purified from total RNA using poly-T oligo-attached magnetic beads. Fragmentation was carried out using divalent cations under elevated temperature in NEBNext First Strand Synthesis Reaction Buffer (5×). First strand cDNA was synthesized using random hexamer primer and M-MuLV Reverse Transcriptase (RNase H−). Second strand cDNA synthesis was subsequently performed using DNA polymerase I and RNase H. Remaining overhangs were converted into blunt ends via exonuclease/polymerase activities. After adenylation of 3'ends of DNA fragments, NEBNext Adaptor with hairpin loop structure were ligated to prepare for hybridization. In order to select cDNA fragments of preferentially 150–200 bp in length, the library fragments were purified with AMPure XP system (Beckman Coulter, Beverly, USA). Then 3 μl USER Enzyme (NEB, USA) was used with size-selected, adaptor-ligated cDNA at 37 °C for 15 min followed by 5 min at 95 °C before PCR. Then PCR was performed with Phusion High-Fidelity DNA polymerase, Universal PCR primers and Index (X) Primer. At last, PCR products were purified (AMPure XP system) and library quality was assessed on the Agilent Bioanalyzer 2100 system (Agilent Technologies, Palo Alto, USA). The clustering of the index-coded samples was performed on a cBot Cluster Generation System using TruSeq PE Cluster Kit v3-cBot-HS (Illumina Inc., San Diego, CA, USA) according to the manufacturer's instructions. After cluster generation, the library preparations were sequenced on an Illumina Hiseq 2000 platform and 50 bp single-end reads were generated.Transcriptome analysis
Raw data (raw reads) were refined by removing reads that containing adapter, ploy-N and low quality reads to generate the clean data. All the downstream analyses were based on the clean data with high quality.For the reads mapping, the reference genome and gene model annotation files of S. cerevisiae were downloaded from the Saccharomyces Genome Database (SGD) http://www.yeastgenome.org/download-data/sequence. Single-end clean reads were aligned to the reference genome using Bowtie v2.0.6. RPKM referred to the reads per kilo-base of exon model per million mapped reads. Prior to differential gene expression analysis, HTSeq v0.5.4p3 was used to count the reads numbers mapped to each gene. And then the RPKM of each gene was calculated based on the length of the gene and reads count mapped to this gene.9 For each sequenced library, the read counts were adjusted using the edgeR software package through a one-scaling normalized factor.10 Differential expression analysis between the two assigned groups was performed using the DESeq R package (1.10.1) as described by Anders and Huber.11 The Benjamini and Hochberg adjusted P-values was used for controlling the false discovery rate. Genes with an adjusted P-value <0.05 were assigned as differentially expressed.12
Gene ontology (GO) was implemented using the GOseq R package, in which gene length bias was adjusted.13 GO terms with corrected P-value less than 0.05 were considered significantly enriched by differential expressed genes.
In order to examine the associated pathways and functions in the differential expressed genes, KOBAS software 2.0 was employed in KEGG pathway mapping analysis.14
Results
Illumina sequencing and reads quality evaluation
To obtain an overview of gene expression profiles in the mutation strain taf25-3 and control strain pZHW4 with or without H2O2 stress, eight total RNA samples were isolated respectively. The quality of the RNA samples were examined (ESI† file S5) and then equal amounts of total RNA samples were mixed for Illumina sequencing. The overall quality of the data was evaluated, as shown in Table 1; more than 10 million clean reads with an average length of 50 bp for each group were generated. The total raw data was deposited in NCBI's Gene Expression Omnibus (GEO) public archive database and the accession number is GSE63163. The base calling accuracy was measured by the Phred quality score (Q score).15 The Q scores are logarithmically related to the base calling error probabilities P:Q = −10![[thin space (1/6-em)]](https://www.rsc.org/images/entities/char_2009.gif) log10P log10P |
| Sample namea | Raw reads | Clean reads | Clean bases | Error rate (%) | Q20b (%) | Q30b (%) |
|---|---|---|---|---|---|---|
| a nHP_M: mutant group without oxidative stress; nHP_C: control group without oxidative stress; HP_M: mutant group with oxidative stress; HP_C: control group with oxidative stress. Each group has two biological replicates.b Q20, Q30 refer to the proportion of base calls with Phred scores >20 or 30 in the total bases. | ||||||
| nHP_M_1 | 10472693 |
10373570 |
0.52G | 0.01 | 98.80 | 96.63 |
| nHP_M_2 | 11309038 |
11202075 |
0.56G | 0.01 | 98.63 | 96.53 |
| nHP_C_1 | 11575105 |
11454892 |
0.57G | 0.01 | 98.74 | 95.88 |
| nHP_C_2 | 11715749 |
11575215 |
0.58G | 0.01 | 98.75 | 95.91 |
| HP_C_1 | 10887303 |
10727147 |
0.54G | 0.01 | 98.74 | 95.91 |
| HP_C_2 | 14444268 |
14282065 |
0.71G | 0.01 | 98.78 | 96.02 |
| HP_M_1 | 13100975 |
12927198 |
0.65G | 0.01 | 98.71 | 95.77 |
| HP_M_2 | 11481341 |
11357002 |
0.57G | 0.01 | 98.77 | 95.99 |
For example, if the Phred assigns a Q score of 30 (Q30), this is equivalent to the probability of an error base call 1 in 1000 times (Table 2), meaning that the base calling accuracy is 99.9%. As shown in Table 1, nearly all bases have Phred quality score >30. It indicated that the base calling accuracy for each group was about 99.9% and sequencing data are useable for the next sequence analysis.
| Phred quality score | Probability of incorrect base calling | Base calling accuracy |
|---|---|---|
| 10 | 1 in 10 | 90% |
| 20 | 1 in 100 | 99% |
| 30 | 1 in 1000 | 99.9% |
| 40 | 1 in 10000 |
99.99% |
To measure the sample quality of the biological replicates for each group, the Pearson correlation coefficients R2 were calculated.16 As shown in Fig. 1, the coefficients R2 between the replicates for each group were greater than 0.98, ranging from 0.982 to 0.987. It indicated that there were no significant differences between the biological replicates and the data could be employed for following analysis.
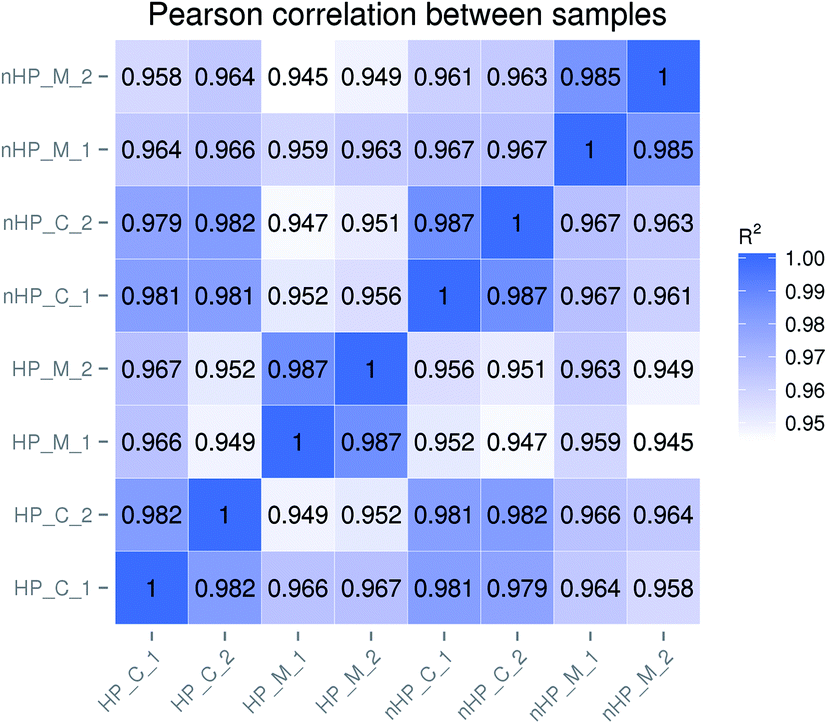 | ||
| Fig. 1 Correlation based reproducibility and reliability assays of each sample. Two biological replicates were prepared for each sample. The RPKM of each gene in the eight samples were calculated as per the Material and methods section. The log10(RPKM + 1) were used to calculate the Pearson correlation coefficient R2. The sequencing data with a coefficient R2 > 0.8 was considered to be high quality. nHP_M stands for mutant strain taf25-3 without oxidative stress; nHP_C stands for control strain pZHW4 without oxidative stress; HP_M stands for mutant strain taf25-3 with oxidative stress; HP_C stands for control strain pZHW4 with oxidative stress. | ||
Overview of transcriptomics analysis
The growth curves and gene expression patterns of the two strains under two conditions (with and without H2O2 stress) were illustrated in Fig. 2 and 3, respectively. Under oxidative stress condition, the growth of the two strains was restricted obviously. However, strain taf25-3 performed the improved survival ability and grew faster than control strain, with a 4 hour lead entering the exponential phase (Fig. 2). Referred to the differences of the transcript expressions between the two strains under oxidation stress, a total of 1006 genes with significantly different expression levels were identified. Among these genes, there were 670 up-regulated genes and 336 down-regulated genes (Fig. 3a). Without H2O2 stress, there was no significant difference in the growth phenotype between the two strains, however, the transcriptomic profiles of genes showed different trends (Fig. 2 and 3b). There were 1023 differential expressed genes, in which 635 were up-regulated and 388 were down-regulated. A total of 2665 genes were identified and showed differential expression signatures up on the H2O2 challenge in mutant strain; however, there were just 98 genes performed differential expression in the control strain (Fig. 3c and d). It indicated that, compared to the control strain, the mutated transcription factor taf25p in mutant strain could regulate more genes related to the oxidation stress response.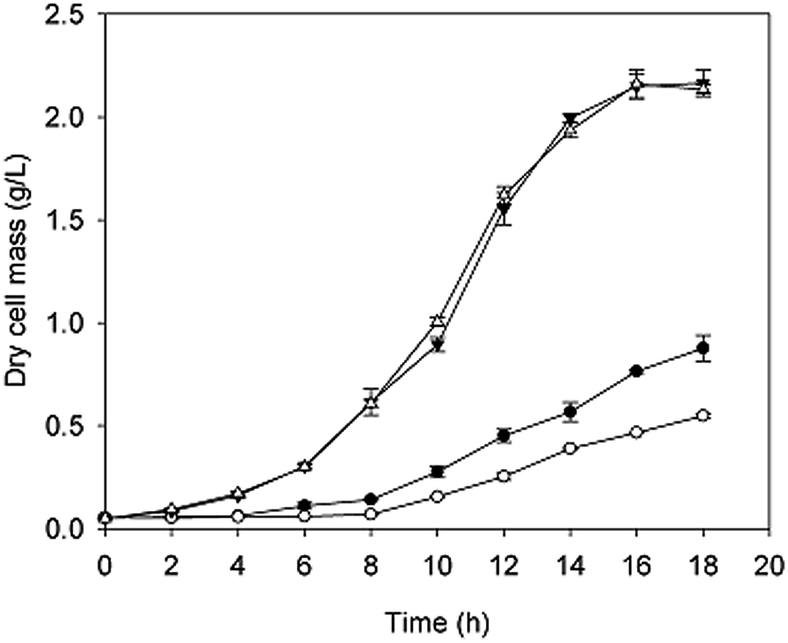 | ||
| Fig. 2 The growth curves of the mutant strain taf25-3 and control strain pZHW4 with or without oxidation stress. Four groups were set up: strain taf25-3 with H2O2 (●), strain taf25-3 without H2O2 (▼), strain pZHW4 with H2O2 (○) and strain pZHW4 without H2O2 (△). The four groups were grown in SC-Ura medium with or without H2O2, respectively, at 28 °C in a shaker (200 rpm). Five milliliter samples of each group were taken to measure the DCW over time. Two biological replicates were prepared for each strain and the data were shown as means ± SD. | ||
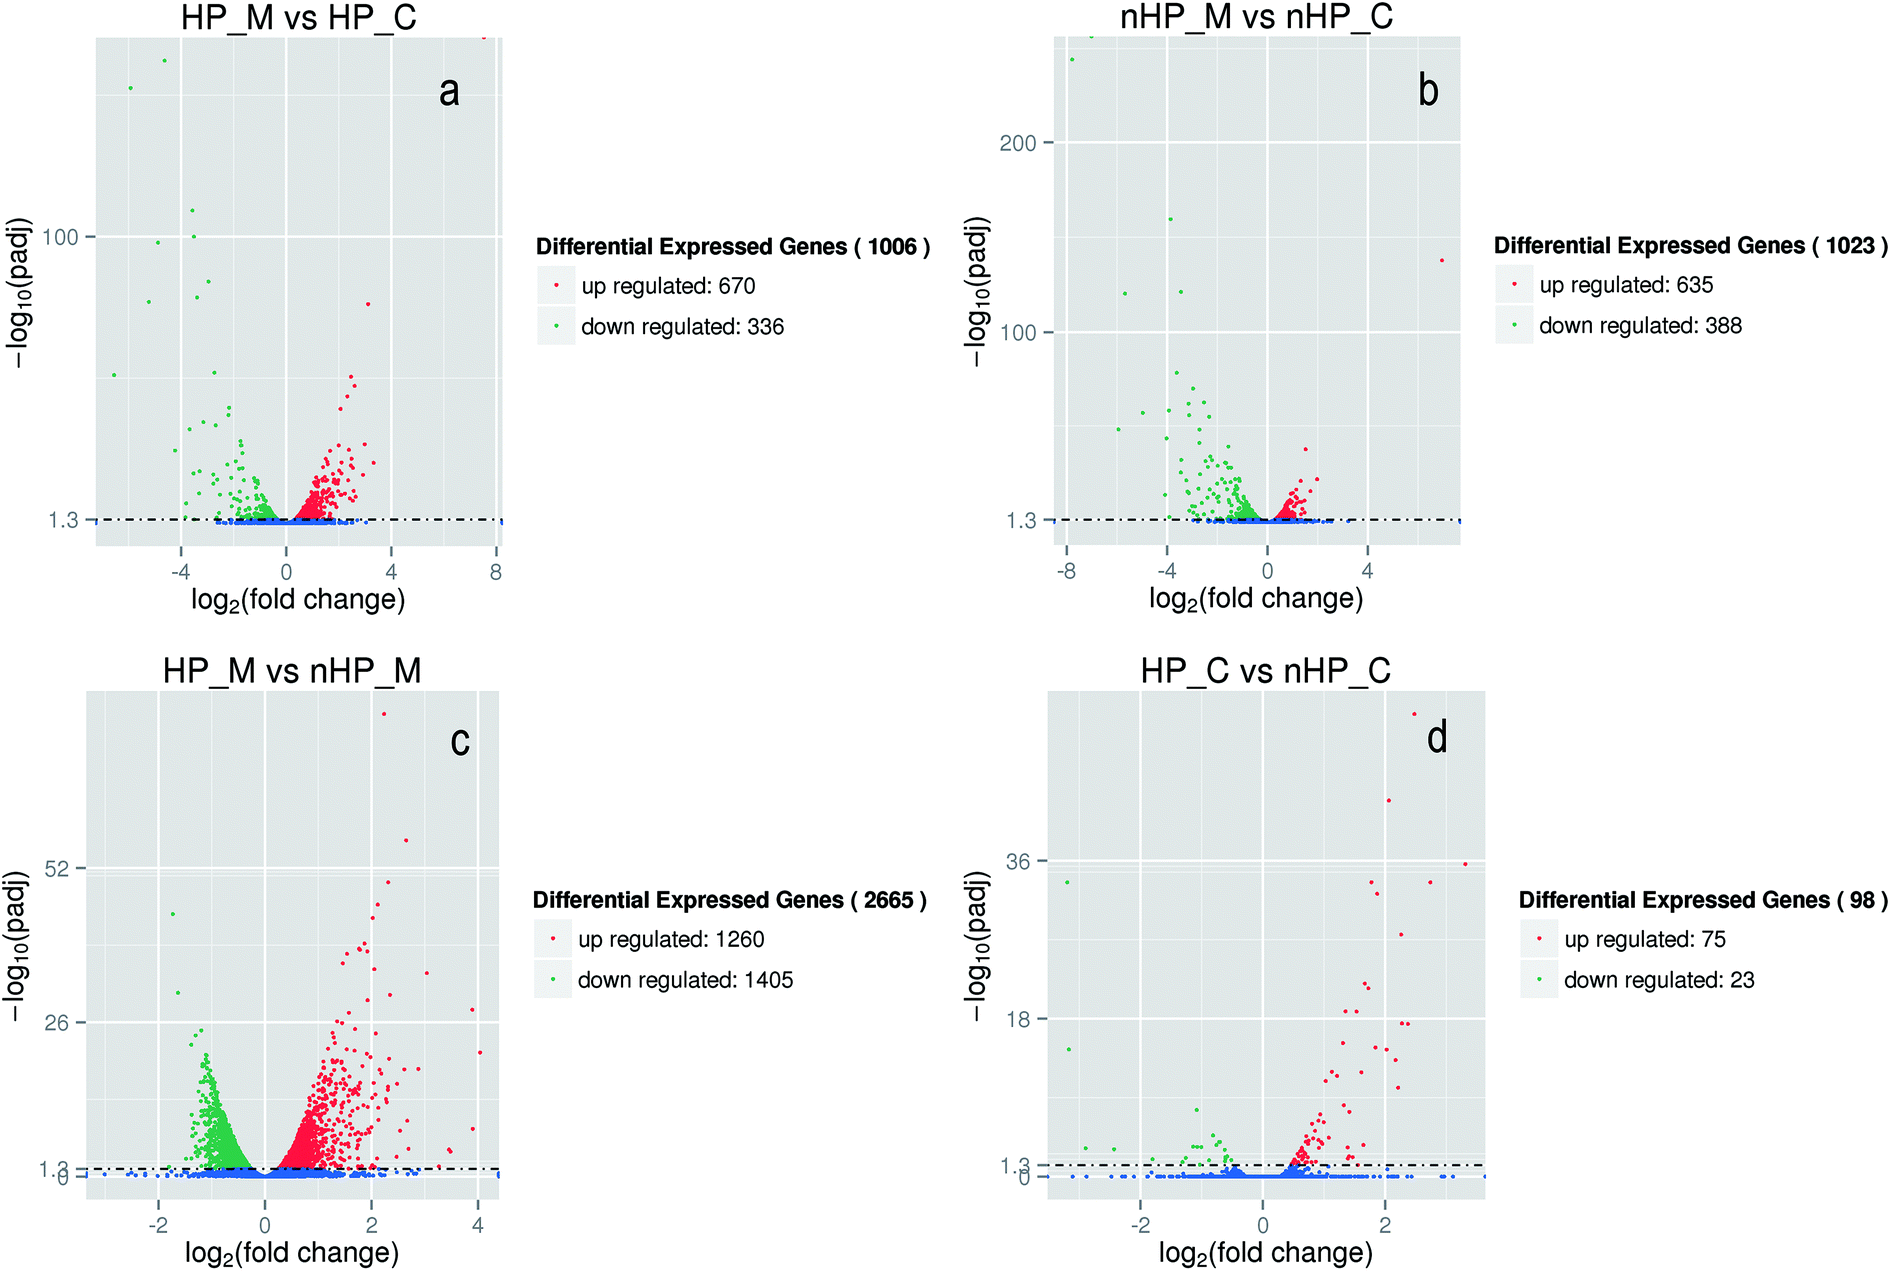 | ||
| Fig. 3 Overview of the differential expressed genes for each comparison samples. nHP_M stands for mutant strain taf25-3 without oxidative stress; nHP_C stands for control strain pZHW4 without oxidative stress; HP_M stands for mutant strain taf25-3 with oxidative stress; HP_C stands for control strain pZHW4 with oxidative stress. | ||
Among the differentially expressed genes in strain taf25-3 under the two conditions (oxidation and non-oxidation stress), thirty transcription factor-encoding genes were identified including TFC3, YRR1, TAF10, YAP2, YAP5, YAP8, SPT6, SPT8, ZAP1, HMS1, MSA2, STP2, HAP1, etc. Fifteen of the them were also found both in the mutant strain and control strain upon the oxidation stress, such as TFC3, YRR1, TAF10, YAP2, YAP5, YAP8, ZAP1, STP2, etc. (ESI† Tables S1 and S2). The overlapped transcription factors could reprogram the gene expression patterns induced by the mutation of Taf25 in the mutant strain.
GO enrichment analysis of the differentially expressed genes
To obtain the functional information of the identified genes, gene annotation including homologous protein annotation was performed using GO database. Based on sequence homology, the identified genes could be grouped into categories by some common biological properties including biological process, cellular component and molecular function.13 For example, in the presence of oxidation stress, the differentially expressed genes between strain taf25-3 and control strain were categorized into two groups including biological process and cellular component. In the biological process group, single-organism metabolic process, small molecule metabolic process and catabolic process are the three main subcategories; in the cellular component category, extracellular region, cell wall, external encapsulating structures are the three main subcategories. Compared to the control strain, nearly all of the genes related to monocarboxylic acid metabolic process, fatty acid catabolic process, peroxisomal matrix and micro-body lumen were up-regulated in the mutant strain upon the H2O2 treatment (Fig. 4). The GO enrichment analysis for other group comparisons was shown in ESI† Fig. S1–S3.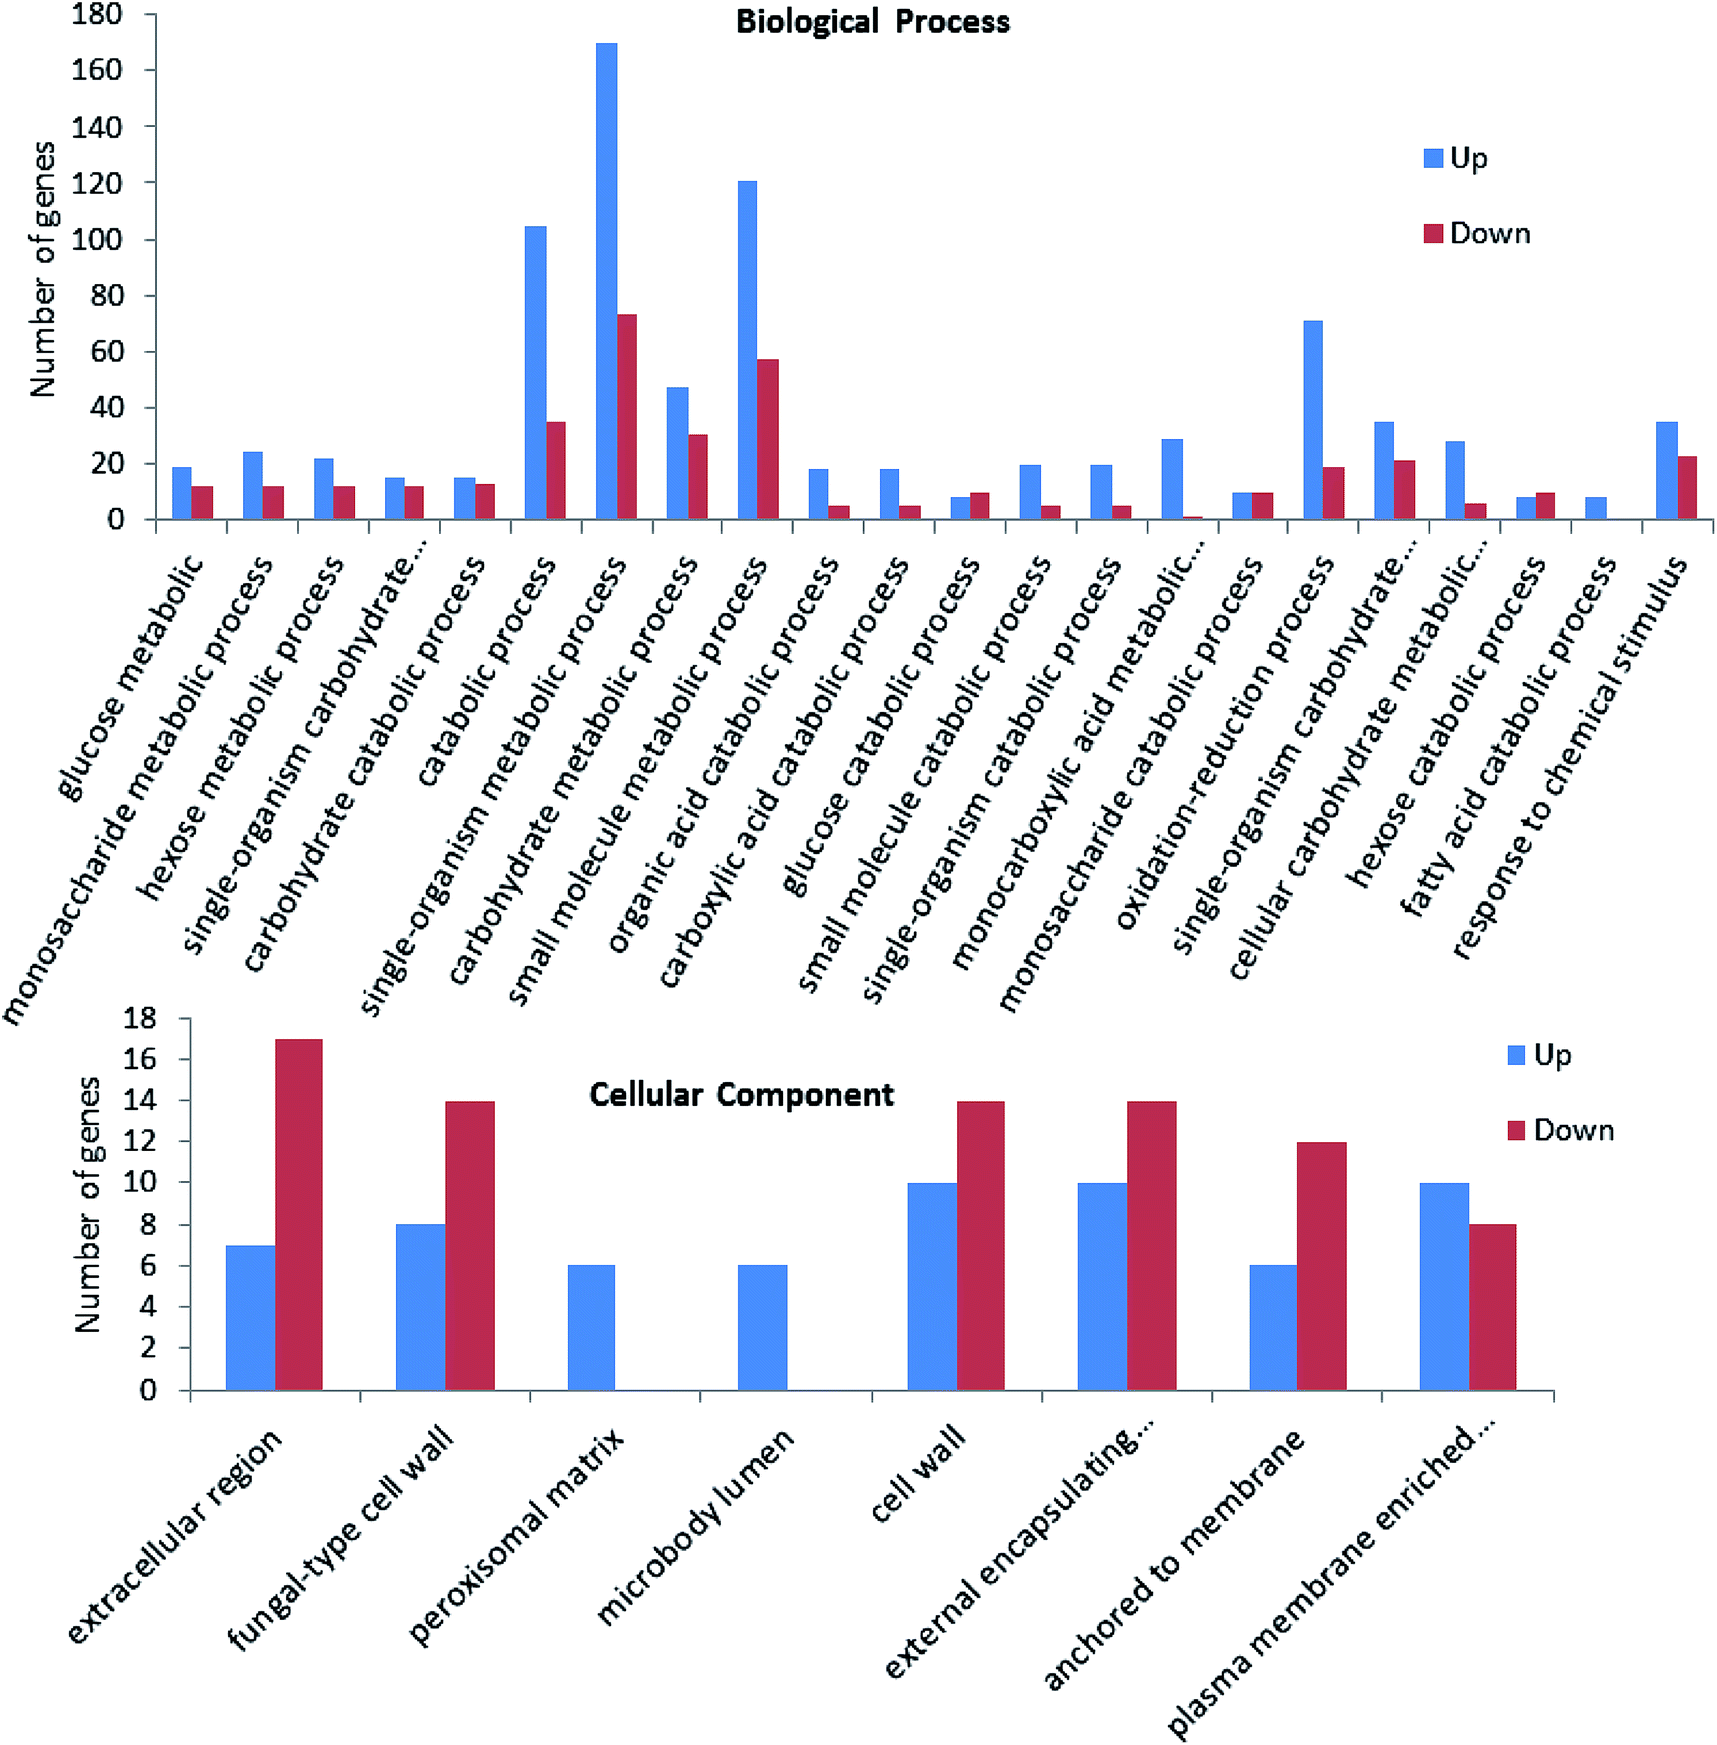 | ||
| Fig. 4 GO enrichment analysis of the differential expressed genes between taf25-3 and pZHW4 under oxidation condition. | ||
The metabolic pathways related to oxidation stress tolerance
To understand the basic mechanism of oxidation stress tolerance in yeast; the main metabolic or signaling pathways were enriched using the KEGG database. In the comparison between oxidation and non-oxidation conditions, top 20 enriched pathways were identified in the strain taf25-3 mainly including proteasome, pyrimidine metabolism, RNA polymerase, fatty acid metabolism, nitrogen metabolism, peroxisome, glycolysis/gluconeogenesis, pentose phosphate pathway, alanine, aspartate and glutamate metabolism (Table S3†). Seven of them were also significantly enriched (corrected P-value <0.05) between strain taf25-3 and pZHW4 under oxidation stress (Table 3). All the genes related to the peroxisome synthesis and fatty acid degradation pathway were all up-regulated in the mutant strain such as PEX genes encoding peroxins that are required for the biogenesis and proliferation of peroxisomes; and FAA2 encoding medium-chain fatty acid-CoA ligase that direct the fatty acids to beta-oxidation pathways. Gene expression patterns among other pathways also showed significant differences between the two strains under oxidation stress. For example, in the pyruvate metabolism pathway, PYK1 gene, also known as CDC19 encoding pyruvate kinase, was down-regulated; whereas, PYC2 encoding pyruvate carboxylase was up-regulated in the mutant strain; all the genes encoding the rate-limiting enzymes such as HXK2, PYK1 and PFK2 in glycolysis were down-regulated; however, ACS1 gene encoding acetyl-CoA synthetase was significantly up-regulated. The significant transcription perturbations related to two signaling pathways were observed: mitogen-activated protein kinases (MAP kinase) pathway and protein kinase A (PKA) pathway against oxidation stress in mutant strain (Table 4). For example, in MAP kinase signaling pathway, MF(ALPHA)2, MFA1, STE3, STE7, FUS1, RLM1, FKS2, GLO1 and CTT1 related to the four identified MAP kinase pathways were all up-regulated; in PKA pathway, three important genes involved with the signal receiving and transduction were identified, such as GPR1 encoding the novel G protein-coupled receptor Gpr1 and TPK1 and TPK2 encoding cAMP-dependent PKA kinase catalytic subunit were all up-regulated significantly.| Gene name | Description | Regulationa | Corrected P-valueb |
|---|---|---|---|
| a “+” means up-regulated genes; “−” means down-regulated genes.b Hypergeometric test was used for statistical analysis. P-values have been corrected for multiple testing by the Benjamini and. Hochberg adjustment method. A corrected P value of <0.05 was considered statistically significant. | |||
| Carbohydrates metabolism | |||
| SOL2 | 6-Phosphogluconolactonase-like protein 2 | + | 7.7791 × 10⁻³ |
| HXK2 | Hexokinase 2 | − | 4.0877 × 10⁻³ |
| TKL2 | Transketolase | + | 1.64 × 10⁻⁷ |
| FBA1 | Fructose-bisphosphate aldolase | − | 9.042 × 10⁻³ |
| DAK2 | Dihydroxyacetone kinase | + | 1.38 × 10⁻⁵ |
| NQM1 | Transaldolase of unknown function | + | 6.12 × 10⁻⁶ |
| SER3 | Phosphoglycerate dehydrogenase | + | 7.6871 × 10⁻³ |
| TDH3 | Glyceraldehyde-3-phosphate dehydrogenase 3 | − | 2.6261 × 10⁻² |
| PGK1 | Phosphoglycerate kinase | − | 2.5359 × 10⁻³ |
| CIT3 | Citrate synthase 3 | + | 4.72 × 10⁻¹⁰ |
| IDP2 | Isocitrate dehydrogenase (NADP+) | + | 2.4446 × 10⁻⁴ |
| LSC2 | Beta subunit of succinyl-CoA ligase | + | 5.92 × 10⁻⁵ |
| Fatty acid degradation | |||
| FAA2 | Medium-chain fatty acid-CoA ligase | + | 3.95 × 10⁻¹⁸ |
| POX1 | Acyl-CoA oxidase | + | 1.31 × 10⁻¹⁷ |
| POT1 | Acetyl-CoA C-acyltransferase | + | 5.20 × 10⁻¹² |
| ALD3 | Aldehyde dehydrogenase | + | 4.7296 × 10⁻⁴ |
| Glycolysis/Gluconeogenesis | |||
| PGM1 | Phosphoglucomutase | − | 6.6566 × 10⁻⁴ |
| HXK2 | Hexokinase isoenzyme 2 | − | 4.0877 × 10⁻³ |
| PGI1 | Glucose-6-phosphate isomerase | − | 4.7537 × 10⁻³ |
| PFK2 | 6-Phosphofructokinase subunit beta | − | 2.2431 × 10⁻² |
| FBP1 | Fructose 1,6-bisphosphate 1-phosphatase | + | 3.6132 × 10⁻³ |
| FBA1 | Fructose 1,6-bisphosphate aldolase | − | 9.042 × 10⁻³ |
| TPI1 | Triosephosphate isomerase | − | 3.269 × 10⁻³ |
| GLD1 | Glyceraldehyde-3-phosphate dehydrogenase | − | 2.6261 × 10⁻² |
| PGK1 | Phosphoglycerate kinase | − | 2.5359 × 10⁻³ |
| ERR3 | Phosphopyruvate hydratase 3 | + | 3.2338 × 10⁻³ |
| PCK1 | Phosphoenolpyruvate carboxykinase | + | 6.91 × 10⁻²⁸ |
| PYK1 | Pyruvate kinase | − | 1.5692 × 10⁻³ |
| ACS1 | Acetyl CoA synthetase | + | 1.35 × 10⁻¹⁰ |
| Peroxisome | |||
| PEX1 | Participates in the recycling of Pex5p from the peroxisomal membrane to the cystosol | + | 1.969 × 10⁻⁴ |
| PEX3 | Peroxisomal membrane protein | + | 6.9282 × 10⁻³ |
| PEX5 | Peroxisomal membrane signal receptor for peroxisomal matrix proteins | + | 2.59 × 10⁻⁷ |
| PEX7 | Peroxisomal signal receptor | + | 2.6645 × 10⁻² |
| CAT1 | Peroxisomal catalase | + | 4.43 × 10⁻¹¹ |
| YAT1 | Outer mitochondrial carnitine acetyltransferase | + | 1.1166 × 10⁻² |
| PXA2 | Subunit of a heterodimeric peroxisomal ABC transport complex | + | 3.03 × 10⁻²³ |
| SPS19 | Peroxisomal 2,4-dienoyl-CoA reductase | + | 2.19 × 10⁻⁸ |
| SYM1 | Protein required for ethanol metabolism; induced by heat shock | + | 9.901 × 10⁻³ |
| Pyruvate metabolism | |||
| PYK1 | Pyruvate kinase | − | 1.5692 × 10⁻³ |
| PCK1 | Phosphoenolpyruvate carboxykinase | + | 6.91 × 10⁻²⁸ |
| GLO1 | Lactoylglutathione lyase | + | 1.24 × 10⁻¹¹ |
| CYB2 | L-Lactate dehydrogenase | + | 5.10 × 10⁻²⁰ |
| PYC2 | Pyruvate carboxylase | + | 8.13 × 10⁻⁵ |
| MDH3 | Malate dehydrogenase | + | 4.9805 × 10⁻² |
| DAL7 | Malate synthase | + | 7.6862 × 10⁻³ |
| CHA1 | L-Serine/L-threonine ammonia-lyase | − | 7.5739 × 10⁻⁴ |
| Alanine, aspartate and glutamate metabolism | |||
| ALT2 | Probable alanine aminotransferase | + | 1.1946 × 10⁻⁴ |
| ASP1 | L-Asparaginase | − | 1.5237 × 10⁻² |
| ARG4 | Argininosuccinate lyase | − | 2.8704 × 10⁻² |
| GAD1 | Glutamate decarboxylase | + | 2.9446 × 10⁻² |
| GDH3 | NADP-specific glutamate dehydrogenase | + | 2.54 × 10⁻²¹ |
| GDH2 | NAD-specific glutamate dehydrogenase | + | 2.24 × 10⁻⁸ |
| GLT1 | Glutamate synthase (NADH) | − | 4.0113 × 10⁻² |
| Gene name | Description | Regulationa | Corrected P-valueb |
|---|---|---|---|
| a “+” means up-regulated genes; “−” means down-regulated genes.b Hypergeometric test was used for statistical analysis. P-values have been corrected for multiple testing by the Benjamini and. Hochberg adjustment method. A corrected P value of <0.05 was considered statistically significant, and the smaller the P-value, the more significant the expression differences of the related genes in the metabolic pathway. The genes were sorted based on the significance in each pathway. | |||
| MAPK signaling pathway | |||
| FUS1 | MAP kinase involved in mating | + | 4.80 × 10⁻¹⁰ |
| GLO1 | Lactoylglutathione lyase | + | 3.32 × 10⁻⁸ |
| CTT1 | Catalase T | + | 9.13 × 10⁻⁶ |
| STE7 | MAP kinase kinase | + | 1.0773 × 10⁻⁴ |
| MAF1 | Mating pheromone A-factor | + | 4.8256 × 10⁻⁴ |
| STE3 | Pheromone a factor receptor | + | 1.1696 × 10⁻³ |
| TEC1 | Transcriptional enhancer factor | + | 4.9044 × 10⁻³ |
| RLM1 | MADS-box transcription factor | + | 1.2157 × 10⁻² |
| MAF2 | Mating pheromone alpha-factor | + | 4.5106 × 10⁻² |
| FAR1 | Cyclin-dependent kinase inhibitor | − | 7.29 × 10⁻¹⁹ |
| FKS2 | 1,3-Beta-glucan synthase | + | 1.94 × 10⁻⁹ |
| WSC2 | Cell wall integrity and stress response component | − | 2.6254 × 10⁻⁴ |
| STE12 | Transcription factor that is activated by a MAPK signaling cascade | − | 3.0176 × 10⁻⁴ |
| SHO1 | Osmosensor | − | 3.6818 × 10⁻⁴ |
| FKS1 | 1,3-Beta-glucan synthase component | − | 1.5021 × 10⁻³ |
| RHO1 | GTP-binding protein | − | 3.0637 × 10⁻² |
| PKA signaling pathway | |||
| TPK2 | cAMP-dependent protein kinase type 2 | + | 2.5761 × 10⁻³ |
| TPK1 | cAMP-dependent protein kinase type 1 | + | 1.2152 × 10⁻² |
| GPR1 | Novel G protein-coupled receptor Gpr1 | + | 4.572 × 10⁻² |
Based on the GO and KEGG enrichment analysis, the global perturbation in strain taf25-3 cells induced by the mutation of transcription factor Taf25 in response to oxidation stress was investigated. As shown in Fig. 5, after the redox balance was broken in cytoplasm, the oxidation stress was generated and detected by the sensor-like proteins located at the cell surface. For MAP kinase pathway, Ste2 or Ste3 sensors were used to transfer the stress signals into cytoplasm, which could cooperated with other Ste-family proteins to stimulate the MAPK module MKKK Ste11/MKK Ste7/MAPK Fus3. During the signaling transduction, MFA1, STE3, STE7 and FUS1 were up-regulated significantly upon the oxidation stress; however, the genes related to other MAP kinase pathways such as the sensor encoding gene WSC2 for cell wall integrity and SHO1 for osmosensor were down-regulated significantly. At the downstream of the MAP kinase, RLM1 encoding the MADS-box transcription factor to regulated the transcription of GSC2 for cell wall remodeling, GLO1 and CTT1 for osmolyte synthesis regulation, and transcription factor TEC1 for filamentation were all up-regulated. It was indicated that in order to respond to the oxidation stress, yeast cell might reprogram the gene expression to optimize the signaling transduction for more efficient and effective adaptation. In the PKA pathway, the oxidation stress was received by a novel G protein-coupled receptor Gpr1 encoded by gene GPR1 interacted with a heterotrimeric G protein α subunit Gpa2. Then the adenylyl cyclase Cyr1p was activated by the stimulated G protein to regulate the cyclic AMP (cAMP) production. The increased level of cAMP triggered the PKA kinase into active state to conduct the consequent signaling. The results showed that in response to the oxidation stress, gene SGT1 (encoding Cyr1p) and gene TPK1 and TPK2 (encoding cAMP-dependent PKA kinase catalytic subunits) were significantly up-regulated. After the oxidation stress signaling was transmitted into cytoplasm via the PKA kinase pathway and/or MAP kinase pathway, cells will conduct a global regulation of metabolic process including carbohydrates, fatty acid, peroxisomal, pyruvate metabolism, alanine, aspartate and glutamate metabolism, proteasome.
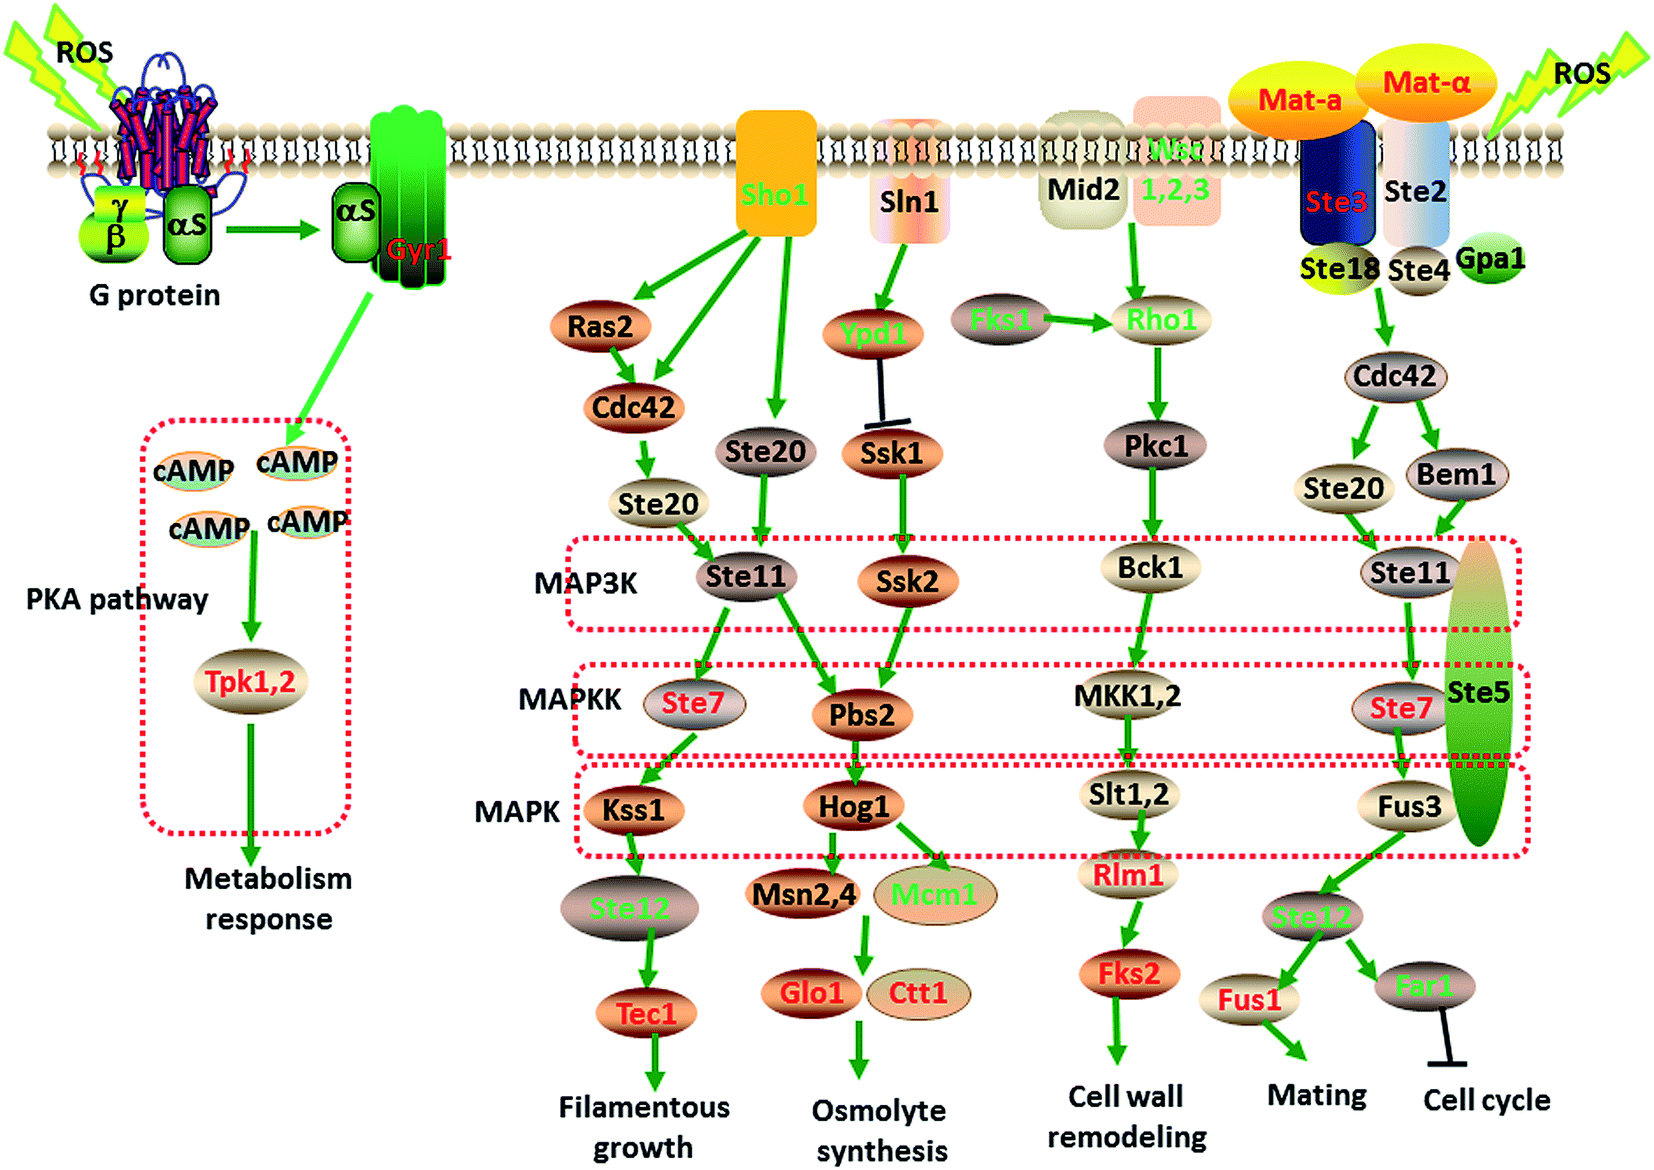 | ||
| Fig. 5 The putative signaling pathways in yeast cell against the oxidation stress. MAP kinase and PKA signaling pathway were identified based on KEGG enrichment analysis of the differential expressed genes. The up-regulated genes were in red color and down-regulated genes were in green color. | ||
Discussion
Environmental stress tolerances for yeast cells survival are not operated in isolated linear metabolic or signaling pathways. Rather, the global responses are associated with a much larger stress signaling network that integrates information from many pathways.17 Therefore, a systematic analysis method is required to observe the intracellular global regulation patterns. Transcriptome analyses could be considered as a convenient and efficient method to understand the whole regulation network in the cells. Many of these experiments had been conducted using microarray gene expression approaches.18–21 Although some significant changes in gene expression resulting from ethanol, heat, high osmolarity and oxidation stresses were identified in these studies, the development of next generation RNA-seq technologies offer opportunities to more accurately quantify those differences.8In this study, we report the first application of Illumina RNA-seq technology to pursue the analysis of global regulation network in the response of S. cerevisiae to oxidation stress and find some key pathways related to oxidation stress tolerance. Two strains, mutant strain taf25-3 with higher H2O2 tolerance ability and one control strain pZHW4, were employed under oxidation and non-oxidation conditions respectively. The following two comparison groups were used for analysis: (1) the mutant strain taf25-3 with and without oxidation stress (0 mM and 2 mM H2O2), named as Group 1; (2) the mutant strain taf25-3 and the control strain under oxidation condition (2 mM H2O2), named as Group 2. Through the two aspects of analysis the key metabolic pathways against oxidation stress and the global perturbation induced by the mutant transcription factors Taf25 could be identified. Transcriptional profiling in Group 1 revealed that the mutant strain taf25-3 exhibited differential expression of thousands of genes upon the oxidation stress (2 mM H2O2). Many of them were transcription factors-encoding genes, e.g. TFC3, YRR1, TAF10, YAP2, YAP5, SPT8 and HAP1. Their functions were related to rDNA and/or RNA polymerase transcription regulation as activator or repressor. All of them could be considered as the important gene expression regulators in response to the oxidation stress, especially the overlapped ones between Group 1 and Group 2 (Tables S1 and S2†), because the enhanced oxidation stress tolerance in mutant strain was probably resulted from the reprogrammed patterns of these overlapped genes induced by the mutation of Taf25. TAFs have the HAT subunits which can acetylate histones and nucleosomes.22 The acetylation of histones within chromatin has been proved to be the central switch to modulate the gene transcriptions.23 TAF10 encodes the subunit (145 kDa) of TFIID and SAGA complexes involved in RNA polymerase II transcription initiation and in chromatin modification.24 In this study, TAF10 was significantly up-regulated in the mutant strain, which might promote the global gene transcriptions and enhance the synthesis efficiency of some anti-oxidant proteins or intermediary metabolites. Yap proteins (Yap1 to Yap8) belong to the b-ZIP super family of specific transcription factors (TFs) that are known to be involved in the response to many environmental stress,25 for examples, genes related to oxidative stress response such as TRX2 (thioredoxin) and GSH1 (γ-glutamylcysteine synthase) could be activated by Yap1p;26 Yap2p, also known as Cad1p, plays a role in the response to toxic compounds such as cadmium;27 Yap5p has been proved to be related to the iron metabolism and storage; Yap8p has a central role in the detoxification of arsenic stress.28 In our study, we identified three Yap proteins (Yap2, Yap5 and Yap8) with enhanced expression patterns through the two groups (ESI† Tables S1 and S2). It indicated that Yap2, Yap5 and Yap8 could also relate to oxidation stress response.
Apart from the important transcription factors, many differential expressed genes participating into cell metabolism or signaling pathways were also identified. Hundreds of unclassified genes or genes with unknown functions were also found and some of them were overlapped between the two analysis groups. The transcription reprogramming in the mutant strain taf25-3 was quite broad, yet it exhibited some enrichment of certain function categories such as carbon metabolic process, fatty acid metabolism, peroxisomal matrix, MAPK signaling pathway as well as alanine, aspartate and glutamate metabolism (Tables S3† and 4). These pathways constituted a complex network in response to the oxidation stress.
Energy is necessary for growth of yeast cells, especially under environmental stress conditions. Cells need to choose the most efficient route to generate energy or reduce ATP consumption to prevent futile cycling and maintain energy reserves under environmental stress conditions.29 It was showed that the metabolic flux was slowed down in glycolysis pathway, but was enhanced in TCA cycle. It could be illustrated by the conversed transcription patterns of the two pathways. Nearly all of the genes in glycolysis were down-regulated (Table 3), such as HXK2 (encoding hexokinase), PFK2 (encoding 6-phosphofructokinase) and PYK1 (encoding pyruvate kinase), because of the low efficiency of ATP production. To produce enough energy, cells turned to the TCA cycle and fatty acid degradation. The expression levels of the genes related to the two pathways were significantly increased (Table 3). In TCA cycle isocitrate dehydrogenase encoded by gene IDP could catalyze the oxidation of isocitrate to alpha-ketoglutarate converting NAD+ to NADH in the mitochondria, which is considered as the key rate-limiting step of the TCA cycle.30 This reaction could be stimulated by the simple mechanisms of substrate availability (isocitrate, NAD+ or NADP+, Mg2+/Mn2+) and inhibited by the end products (NADH or NADPH and alpha-ketoglutarate).31 Under oxidation stress the intracellular redox balance was damaged and it could lead to the increased NAD+ catabolism.32 High level of intracellular NAD+ could stimulate the oxidation of isocitrate to alpha-ketoglutarate. The up-regulated IDP in mutant strain could provide enough isocitrate dehydrogenase in the TCA cycle to facilitate reaction for redox re-balance and energy production (Table 3).
In the fatty acid degradation metabolism, all of the identified genes such as FAA2, POX1, POT1 and ALD3 were up-regulated in the mutant strain upon the oxidation stress (Table 3). Acyl-CoA synthetase Faa2p (encoded by FAA2) could activate the medium-chain fatty acids inside peroxisomes and direct fatty acids to beta-oxidation pathways.33 Furthermore, overexpression of Faa2p can rescue the cells from heat stress damage to the membrane phospholipids due to activation of an endogenous pool of C14:0.34 Acyl-CoA oxidase encoded by gene POX1 was proved to have the function of oleic acid consumption by yeast as a sole source.35 This study indicated that higher expression level of these genes could pose positive regulations to the fatty acid oxidation and provide sufficient energy and intermediate metabolites for cell growth.
Reactive oxygen species (ROS) are not only derived from extracellular environment, but continuously generated within living systems, especially from the mitochondria where many oxidative metabolisms take place.6 It has been proved that oxidative stress is coupled to the oxidative degradation of lipid membranes and over 200 types of aldehydes could be generated during this process.36 Many of them are highly reactive and have been implicated in oxidative stress-associated diseases in human.37 Aldehyde dehydrogenases (encoded by ALD) superfamily contains NAD (P)+-dependent enzymes that could scavenge endogenous and exogenous aldehydes to mitigate oxidative/electrophilic stress in prokaryotic and eukaryotic organisms.36 Another specific function among aldehyde dehydrogenases is the involvement of beta-alanine biosynthesis, an important intermediate in pantothenic acid (vitamin B5) and CoA biosynthesis.38 The up-regulated genes such as ALD2, ALD3, and ALD4 in the mutant strain might facilitate the cells to struggle the oxidation damage through the above putative pathways strain (Table 3).
Peroxisomes, also known as micro-bodies, are organelles found in nearly all eukaryotic cells involved in the catabolism of fatty acid and D-amino acids, biosynthesis of plasmalogens and pentose phosphate pathway. A total of 32 peroxisomal proteins (encoded by PEX genes) have been identified, which participate in the process of peroxisome assembly.39 PEX5 and PEX7 are the peroxisomal membrane signal receptors receiving the signal from C-terminal tripeptide signal sequence (PTS1 or PTS2) to regulate the construction of peroxisomal protein system. Deficient expression of PEX5 gene could lead to the decreased resistance to ethanol stress in budding yeast.40 In this study, the enhanced signature expressions of PEX5 and PEX7 under H2O2 stress exposure suggested that there might be an oxidation stress-induced mechanism for the peroxisomal proteins synthesis (Table 3). It is very important for the removal of the superoxide radicals (O2−˙) and H2O2, because the peroxisomes contain catalase and superoxide dismutases (SODs) playing an important role in protecting cells against the ROS damages.39 This putative response mechanism could also be supported by the increased expression level of CAT1 (catalase encoding gene) in the mutant stains (Table 3).
Numerous metabolic pathways and regulatory genes have been reported affecting yeast tolerance to environmental stress.41 However, roles of MAP kinase pathway, especially in tolerance to H2O2 induced oxidation stresses, remain largely unknown. Under H2O2 stress condition, the genes related to the MAP kinase signaling pathways showed differential expressed patterns in the mutant strain (Table 4). The oxidation responses might be involved in at least four MAP kinase pathways through the analysis of GO and KEGG pathway enrichments from both of the two groups. MF(ALPHA)2, MFA1, STE3, STE7 and FUS1 related to the mating and cell cycle response, RLM1and FKS2 in the cell wall integrity pathway, GLO1 and CTT1 in osmolarity glycerol pathway as well as the filamentous growth pathway related genes STE7 and TEC1, showed consistently enhanced expression patterns in response to oxidation stress (Table 4). The other normally expressed or down-regulated genes related to the four MAP kinase pathways are also important and necessary to keep the interaction flow globally for cells survival under oxidation stress. The observations showed that STE3 encoding the receptor for pheromone A-factor was significantly up-regulated under oxidation stress (Table 4). It indicated that Ste2 or Ste3 could not only be involved in mating regulation, but be used as the oxidation stress sensors in yeast cells.42 It is well known that the mating response to generate diploids is controlled by the alpha-pheromones and A-pheromones that bind to the transmembrane receptors Ste2 and Ste3, respectively, which are coupled to a heterotrimeric G-protein.43 At this point it could be deduced that the oxidation response and matting response share the same MAP kinase module MKKK Ste11/MKK Ste7/MAPK Fus3. There should be an unknown mechanism of the stimulation of alpha-pheromones and A-pheromones by ROS particles. In order to save energy and raw materials for other bio-macromolecules synthesis, yeast cells reprogrammed and optimized the gene expression level of other MAP kinase module. For example, RHO1 encoding Rho family GTPase that belongs to the upstream activator in hypotonic shock MAP kinase module was down-regulated; MCM1 encoding pheromone receptor transcription factor that involved in osmoregulation were also down-regulated (Table 4). Through the MAP kinase signaling pathway cells could be survival under oxidation stress by reprogramming the whole metabolic pathways including cell cycle, cell wall modification, energy metabolism, anti-oxidant biosynthesis, glutamate metabolism and the amino acids biosynthesis.
Another signaling pathway, PKA pathway, was identified from Group 1 but not from Group 2. In the PKA pathway, a novel G protein-coupled receptor Gpr1 encoded by gene GPR1 was up-regulated in the mutant strain upon the oxidation stress compared to that under non-oxidation stress (Table 4), which could deduce that the Gpr1 could not only monitor the nutritional signal, but extracellular oxidation stress. Via a heterotrimeric G protein α subunit Gpa2 the signal could be transmitted to Cyr1p (adenylyl cyclase) which regulate the cyclic AMP (cAMP) production. The increased level of cAMP triggered the PKA kinase into the active state to conduct the consequent signaling; because the PKA kinase catalytic subunits encoded by TPK1 and TPK2 are cAMP-dependent proteins.44 TPK1 and TPK2 were significantly up-regulated in response to oxidation stress in Group one but not Group two indicating that the PKA signaling pathway was a universal signaling pathway that existed in both mutant strain and control strain, and this signal transduction manner could not be improved by the mutation of the general transcription factor Taf25.
Apart from the mechanisms discussed above, there were many other putative changes in the metabolism patterns. For example, the enhanced pentose phosphate metabolic pathway which could provide enough reducing power in the form of NADPH for cellular redox balance;45 the enhanced anaplerotic reaction for oxaloacetate and acetyl-CoA synthesis which could provide enough raw materials for TCA cycle that is critical for energy production and other biomacromolecules synthesis such as protein, nucleic acid or fatty acid;46 the overexpressed glutathione S-transferases that has been proved to contribute to resistance to multiple environmental stress including oxidative stress47 and the up-regulated proteins for nucleotide excision repair that could eliminate the RNA or DNA damage possessed by ROS.6
Conclusions
During the growth and fermentation process, yeast cells could encounter many kinds of environmental stress factors including ethanol, heat, low pH, ROS particles and osmotic shock, especially the ROS, because the ROS stress could be triggered by other stress factors. Research and development of yeast tolerance to multiple stress factors is critical but difficult due to the knowledge limitations about the global metabolic landscapes. In our previous work we enhanced the oxidation stress tolerance of a laboratory yeast strain BY4741 by using global transcription machinery engineering method. In order to explore the putative mechanism of the phenotype improvement we conducted the differential gene expression analysis based on the next RNA-seq method in this study. This work provides the first systemic insight into the differences in the transcription level regarding to oxidation stress tolerance. Based on the GO and KEGG pathway enrichments analysis, the identified genes were clustered into many important metabolic pathways such as carbohydrate, fatty acid, peroxisome, amino acid and nucleotide repair. In addition, two signaling pathways (MAP kinase and PKA pathways) were also enriched in yeast cells against oxidation stress. These findings provided a clear regulation network in response to oxidation stress and uncovered the putative mechanisms of phenotype improvement induced by the mutation of the general transcription factor Taf25 in S. cerevisiae. This will be helpful for designing more tolerant strains to produce ethanol or other bio-products in industry through a more rational way.Acknowledgements
The part of bioinformatics analysis in this work was conducted at the Novogene Bioinformatics Technology Co., Ltd in Beijing. The authors thank their assistance for this part of the work. This work was supported by the National Natural Science Foundation of China [31101237]; and the Earmarked Fund for Modern Agro-Industry Technology Research System, China [nycytx-30-ch-03].References
- S. Izawa, Y. Inoue and A. Kimura, FEBS Lett., 1995, 368, 73 CrossRef CAS.
- V. I. Lushchak, T. V. Bagnyukova, V. V. Husak, L. I. Luzhna, O. V. Lushchak and K. B. Storey, Int. J. Biochem. Cell Biol., 2005, 37, 1670 CrossRef CAS PubMed.
- T. Finkel and N. J. Holbrook, Nature, 2000, 408, 239 CrossRef CAS PubMed.
- V. Lobo, A. Patil, A. Phatak and N. Chandra, Pharmacogn. Rev., 2010, 4, 118 CrossRef CAS PubMed.
- B. Poljsak, D. Šuput and I. Milisav, Oxid. Med. Cell. Longevity, 2013, 2013, 1 CrossRef PubMed.
- H. Zhao, J. Li, B. Han, X. Li and J. Chen, J. Ind. Microbiol. Biotechnol., 2014, 41, 869 CrossRef CAS PubMed.
- J. Kirchner, S. I. Sanders, E. Klebanow and P. A. Weil, Mol. Cell. Biol., 2001, 21, 6668 CrossRef CAS.
- I. Nookaew, M. Papini, N. Pornputtapong, G. Scalcinati, L. Fagerberg, M. Uhlén and J. Nielsen, Nucleic Acids Res., 2012, 40, 10084 CrossRef CAS PubMed.
- A. Mortazavi, B. A Williams, K. McCue, L. Schaeffer and B. Wold, Nat. Methods, 2008, 5, 621 CrossRef CAS PubMed.
- M. D. Robinson, D. J. McCarthy and G. K. Smyth, Bioinformatics, 2010, 26, 139 CrossRef CAS PubMed.
- S. Anders and W. Huber, Genome Biol., 2010, 11, 4 CrossRef PubMed.
- A. Reiner, D. Yekutieli and Y. Benjamini, Bioinformatics, 2003, 19, 368 CrossRef CAS PubMed.
- C. Trapnell, B. A. Williams, G. Pertea, A. Mortazavi, G. Kwan, M. J. van Baren, S. L. Salzberg, B. J. Wold and L. Pachter, Nat. Biotechnol., 2010, 28, 511 CrossRef CAS PubMed.
- C. Xie, X. Mao, J. Huang, Y. Ding, J. Wu, S. Dong, L. Kong, G. Gao, C. Y. Li and L. Wei, Nucleic Acids Res., 2011, 39, W316 CrossRef CAS PubMed.
- M. C. Frith, R. Wan and P. Horton, Nucleic Acids Res., 2010, 38, e100 CrossRef PubMed.
- Y. Ding, X. Zhang, K. W. Tham and P. Z. Qin, Nucleic Acids Res., 2014, 42, e140 CrossRef PubMed.
- N. Suzuki, L. Rizhsky, H. Liang, J. Shuman, V. Shulaev and R. Mittler, Plant Physiol., 2005, 139, 1313 CrossRef CAS PubMed.
- D. Chen, C. R. M. Wilkinson, S. Watt, C. J. Penkett, W. M. Toone, N. Jones and J. Bahler, Mol. Biol. Cell, 2008, 19, 308 CrossRef CAS PubMed.
- S. Hohmann, Microbiol. Mol. Biol. Rev., 2002, 66, 300 CrossRef CAS.
- J. Y. Kwon, M. Hong, M. S. Choi, S. Kang, K. Duke, S. Kim, S. Lee and J. Lee, Genomics, 2004, 83, 600 CrossRef CAS PubMed.
- B. Nota, N. M. van Straalen, B. Ylstra, D. Roelofs and D. Roelofs, Insect Mol. Biol., 2010, 19, 315 CrossRef CAS PubMed.
- M. Brand, K. Yamamoto, A. Staub and L. Tora, J. Biol. Chem., 1999, 274, 18285 CrossRef CAS PubMed.
- A. Eberharter and P. B. Becker, EMBO Rep., 2002, 3, 224 CrossRef CAS PubMed.
- A. Kobayashi, T. Miyake, M. Kawaichi and T. Kokubo, Nucleic Acids Res., 2003, 31, 1261 CrossRef CAS PubMed.
- C. Rodrigues-Pousada, R. A. Menezes and C. Pimentel, Yeast, 2010, 27, 245 CrossRef CAS PubMed.
- S. Kuge and N. Jones, EMBO J., 1994, 13, 655 CAS.
- D. Azevedo, L. Nascimento, J. Labarre, M. B. Toledano and C. Rodrigues-Pousada, FEBS Lett., 2007, 581, 187 CrossRef CAS PubMed.
- Y. Ilina, E. Sloma, E. Maciaszczyk-Dziubinska, M. Novotny, M. Thorsen, R. Wysocki and M. J. Tamás, Biochem. J., 2008, 415, 467 CrossRef CAS PubMed.
- A. Ullah, G. Chandrasekaran, S. Brul and G. J. Smits, Front. Microbiol., 2013, 4, 142 CAS.
- K. Smolková and P. Ježek, Int. J. Cell Biol., 2012, 2012, 1 CrossRef PubMed.
- D. C. LaPorte, J. Cell. Biochem., 1993, 51, 14 CrossRef CAS PubMed.
- N. Braidy, G. J. Guillemin, H. Mansour, T. Chan-Ling, A. Poljak and R. Grant, PLoS One, 2011, 6, e19194 CAS.
- E. H. Hettema, C. W. van Roermund, B. Distel, M. van den Berg, C. Vilela, C. Rodrigues-Pousada, R. J. Wanders and H. F. Tabak, EMBO J., 1996, 15, 3813 CAS.
- D. R. Johnson, L. J. Knoll, D. E. Levin and J. I. Gordon, J. Cell Biol., 1994, 127, 751 CrossRef CAS.
- A. Dmochowska, D. Dignard, R. Maleszka and D. Y. Thomas, Gene, 1990, 88, 247 CrossRef CAS.
- S. Singh, C. Brocker, V. Koppaka, Y. Chen, B. C. Jackson, A. Matsumoto, D. C. Thompson and V. Vasiliou, Free Radical Biol. Med., 2013, 56, 89 CrossRef CAS PubMed.
- A. T. Jacobs and L. J. Marnett, Acc. Chem. Res., 2010, 43, 673–683 CrossRef CAS PubMed.
- W. H. White, P. I. Skatrud, Z. Xue and J. H. Toyn, Genetics, 2003, 163, 69 CAS.
- R. A. Saleem, J. J. Smith and J. D. Aitchison, Biochim. Biophys. Acta, Mol. Cell Res., 2006, 1763, 1541 CrossRef CAS PubMed.
- K. Yoshikawa, T. Tanaka, C. Furusawa, K. Nagahisa, T. Hirasawa and H. Shimizu, FEMS Yeast Res., 2009, 9, 32 CrossRef CAS PubMed.
- M. Ma and Z. L. Liu, BMC Genomics, 2010, 11, 660 CrossRef CAS PubMed.
- C. Widmann, S. Gibson, M. B. Jarpe and G. L. Johnson, Physiol. Rev., 1999, 79, 143 CAS.
- D. Yin, S. Gavi, E. Shumay, K. Duell, J. B. Konopka, C. C. Malbon and H. Y. Wang, Biochem. Biophys. Res. Commun., 2005, 329, 281 CrossRef CAS PubMed.
- S. Seino and T. Shibasaki, Physiol. Rev., 2005, 85, 1303 CrossRef CAS PubMed.
- C. M. Grant, J. Biol., 2008, 7, 1 CrossRef PubMed.
- T. N. Zeczycki, M. St Maurice, S. Jitrapakdee, J. C. Wallace, P. V. Attwood and W. W. Cleland, Biochemistry, 2009, 48, 4305 CrossRef CAS PubMed.
- I. Cummins, D. J. Cole and R. Edwards, Plant J., 1999, 18, 285 CrossRef CAS.
Footnote |
| † Electronic supplementary information (ESI) available. See DOI: 10.1039/c4ra14600j |
| This journal is © The Royal Society of Chemistry 2015 |