Insights into the solvation of glucose in water, dimethyl sulfoxide (DMSO), tetrahydrofuran (THF) and N,N-dimethylformamide (DMF) and its possible implications on the conversion of glucose to platform chemicals†
Vallabh Vasudevan and
Samir H. Mushrif*
School of Chemical and Biomedical Engineering, Nanyang Technological University, 62 Nanyang Drive, Singapore 637459. E-mail: SHMushrif@ntu.edu.sg
First published on 16th February 2015
Abstract
Cellulosic biomass derived molecules such as glucose can be converted into specific platform chemicals like 5-hydroxymethylfurfural (HMF), levulinic acid and gamma valerolactone (GVL). The solvation medium plays an important role in the selective conversion of glucose to these platform chemicals and it is shown that the addition of co-solvents increases the selectivity towards desired products and minimizes the formation of undesired condensation/polymerization products and humins. Hence, it becomes imperative to understand the implications of the solvation of glucose by co-solvents on glucose conversion reactions. In the present paper, we implement OPLS-AA force-field based molecular dynamics simulations to investigate the solvation of glucose in water, in the presence of dimethyl sulfoxide (DMSO), N,N-dimethylformamide (DMF) and tetrahydrofuran (THF). The local arrangement of solvents around the glucose molecule is analyzed using 2-dimensional radial pair distribution functions and 3-dimensional volumetric maps. Additionally, lifetimes and activation free energies of hydrogen bonds between solvents and glucose and the tendency of glucose molecules to agglomerate were studied. It was observed that all the aforementioned co-solvents compete with water to be in the first solvation shell of glucose and significant amount of water is pushed to the second coordination shell. Though fewer water molecules are directly coordinated with glucose in the presence of co-solvents, they are bound strongly to it. Additionally, DMSO, THF and DMF tend to localize more around the hydrogen atom of the hydroxyl groups of selected carbon atoms of glucose. This preferential arrangement of co-solvents and water around glucose may play a role in facilitating the reaction pathway for the formation of HMF and levulinic acid and may reduce the likelihood of glucose' degradation to unwanted dehydration/rehydration products. Increasing the proportion of co-solvents also increases the hydrogen bond lifetimes between water and glucose and reduces the mobility of glucose molecules within the solvent. The reduced mobility of glucose molecules in the presence of co-solvents might be correlated to the experimentally observed reduction in the rate of formation of polymerization/condensation products and humins.
1. Introduction
Biomass is one of the largest resources of renewable carbon based fuel.1 It can be converted to fuels and chemicals using thermal processes like pyrolysis,2 liquefaction,3 and gasification.4 Additionally, liquid phase catalytic processing is also a very promising method. In this process, biomass is converted to selective intermediates such as 5-hydroxymethylfurfural (HMF), levulinic acid,5 gamma-valerolactone (GVL),6 etc. which can then be used as platform chemicals for the production of fuels and bulk chemicals. Since cellulosic biomass and its monomers like glucose and fructose are solid materials, they need to be dissolved in a solvent during the liquid phase processing. Water is usually the most preferred solvation medium for these reactions. However, experimental investigations of the catalytic conversion of glucose to platform chemicals like HMF, levulinic acid and GVL (cf. Scheme 1) have shown that the addition of co-solvents like dimethyl sulfoxide (DMSO), tetrahydrofuran (THF) and N,N-dimethylformamide (DMF) increases the yield of desired products and minimizes the formation of unwanted condensation and polymerization products.7–11 For example, (i) DMSO is a commonly used co-solvent in the dehydration of glucose/fructose to HMF. It has been used in various experimental works and has shown to increase the yield of HMF by ∼55%.12 (ii) THF has been shown to give high yield and selectivity in the presence of catalysts such as Sn-beta. The yield of the reaction, when THF is mixed with methyl tetrahydrofuran, has been shown to be extremely high for the production of HMF, from both glucose and fructose.10 (iii) Addition of DMF has also recently shown an increased yield of 87% in the presence of Sn-beta catalyst.13 However, the exact role of these co-solvents in biomass reactions is not yet completely understood.The effects of the addition of a co-solvent can be classified into two types, viz., physical and chemical. Physical solvation effects would include preferential solvation of selected functional groups of biomass molecules and their derivatives, thereby protecting them from undesired side reactions.14,15 Whereas, chemical effects of the co-solvent would include direct participation of the solvent in the reaction as a catalyst16,17 or solvent dynamics/environment altering the key activation energy barriers in the reaction mechanism.18–23 It would be extremely difficult to decouple physical solvation and chemical participation effects using experimental methods, so as to study them individually. However, it is possible to do it computationally by combining force-field/molecular mechanics based simulations with first-principles calculations. The force-field based molecular simulations can accurately capture physical interactions, but do not contain the physics to model chemical reactions; whereas the first-principles simulations can investigate both, physical and chemical interactions.
Recent investigations by Mushrif et al.22 and Mellmer et al.23 have shown how the solvent environment can alter kinetics of biomass reactions. Mellmer et al.23 have suggested that the enhanced stabilization of the reactant state by water can increase the activation barrier for acid catalyzed reactions; whereas Mushrif et al.22 have shown, using ab initio molecular dynamics simulations, that the enhanced stabilization of the transition and the product state by water can reduce the activation energy barrier for hydride transfer reactions. Keeping in mind the findings of these recent publications, it becomes extremely important to investigate the local solvation environment of glucose in the presence of co-solvents that are routinely employed in glucose transformation reactions. Depending on the solvent environment in the immediate vicinity of glucose (water and/or co-solvent), the free energy barriers, and thus the reaction kinetics would be different. For any future work that aims at investigating how the free energy barriers for key elementary steps change due to the addition of co-solvents, it is extremely important to know the local arrangement of solvent in the immediate vicinity of the reactant. This can only be done using classical force-field based simulations, since ab initio molecular dynamics simulations would be unrealistically expensive.
For the reasons state above, in the present paper, we investigate the solvation of glucose, a monomer of cellulose, in water, DMSO, DMF and THF, in different mixture proportions, using force-field based molecular simulations. Solvents selected in the present study have shown to increase the yield of HMF, when the reaction is catalyzed by inorganic catalysts like Cr, Sn, etc.24,25 This is one of the most widely studied and an important reaction in biomass conversion technology, because HMF is considered as a platform chemical for the production of different chemicals that have further use as fuels, fuel additives, polymers, plasticizers, etc. Scheme 1 illustrates the pathway for the conversion of glucose to HMF and levulinic acid.12 It has to be noted that computational work has also shown the possibility of converting glucose to HMF without forming fructose as an intermediate.26 The objective of the present paper is to study the preferential solvation of glucose and its “active” functional groups by different solvents (in mixtures with water) and to understand the possible impact of it on its conversion to HMF and levulinic acid. Section 2 gives the details of simulation methods, parameters chosen for the simulation system and analysis tools. Simulation results will be analyzed and discussed in Section 3 and we conclude our findings in Section 4.
2. Computational methodology
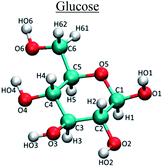
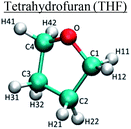
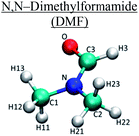
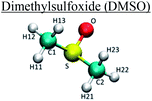
Molecular dynamics (MD) simulations were performed using GROMACS27–30 for pure and mixed solvents systems. In the case of mixed solvents systems, THF, DMSO and DMF were mixed with water in different proportions. Number of glucose and solvent molecules in the simulation systems and simulation box sizes are given in Table 1. Simulations were performed using the OPLS/AA force-field31 parameters that were chosen and benchmarked against the published literature.32–34 For solvent molecules, macroscopic properties such as density and dielectric constant were also predicted and compared to experimental values. We would like to point out that applying a partial negative charge to the nitrogen atom on DMF, as suggested in the literature,34 resulted in its reduced miscibility with water. Hence, DMF molecule was reparameterized and the details can be found elsewhere.35 The TIP4P water model31 was used to model water molecules in all the simulations. Simulation parameters for all the species are provided in Table 2. Each system was simulated for 4 ns in an NVT ensemble with an integration time step of 0.001 ps. This was preceded by a 100 ps of NPT simulation to get the correct density.| Solvent system | Water proportion in solvent (in wt%) | Number of glucose molecules | Number of co-solvent molecules | Number of water molecules | Cubic box side length (nm) |
|---|---|---|---|---|---|
| Pure water | 100 | 3 | 0 | 2984 | 4.47 |
| Pure DMSO | 0 | 3 | 865 | 0 | 4.69 |
| Pure DMF | 0 | 3 | 709 | 0 | 4.49 |
| Pure THF | 0 | 3 | 1003 | 0 | 5.23 |
| DMSO–water mixture | 90 | 3 | 60 | 1900 | 4 |
| 50 | 3 | 300 | 1169 | 4.13 | |
| 10 | 3 | 530 | 270 | 4.13 | |
| DMF–water mixture | 90 | 3 | 67 | 2430 | 4.32 |
| 50 | 3 | 333 | 1350 | 4.31 | |
| 10 | 3 | 600 | 270 | 4.33 | |
| THF–water mixture | 90 | 3 | 68 | 2430 | 4.33 |
| 50 | 3 | 338 | 1350 | 4.37 | |
| 10 | 3 | 538 | 240 | 4.28 |
The coordinates, forces, velocities and energies were recorded for every 0.1 ps along the MD trajectory. The output was visualized using VMD36 and the analysis of MD trajectories was performed using standard tools within VMD and GROMACS. All the simulation systems were maintained at 298 K using the Nosé–Hoover thermostat.37,38 A time constant of 0.2 ps was applied for the temperature coupling. No constrains on bonds and angles were applied. The cut-off distance of 1.2 nm was used for Lennard-Jones potential. The Coulomb potential was calculated using Particle Mesh Ewald39 with a cut-off of 1.3 nm and Fourier grid spacing of 0.12. The neighbor list was updated every 0.01 ps within 1.3 nm. Periodic boundary conditions were applied in all directions.
The hydrogen bond lifetimes between glucose and solvent molecules were calculated from the auto-correlation function derived from the simulation trajectory. The methodology suggested by Luzar and Chandler was adopted.40 The kinetics of hydrogen bonding are given as
| dc(t)/dt = kc(t) − k′n(t) |
3. Results and discussion
In this section, we analyze the solvation of glucose in pure solvents (as a reference) and in mixed solvents systems. Since, the solvent medium in which the reactions in Scheme 1 occur has an effect on the conversion and on the selectivity, we investigate the local organization and bonding of solvent molecules in the immediate vicinity of glucose by calculating radial distribution functions (RDF) between the solute–solvent pairs. RDFs, however, may not be able to differentiate the high and low probability solvent regions which are at the same distance from a solute molecule and the local structure gets hidden in the computed radial averaging over the angular coordinates. Hence, we present and discuss the 3-dimensional arrangement of solvent around the solutes by constructing volumetric maps of the time averaged solvent densities. Additionally, we also analyze the hydrogen bonding lifetimes and the mobility of glucose molecules in different solvent mixtures since that could have an effect on glucose condensation and polymerization reactions.3.1 Glucose in pure solvents
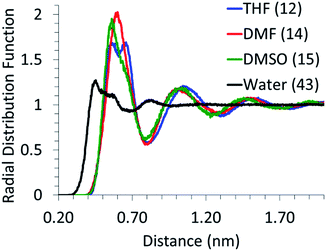
The local arrangement of the solvent molecules around glucose was analyzed by calculating the center of mass (of the molecule) RDFs, as shown in Fig. 1. The first solvation peak for water is at ∼0.41 nm and that for other solvents is at ∼0.55 nm. Given the significantly smaller size of water molecules, as compared to other solvents, the number of water molecules in the first solvation shell (calculated from the area under the first peak in the RDF curve) is much higher than that of other solvents. The absence of an intense first solvation shell peak for the glucose–water RDF can be attributed to the point that the interactions between hydroxyl groups of glucose and water would be similar to those amongst water molecules. Thus, the packing of water molecules around glucose is not significantly different than that in the bulk. However, the RDF curves between glucose and DMF, DMSO and THF exhibit an intense and distinct first solvation peak, indicating that the co-solvents' molecules interact strongly with glucose and are significantly more densely packed around glucose than those in the bulk solvent system. This indicates that, in the mixed solvents systems, DMSO, DMF and THF molecules would compete with water to be in the first solvation shell of glucose. Analysis of MD simulations of glucose in mixed solvents' systems is in the following section.3.2 Glucose in mixed solvents' system
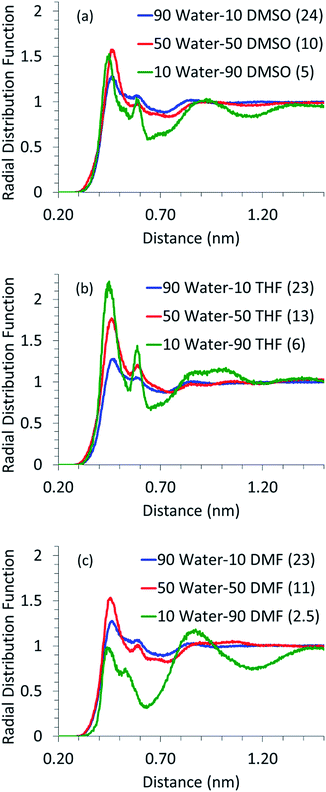
As mentioned before, simulations were also performed for systems containing glucose in aqueous mixtures of DMSO, DMF and THF. Since the dehydration of glucose, leading to the formation of HMF, and the undesired condensation reactions, leading to the formation of humins, are acid catalyzed reactions,6,13,41,42 the presence of water in the first solvation shell of glucose is crucial. It has been shown that excessive water is detrimental towards the selectivity of desired products like HMF and levulinic acid and it enhances the formation of undesired products like humins.7,43 Thus, the local arrangement of water around glucose, in the mixed solvents systems, was analyzed using the RDF of water around glucose and is shown in Fig. 2.It can be seen for all the solvents that as the proportion of water decreases and that of the co-solvent increases, the glucose–water RDF peak height increases. The number of water molecules in the first solvation shell however goes down. This suggests that all the co-solvents compete with water to be in the first solvation shell of glucose. In the absence of a co-solvent, there are 43 water molecules in the first solvation shell (cf. Fig. 1); however, even with the addition of 10 wt% of a co-solvent, almost half of the water molecules are replaced. Though the amount of water in the first solvation shell decreases with an increase in the proportion of the co-solvent, the coordination between glucose and water becomes stronger, as suggested by the increased intensity of the RDF peaks. Even when 90% of water is replaced by the co-solvent, few (2 to 6) water molecules are left in the first solvation shell of glucose and those water molecules are coordinated very strongly. It has been shown in the literature10,13 that excessive water leads to the formation of undesired side products and very little (less than 10%) water is required to obtain high yields of HMF. Our findings suggest that the small amount of water added to the reaction mixture strongly coordinates with glucose and hence could be responsible for its dehydration to HMF.
Another significant aspect to be noted in Fig. 2 is the presence of a prominent second solvation shell for glucose–water RDF for high co-solvent proportions. When DMF is used as a co-solvent, the first solvation shell loses its intensity at high DMF proportions as the competition from DMF, for the interaction with glucose, pushes water molecules away to the second solvation shell. It has to be noted that the location of the second solvation peak in glucose–water RDF (in the presence of all co-solvents) is very close to the location of the peak of the first solvation shell of the glucose–co-solvent RDF curve (refer ESI Fig. S1†). Hence, we believe that the second solvation shell arises due to the interaction between the co-solvent and water (refer ESI Fig. S2† for co-solvent–water RDFs).
3.3 Atomic details of the positioning of solvents around glucose
Experimental and molecular dynamics studies have shown that the reaction output for glucose depends on the location at which the initial protonation occurs.41–49 It is also suggested that the selectivities of different reaction pathways are very similar. Feng et al. showed that there is an equal probability for the protonation of different oxygens in the glucose molecule.44 Thus, preferential solvation or shielding of selected oxygen atoms of glucose by co-solvents can reduce the probability of certain reactions; since, there is a lesser chance of the co-solvent shielded oxygen atom to get protonated. Liu et al. have used Car–Parrinello molecular dynamics to study the reactions that occur as different oxygen atoms in glucose are protonated.45 It has been shown that the protonation of glucose at C2 oxygen (carbon atom numbering same as shown in Table 2) leads to the formation of HMF, while the protonation of the oxygen attached to C3 and C4 leads to other dehydration/rehydration products. It was suggested that protonation of C1 oxygen did not lead to any significant dehydration products. Qian et al. have done a series of studies using Car–Parrinello molecular dynamics to study the conversion of glucose via different dehydration and condensation pathways by protonation of different oxygens.43,47–49 They also proposed that it was the protonation of the C2 oxygen which led to a dehydration reaction forming a 5-membered ring intermediate, which was a precursor to HMF. IR spectroscopy studies by Patil et al. indicated that the protonation of the C1 oxygen in glucose leads to aldol condensation products which include unwanted humins.41,42 Yang et al. performed DFT calculations to confirm that different reaction pathways are generated due to protonation of different oxygen atoms.46 Protonation of glucose is water mediated.19,50 For both condensation and dehydration products to be formed, water molecules need to be present in the immediate vicinity of the specific oxygen atom so that proton can be transferred from water to that oxygen atom.To identify which oxygen atoms of the glucose molecule are accessible to water and which ones are preferentially shielded by the co-solvent, the volumetric spatial density map of the solvent oxygen atoms around glucose was calculated. The volumetric spatial density maps were calculated (using VMD tools) for different co-solvent proportions to see if the change in the proportion of the co-solvent could affect the location and orientation of hydrogen bonded waters around glucose. To compute the volumetric spatial density maps of solvent around a solute glucose molecule, the MD computed trajectory is first aligned around a randomly selected solute glucose molecule. The volumetric map is then generated by mapping the weighted atomic density at each grid point in a three dimensional grid. This is done by replacing each atom in the selected space with a normalized Gaussian distribution of width (standard deviation) equal to its atomic radius. The Gaussian distribution for each atom is then weighted using an optional weight. The calculations done in this work assume a default weight of one (i.e., the number density).
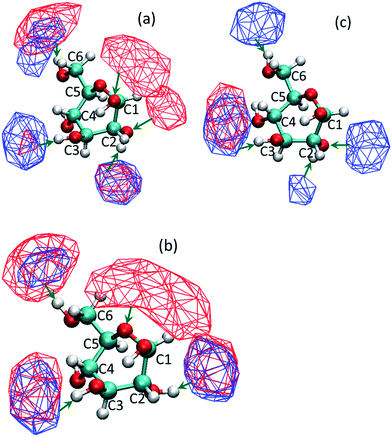
We observed that the co-solvent molecules formed hydrogen bonds with the hydrogen atoms of the hydroxyl groups of glucose. On the contrary, water molecules can form hydrogen bond with both, the oxygen and hydrogen atoms of the hydroxyl groups of the glucose molecule. Fig. 3 shows the volumetric density map (isosurface) of co-solvent and water molecules around glucose for the all three co-solvents, in a mixture containing 10% by weight water. Simulation systems containing high water proportions (90%) show similarity with pure water solvated glucose, and hence not shown here. In those systems, water forms hydrogen bonds and solvates most of the hydroxyl groups. Since the protonation is not selective, presence of water around all hydroxyl groups can lead to a higher number of dehydration products and a reduction in yield and selectivity towards HMF. At low water proportions (10% water by weight), it is observed that C1-OH group of glucose is preferentially covered by water for the DMSO–water system. The THF–water and DMF–water systems also have little co-solvent near C1-OH which could compete with the water molecules present. For the DMSO–water system (Fig. 3a), it can be seen that the high density region of water is in direct contact with the oxygen atom of the hydroxyl group of C2 and the co-solvent DMSO does not obstruct or compete with water. However, water and DMSO isosurfaces overlap in the vicinity of the hydrogen atom of the hydroxyl group of C2. No high density isosurfaces of water are present in the vicinity of C3 and C4 oxygens and those that are present in the vicinity of hydrogen atoms of the hydroxyl groups are overlapping with the isosurfaces of DMSO. Reduced probability of finding water molecules near C3 and C4 oxygen atoms suggest that, in the presence of co-solvents, there is a reduced probability of water being hydrogen bonded to these groups strongly, thus reducing the chances of these hydroxyl groups getting protonated. Similar are the observations for the solvation of glucose in the water–THF system (Fig. 3b). In the case of water–DMF system, the high density isosurfaces of water are not seen near C1 and C2 carbons since very little water is present in the first solvation shell of the glucose molecule (cf. Fig. 2c and 3c). Combining these results with the aforementioned findings about the site specific protonation leading to a specific product makes us suggest that undesired products which are formed due to the protonation of glucose at C3 and C4 positions could be prevented because of the competitive solvation of these positions by co-solvent molecules. Additionally, the preferential and competitive arrangement of co-solvents near the hydrogen atoms of the hydroxyl groups would deter the acid catalyzed condensation reaction between glucose molecules.
3.4 Mobility of glucose molecules in solvent mixtures and hydrogen bonding analysis
The root mean square fluctuation (RMSF) of glucose molecules was calculated for all the mixed solvent systems. The initial state at time t = 0 in the NVT simulation was taken as the reference. The RMSF is shown in Fig. 4. For all the co-solvents, it can be seen that the RMSF systematically decreases as water proportion decreases. This suggests that the mobility of glucose molecules is reduced as the water proportion decreases and co-solvent increases. Patil et al. have shown that humins are not only formed as condensation products of HMF molecules but also from condensation reactions between HMF and glucose and fructose.41,42 For condensation products to be formed, the different components, namely glucose and HMF, or two glucose molecules have to come in the immediate vicinity of each other. The visibility of glucose molecules to each other is affected by the mobility of glucose molecules. Lower mobility would lead to lesser visibility and agglomeration and thus, lower formation of unwanted condensation products. As can be inferred from Fig. 4, addition of co-solvents reduces the mobility of glucose molecules.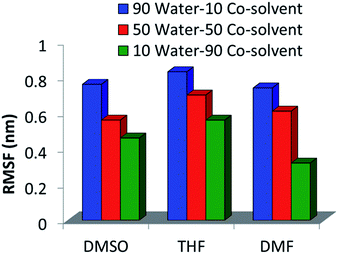 | ||
| Fig. 4 RMSF of glucose molecules in the mixtures of (a) DMSO–water; (b) THF–water; (c) DMF–water, at different water–co-solvent proportions. | ||
Hydrogen bonds are key interactions that can affect the mobility and orientation of molecules. The hydrogen bond lifetimes and the hydrogen bond activation free energies between glucose and the solvent molecules were calculated and are given in Table 3. It can be seen that the hydrogen bond lifetimes of glucose with water and with co-solvents increase with an increase in the proportion of co-solvents. All the hydrogen bond calculations were performed using the Luzar and Chandler method,40 as described before. This observation is in agreement with the RDF results in Fig. 2, which suggested stronger glucose–water interaction in the presence of co-solvents. The increase in the hydrogen bonding strength of glucose with water and with co-solvents with increase in the proportion of the co-solvent would also be the reason behind the reduced mobility of glucose molecules in the presence of co-solvents.
| System | Hydrogen bond | Water proportion | ||
|---|---|---|---|---|
| 90% by wt | 50% by wt | 10% by wt | ||
| DMSO–water mixture | Glucose–DMSO | 23.38 (12.34) | 60.46 (14.7) | 410.24 (19.44) |
| Glucose–water | 6.67 (9.23) | 13.73 (11.02) | 61.77 (14.75) | |
| DMF–water mixture | Glucose–DMF | 34.83 (13.33) | 154.94 (17.03) | 1096 (21.8) |
| Glucose–water | 7.11 (9.39) | 32.36 (13.15) | 66.36 (14.93) | |
| THF–water mixture | Glucose–THF | 27.3 (12.78) | 75.56 (15.25) | 157.37 (17.08) |
| Glucose–water | 7.53 (9.53) | 19.68 (11.91) | 25.16 (12.53) | |
This is also in agreement with the experimental ATR/FTIR analysis, reported by Nikolakis et al.15 When the ATR/FTIR spectra in the OH stretching region of fructose was analyzed, it was observed that there was a blue shift in the OH stretching vibration of fructose, due to the increase in the strength of the hydrogen bond between fructose and the solvent.51 It can be explained as follows. When glucose is solvated in water only, water molecules in the immediate vicinity of glucose are hydrogen bonded to it and to the neighboring water molecules. However, this competitive and dynamic hydrogen bonded network gets broken when a co-solvent is introduced in the first solvation shell. Water molecules are now mostly hydrogen bonded to glucose and this would result in a change in hydrogen bonding interactions.
4. Conclusions
The solvation of glucose in water, dimethyl sulfoxide (DMSO), tetrahydrofuran (THF) and N,N-dimethylformamide (DMF) and in mixtures of aforementioned solvents and water was studied using molecular dynamics simulations. Our simulation results suggest that DMSO, DMF and THF form a strong first solvation shell around glucose and they compete with water to be in the first solvation shell. Even with the addition of a small amount of co-solvent, almost 50% of water molecules are moved out of the first solvation shell. Though the number of water molecules in the first solvation decreases upon the addition of these co-solvents, the interaction between glucose and water becomes stronger. Additionally, analysis of the 3-dimensional arrangement of co-solvent and water molecules around glucose shows that there is a pronounced localization of co-solvent near C3 and C4 oxygen atoms of glucose. These observations, in conjunction with the previous experimental and computational literature on the mechanism of HMF formation, indicate that the removal of excess water from the immediate vicinity of glucose, stronger water–glucose interaction due to the presence of co-solvents and preferential arrangement of co-solvents around glucose could promote the HMF formation reaction and could deter the formation of other dehydration/rehydration products. The analysis of the root mean square fluctuations of glucose molecules along the molecular dynamics trajectory suggest that the mobility of glucose molecules decreases with increasing the co-solvent proportion. This decrease in the mobility is attributed to increased lifetimes of hydrogen bonds between glucose and solvent molecules. This could have an implication on condensation reactions leading to the formation of unwanted products like humins. The reduced mobility of glucose molecules and stronger interaction with solvents would minimize the probability of two glucose molecules or a glucose molecule and a sugar derivative like HMF to come in close proximity to undergo intermolecular condensation reactions. Thus, co-solvents may also indirectly promote the unimolecular dehydration reaction of glucose to form HMF and levulinic acid by hindering the formation of humins and other condensation products. We believe that these simulation studies provide a unique insight into the possible role of physical (and preferential) solvation of glucose by co-solvents like DMSO, DMF and THF in altering/affecting the chemistry of glucose transformation, without directly taking part into the reactions.Acknowledgements
The authors would like to acknowledge the financial support provided by Nanyang Technological University, Singapore under the Campus for Research Excellence and Technological Enterprise (CREATE) programme of the National Research Foundation (NRF), Prime Minister's Office, Singapore.Notes and references
- D. L. Klass, Encyclopedia of energy, 2004, vol. 1, pp. 193–212 Search PubMed.
- Q. Zhang, J. Chang, T. Wang and Y. Xu, Energy Convers. Manage., 2007, 48, 87–92 CrossRef CAS PubMed.
- E. Chornet and R. Overend, in Fundamentals of Thermochemical Biomass Conversion, ed. R. P. Overend, T. A. Milne and L. K. Mudge, Springer, Netherlands, 1985, pp. 967–1002 Search PubMed.
- D. Sutton, B. Kelleher and J. R. H. Ross, Fuel Process. Technol., 2001, 73, 155–173 CrossRef CAS.
- J. J. Bozell, L. Moens, D. C. Elliott, Y. Wang, G. G. Neuenscwander, S. W. Fitzpatrick, R. J. Bilski and J. L. Jarnefeld, Resour., Conserv. Recycl., 2000, 28, 227–239 CrossRef.
- D. M. Alonso, S. G. Wettstein and J. A. Dumesic, Green Chem., 2013, 15, 584–595 RSC.
- X. Qi, M. Watanabe, T. M. Aida and R. L. Smith, Bioresour. Technol., 2012, 109, 224–228 CrossRef CAS PubMed.
- R. Alamillo, M. Tucker, M. Chia, Y. Pagán-Torres and J. Dumesic, Green Chem., 2012, 14, 1413 RSC.
- P. Azadi, R. Carrasquillo-Flores, Y. J. Pagán-Torres, E. I. Gürbüz, R. Farnood and J. A. Dumesic, Green Chem., 2012, 14, 1573 RSC.
- J. M. R. Gallo, D. M. Alonso, M. A. Mellmer and J. A. Dumesic, Green Chem., 2013, 15, 85 RSC.
- H. Kimura, M. Nakahara and N. Matubayasi, J. Phys. Chem. A, 2013, 117, 2102–2113 CrossRef CAS PubMed.
- D. M. Alonso, J. Q. Bond and J. A. Dumesic, Green Chem., 2010, 12, 1493–1513 RSC.
- M. Ohara, A. Takagaki, S. Nishimura and K. Ebitani, Appl. Catal., A, 2010, 383, 149–155 CrossRef CAS PubMed.
- S. H. Mushrif, S. Caratzoulas and D. G. Vlachos, Phys. Chem. Chem. Phys., 2012, 14, 2637–2644 RSC.
- V. Nikolakis, S. H. Mushrif, B. Herbert, K. S. Booksh and D. G. Vlachos, J. Phys. Chem. B, 2012, 116, 11274–11283 CrossRef CAS PubMed.
- A. S. Amarasekara, L. D. Williams and C. C. Ebede, Carbohydr. Res., 2008, 343, 3021–3024 CrossRef CAS PubMed.
- G. Li, E. A. Pidko and E. J. M. Hensen, Catal. Sci. Technol., 2014, 4, 2241–2250 CAS.
- S. Caratzoulas and D. G. Vlachos, Carbohydr. Res., 2011, 346, 664–672 CrossRef CAS PubMed.
- S. H. Mushrif, J. J. Varghese and D. G. Vlachos, Phys. Chem. Chem. Phys., 2014, 16, 19564–19572 RSC.
- N. Nikbin, S. Caratzoulas and D. G. Vlachos, ChemCatChem, 2012, 4, 504–511 CrossRef CAS.
- S. H. Mushrif, V. Vasudevan, C. B. Krishnamurthy and B. Venkatesh, Chem. Eng. Sci., 2015, 121, 217–235 CrossRef CAS PubMed.
- S. H. Mushrif, J. J. Varghese and C. B. Krishnamurthy, Phys. Chem. Chem. Phys., 2015, 17, 4961–4969 RSC.
- M. A. Mellmer, C. Sener, J. M. R. Gallo, J. S. Luterbacher, D. M. Alonso and J. A. Dumesic, Angew. Chem., Int. Ed., 2014, 53, 11872–11875 CrossRef CAS PubMed.
- P. Gallezot, Chem. Soc. Rev., 2012, 41, 1538–1558 RSC.
- A. A. Rosatella, S. P. Simeonov, R. F. M. Frade and C. A. M. Afonso, Green Chem., 2011, 13, 754–793 RSC.
- R. S. Assary, T. Kim, J. J. Low, J. Greeley and L. A. Curtiss, Phys. Chem. Chem. Phys., 2012, 14, 16603–16611 RSC.
- H. J. C. Berendsen, D. van der Spoel and R. van Drunen, Comput. Phys. Commun., 1995, 91, 43–56 CrossRef CAS.
- B. Hess, C. Kutzner, D. van der Spoel and E. Lindahl, J. Chem. Theory Comput., 2008, 4, 435–447 CrossRef CAS.
- E. Lindahl, B. Hess and D. van der Spoel, J. Mol. Model., 2001, 7, 306–317 CAS.
- D. Van Der Spoel, E. Lindahl, B. Hess, G. Groenhof, A. E. Mark and H. J. C. Berendsen, J. Comput. Chem., 2005, 26, 1701–1718 CrossRef CAS PubMed.
- W. L. Jorgensen and J. D. Madura, J. Am. Chem. Soc., 1983, 105, 1407–1413 CrossRef CAS.
- D. T. Bowron, J. L. Finney and A. K. Soper, J. Am. Chem. Soc., 2006, 128, 5119–5126 CrossRef CAS PubMed.
- J. N. Chheda, Y. Roman-Leshkov and J. A. Dumesic, Green Chem., 2007, 9, 342–350 RSC.
- C. Caleman, P. J. van Maaren, M. Hong, J. S. Hub, L. T. Costa and D. van der Spoel, J. Chem. Theory Comput., 2011, 8, 61–74 CrossRef PubMed.
- V. Vasudevan and S. H. Mushrif, 2015, submitted.
- W. Humphrey, A. Dalke and K. Schulten, J. Mol. Graphics, 1996, 14, 33–38 CrossRef CAS.
- W. G. Hoover, Phys. Rev. A, 1985, 31, 1695–1697 CrossRef.
- S. Nosé, J. Chem. Phys., 1984, 81, 511–519 CrossRef PubMed.
- U. Essmann, L. Perera, M. L. Berkowitz, T. Darden, H. Lee and L. G. Pedersen, J. Chem. Phys., 1995, 103, 8577–8593 CrossRef CAS PubMed.
- A. Luzar and D. Chandler, Nature, 1996, 379, 55–57 CrossRef CAS.
- S. K. R. Patil, J. Heltzel and C. R. F. Lund, Energy Fuels, 2012, 26, 5281–5293 CrossRef CAS.
- S. K. R. Patil and C. R. F. Lund, Energy Fuels, 2011, 25, 4745–4755 CrossRef CAS.
- X. Qian, J. Phys. Chem. A, 2011, 115, 11740–11748 CrossRef CAS PubMed.
- S. Feng, C. Bagia and G. Mpourmpakis, J. Phys. Chem. A, 2013, 117, 5211–5219 CrossRef CAS PubMed.
- D. Liu, M. R. Nimlos, D. K. Johnson, M. E. Himmel and X. Qian, J. Phys. Chem. A, 2010, 114, 12936–12944 CrossRef CAS PubMed.
- G. Yang, E. A. Pidko and E. J. M. Hensen, J. Catal., 2012, 295, 122–132 CrossRef CAS PubMed.
- X. Qian, Top. Catal., 2012, 55, 218–226 CrossRef CAS.
- X. Qian, M. R. Nimlos, M. Davis, D. K. Johnson and M. E. Himmel, Carbohydr. Res., 2005, 340, 2319–2327 CrossRef CAS PubMed.
- X. Qian and X. Wei, J. Phys. Chem. B, 2012, 116, 10898–10904 CrossRef CAS PubMed.
- Y. Román-Leshkov, M. Moliner, J. A. Labinger and M. E. Davis, Angew. Chem., Int. Ed., 2010, 49, 8954–8957 CrossRef PubMed.
- A. V. Iogansen, Spectrochim. Acta, Part A, 1999, 55, 1585–1612 CrossRef.
Footnote |
| † Electronic supplementary information (ESI) available: Centre of mass RDFs for glucose–co-solvents, co-solvent–water and water–water pairs are provided. See DOI: 10.1039/c4ra15123b |
| This journal is © The Royal Society of Chemistry 2015 |


