
Synthesis of SBA-15 encapsulated ammonium molybdophosphate using Qaidam natural clay and its use in cesium ion adsorption
Chunyan Sun*a,
Feng Zhanga,
Shengfang Lia and
Fangqin Chengb
aDepartment of Chemical Engineering, Qinghai University, Xining, China. E-mail: sunchunyan@qhu.edu.cn; Fax: +86-971-5310441; Tel: +86-971-5310441
bInstitute of Resources and Environmental Engineering, Shanxi University, Taiyuan, China. E-mail: cfangqin@sxu.edu.cn; Fax: +86-351-7016893
First published on 27th March 2015
Abstract
The ordered hexagonal mesoporous silica (SBA-15) encapsulated ammonium molybdophosphate (AMP) was successfully synthesized using low-grade natural clay from Qaidam Basin as silica and aluminum source, through a one-pot synthesis method. The final product was fully characterized, which indicated that the composite material had better AMP dispersion and immobilization in the mesoporous structure of SBA-15. The adsorption capacity of the final product for removing cesium ions in solution was also investigated. Results suggested that Qaidam natural clay is a promising low-cost precursor for the production of mesoporous silicate supports, and the final composite material is effective for the adsorption of cesium ions from solution containing other alkali metal ions.
Introduction
Research on cesium is attracting more and more attention due to the special chemical and physical properties of cesium metal and its compounds.1–4 Brine is one of the important cesium resources. China, especially Qinghai, is very rich in salt lake brine resources. Cesium ions in brine often coexist with potassium and sodium ions which have very similar physical properties to cesium. Therefore, the separation of cesium from the systems containing mixed alkali metal ions, such as brine systems, is very difficult.Nanometer scaled polyoxometalates (POMs) are transition metal oxygen anion clusters, which not only exhibit a wide of topologies and compositions, but also lead to chemical, physical, and electronic versatility.5 Their specific properties give POMs potential applications in catalysis, medicine, optics, semiconductors, magnetics, and energy storage.6–11 Inorganic exchangers based on POMs show selective ion exchange behavior towards cesium, in which Keggin-type AMP is specific for cesium adsorption from salt loaded solutions.12–14
However, practical materials based on bulk POMs are rare due to their inherent limitations, such as high solubility, small surface areas, and poor processibility. The unsupported AMP has not been widely explored in cesium adsorption because of their microcrystalline form leads to low flow rates and clogging in flow through applications.15,16 Dispersion of POMs on various supports, such as Al2O3, organic polymer, activated carbon, and ion-exchange resin, is one way to solve this problem.17–20
Ordered hexagonal mesoporous silica with large specific surface area,21,22 are another kind of promising supports for fabricating POMs. Some composite materials using ordered mesoporous silica, including MCM-41 and SBA-15, as host matrices to organize noncoordinating POMs have been reported.23 The conventional mesoporous silica were usually synthesized using expensive and toxic organic silica source, such as TMOS or TEOS, which caused the environmental and economy problems. Additionally, POMs loading on mesoporous silica supports has primarily been carried out by impregnation followed by evaporation of solvent.24,25 The impregnation method has disadvantages of the low loadings of POMs and easy leaching of POMs from supports in liquid phase process. Therefore, the development of an inexpensive, nontoxic and practical one-pot method to prepare POMs/mesoporous silica composite materials is very important.
Attempts have been made to develop green substitute precursors for mesoporous material synthesis. The possibility of preparing mesoporous silica from low-cost natural clay minerals has been explored because of similarities between the structural units of the latter and those of mesoporous materials.26–28 Extensive clay accumulation occurs in low-grade sylvinite ores, such as those mined from salt lakes in Qaidam Basin of Qinghai, northwestern China. Approaches through which the clay from low-grade potash ore may be utilized have become a major consideration in potassium recovery processes. Therefore, the primary objective of the present work is to develop an easily accessible one-pot method for synthesis of composite material AMP/SBA-15 from natural clay which were collected directly from a salt lake in Qaidam Basin, Qinghai, and denoted QHS. The adsorption capacity of the final product obtained in this work for removing cesium ions in solution was also investigated.
Experimental section
Materials
A raw representative sample of clay (QHS) was collected from the potash ore deposit of salt lake in Qaidam Basin. The raw QHS was ground in a KM-10 planetary ball mill (Nanjing University Instrument Plant, China) at 800 rpm for 20 min. The ground sample was thoroughly washed with distilled water to remove water-soluble components, such as sodium and potassium salts, and then dried overnight at 333 K. Washed QHS was used as the starting material for composite material synthesis without sedimentation and/or centrifugation process. Synthetic salt lake brine was prepared and the detailed compositions included Cs+ (7.1 mg L−1), Rb+ (20.8 mg L−1), Li+ (6.8 × 10² mg L−1), Na+ (1.9 × 10⁴ mg L−1), K+ (2.7 × 10⁴ mg L−1), Mg2+ (2.9 × 10⁴ mg L−1), Ca2+ (2.1 × 10³ mg L−1) and Cl− (7.2 × 10⁴ mg L−1). All chemicals were purchased from Aladdin Industrial Corporation and used as received. The (NH4)3PMo12O40 (AMP) was AR reagent (Mo ≥ 61.1%), while the purity of the other reagents was ≥99%.Synthesis of AMP/SBA-15 composite material
QHS and NaOH at 2![[thin space (1/6-em)]](https://www.rsc.org/images/entities/char_2009.gif) :1 weight ratio were mixed well and fused in an MgO ceramic crucible at 773 K for 2 h. The fused mixture was cooled to room temperature to obtain the pale and loose powder. Fused QHS powder (30 g) was added to distilled water (150 mL) with vigorous stirring for 2 h in a water bath at 353 K to obtain a cloudy aqueous solution. The resultant suspension was centrifuged to separate the solid from the liquid phase. The clear supernatant with a Si/Al mole ratio of 29.5 (SiO2 11290 mg L−1, Al2O3 326.6 mg L−1) was used as Si and Al sources. Clear supernatant (100 mL) was stirred at room temperature, a solution of surfactant templating EO20PO70EO20 (P123) (3.6 g) dissolved in HCl (2 M, 150 mL) was added dropwise and stirred for 1 h. Then another HCl solution (35 wt%, 20 g) was added. After vigorously stirred for 12 h, 50 mL of the above mixture was withdrawn, and a given amount of AMP solution added dropwise into the mixture under vigorous stirring. The mixture was transferred into an autoclave and heated at 383 K for 24 h. After crystallization, the green-yellow powder product was filtered, washed with distilled water, dried overnight at 353 K, and calcined at 673 K for 6 h to remove the template. To remove the un-encapsulated AMP on the surface of support, the products were treated with 0.01 mol L−1 nitric acid at 60 °C for 10 h, and then the products were thoroughly washed with hot water. The loading amount of AMP was adjustable by controlling its concentration in the aluminosilicate gel before crystallization. The largest loading of ca. 28 wt% of the AMP could be achieved if 1.5 g of AMP is added to the above aluminosilicate gel. And finally, ca. 1.9 g product 28%AMP/SBA-15, could be obtained in one bath.
:1 weight ratio were mixed well and fused in an MgO ceramic crucible at 773 K for 2 h. The fused mixture was cooled to room temperature to obtain the pale and loose powder. Fused QHS powder (30 g) was added to distilled water (150 mL) with vigorous stirring for 2 h in a water bath at 353 K to obtain a cloudy aqueous solution. The resultant suspension was centrifuged to separate the solid from the liquid phase. The clear supernatant with a Si/Al mole ratio of 29.5 (SiO2 11290 mg L−1, Al2O3 326.6 mg L−1) was used as Si and Al sources. Clear supernatant (100 mL) was stirred at room temperature, a solution of surfactant templating EO20PO70EO20 (P123) (3.6 g) dissolved in HCl (2 M, 150 mL) was added dropwise and stirred for 1 h. Then another HCl solution (35 wt%, 20 g) was added. After vigorously stirred for 12 h, 50 mL of the above mixture was withdrawn, and a given amount of AMP solution added dropwise into the mixture under vigorous stirring. The mixture was transferred into an autoclave and heated at 383 K for 24 h. After crystallization, the green-yellow powder product was filtered, washed with distilled water, dried overnight at 353 K, and calcined at 673 K for 6 h to remove the template. To remove the un-encapsulated AMP on the surface of support, the products were treated with 0.01 mol L−1 nitric acid at 60 °C for 10 h, and then the products were thoroughly washed with hot water. The loading amount of AMP was adjustable by controlling its concentration in the aluminosilicate gel before crystallization. The largest loading of ca. 28 wt% of the AMP could be achieved if 1.5 g of AMP is added to the above aluminosilicate gel. And finally, ca. 1.9 g product 28%AMP/SBA-15, could be obtained in one bath.
Characterization
The chemical compositions of samples were determined by X-ray fluorescence (XRF) analysis on a Rigaku ZSX Primus II X-ray fluorescence spectrometer equipped with a Rh X-ray tube, and run at 50 kV voltage and 50 mA current. Wide-angle X-ray diffraction (WAXRD) patterns over the 2θ range of 5–60° were obtained using a Rigaku D-MAX2500X diffractometer with Cu Kα (40 kV and 200 mA). The scanning speed was 4° min−1 and step size was 0.02°. Phase identification was performed by searching the ICDD powder diffraction file database, with the help of JCPDS (Joint Committee on Powder Diffraction Standards) files for inorganic compounds. Small-angle X-ray diffraction (SAXRD) analysis was carried out using a PANalytic X'Pert PRO MPD diffractometer over the 2θ range of 0.6–5°. Cu Kα (40 kV and 20 mA) radiation was used. The step size was 0.008°, and the nominal collecting time was 50.16 s per step. Transmission electron microscopy (TEM) experiments were performed with a Tecnai TF20 G2 FEG-TEM at a 200 kV accelerating voltage. Fourier-transform infrared (FTIR) spectra were obtained with a Perkin-Elmer FTIR Spectrum BX-II spectrometer using KBr pellets over the range of 400–4000 cm−1 at room temperature. The simultaneous thermogravimetry and differential scanning calorimetry (TG-DSC) analysis was performed with a NETZSCH STA 449 F3 instrument in flowing N2 with a heating rate of 2 °C min−1. Magic-angle spinning (MAS) 31P NMR spectra were recorded with a Bruker Avance III 400 MHz spectrometer at resonance frequencies of 161.9 MHz using double-resonance MAS probe with 4 mm rotors. The chemical shifts were referenced relative to external 85% H3PO4, and π/2 pulses (tp = 2.6 μs) were applied at a repetition time of 1 s (400–15400 scans) and spinning frequencies of 14 kHz. Nitrogen gas adsorption–desorption isotherms were obtained at 77 K using an ASAP 2020 volumetric analyzer. Before analysis, the sample was outgassed at 473 K under vacuum for 12 h. The specific surface area and pore size distribution of the product were calculated by the BET and BJH methods, respectively. Cs+ ions concentrations in aqueous chloride solutions were determined by Ice3000 Atomic Absorption Spectrophotometer (AAS). Cs+ concentrations in the synthetic salt lake brine were determined by iCAPQ inductively coupled plasma mass spectrometer (ICP-MS) (Thermo Fisher Scientific, USA).
Leaching tests on AMP/SBA-15
Leaching on 28%AMP/SBA-15 was tested in nitric acid (10% v/v), ammonium hydroxide (0.05% v/v) and hydrochloric acid (10% v/v). The leaching tests have been conducted in parallel for 4 hours at room temperature. A mass of 25 mg of the sample was suspended by stirring in 50 mL of each solution. Aliquots of 1 mL were taken every half-hour and measured for their content in molybdenum to quantify the leached AMP.Batch sorption Measurements of cesium
Kinetic studies were performed at 298 K using three different concentrations of 50, 100 and 150 mg L−1 for Cs+ ions. The experiments were also conducted at three different temperatures (298, 313 and 333 K) using an initial Cs+ ions concentration of 100 mg L−1. For these investigations, AMP/SBA-15 (200 mg) was contacted with CsCl (100 mL) and the solution in the beaker was kept stirred in a thermostat shaker adjusted at the desired temperature. A fixed volume (2 mL) of the aliquot was withdrawn as a function of time while the solution was being continuously stirred. The withdrawn solution was centrifuged to separate the solid from the liquid phase. The clear liquid phases obtained were diluted to an appropriate concentration range for the determination of the amount of unsorbed Cs+ using AAS. The adsorption quantity at time t, qt (mg g−1) was calculated using:| qt = [(C0 − Ct)V]/m | (1) |
In the experiments of sorption isotherm measurements, the Cs+ solution (10 mL) of varying concentrations (100–1000 mg L−1) were agitated with AMP/SBA-15 (20 mg) at 298 K. After the established contact time (11 h) was reached, aliquots of supernatants were withdrawn and the adsorbed quantity qe (mg g−1) was estimated.
Freundlich isotherm model was considered to fit the obtained isotherm data. The Freundlich equation of adsorption is given by:
| qe = KfCen | (2) |
Column sorption measurements of cesium
Fixed bed sorption studies were conducted to evaluate the column performance for Cs+ adsorption on AMP/SBA-15. Experiments were conducted in a vertical down flow Perspex column of 0.8 cm inner diameter and 6 cm bed height packed with prepared AMP/SBA-15. Feed flow rate (Q) of 3 mL min−1 was supplied and maintained throughout the experiment by the use of peristaltic pump. Adsorption was performed by percolating 1 L (V0) of the Cs solution (C0 = 50, 100 and 150 mg L−1) through the column, the effluent samples were filtered, diluted and analyzed to determine Cs+ retention (Ct).The total amount of Cs+ fed to the column (X, mg) is calculated from the following equation:
| X = C0V0 | (3) |
The total adsorbed ion quantity (qtot, mg) in the column, for a given feed concentration (C0, mg L−1), can be found by:
| qtot = (C0 − Ct)V | (4) |
The total percent removal of the cesium ion by the column, i.e. the column performance by AMP/SBA-15 can be calculated from the following equation:
| Column performance (%) = (qtot/X) × 100 | (5) |
Cs elution was achieved by loading 1 L of 6 M NH4NO3 at 1 mL min−1 at room temperature. Material reusability was assessed by performing 3 consecutive adsorption/elution cycles in the conditions described above. For the selective sorption of Cs+ by AMP/SBA-15, the synthetic salt lake brine in the column conditions described above was tested.
Results and discussion
Based on the XRF and XRD analysis, the major phases of the raw QHS included quartz, kaolinite, and illite. These phases have low solubility and activity in the hydrothermal reaction process.29,30 Thus, before obtaining the aluminosilicate gel, QHS activation must be achieved by alkaline fusion.31 The synthesis involved the fused QHS, surfactant templating, AMP, and pH was adjusted by HCl. No other additives were required. We emphasize here only on the specific loadings, with sample 28%AMP/SBA-15 (where 28% represents the percentage of weight of AMP, wt%), which has been optimized regarding to its structure, texture and higher AMP loadings.Characterization of the samples
The chemical compositions of the samples were determined by XRF. In the final product, 28%AMP/SBA-15, the molar ratio of the P to Mo atoms was calculated to be 1:12, suggesting that the Keggin structure unit of AMP is well preserved.32 And the actual content of AMP was 28.2 wt% for the result product with nominal AMP content of 28 wt%.
The FT-IR spectra of samples are shown in Fig. 1. The bands at 461, 830 and 1088 cm−1 for 28%AMP/SBA-15 (Fig. 1a) are attributed to O–Si–O bending vibration, and the symmetric stretching and asymmetric modes of Si–O–Si lattice vibrations, respectively. This spectrum is very similar to that of SBA-15 (Fig. 1c), which suggests successful formation of the SBA-15 framework.22 The bulk Keggin-type AMP gives strong typical bands at 1065 cm−1 (P–Oa), 962 cm−1 (Mo![[double bond, length as m-dash]](https://www.rsc.org/images/entities/char_e001.gif) Od), 866 cm−1 (Mo–Ob–Mo) and 787 cm−1 (Mo–Oc–Mo) (Fig. 1b). The bands characteristic of bulk Keggin-type AMP are not clearly visible on the spectrum of the 28%AMP/SBA-15, because bands of AMP partially or fully overlap with that of SBA-15. This phenomenon has also been reported previously,23 which indirectly proves that there are interactions between the silicon species and the AMP in the framework. Consequently, the Keggin unit could only be characterized by the bands of stretching modes assigned to terminal bond (MoOd) and bridging bond (Mo–Oc–Mo). Here, two well-resolved bands at 963 and 797 cm−1 can be observed in Fig. 1a. The above results support that AMP has been successfully incorporated into the SBA-15 framework.
Od), 866 cm−1 (Mo–Ob–Mo) and 787 cm−1 (Mo–Oc–Mo) (Fig. 1b). The bands characteristic of bulk Keggin-type AMP are not clearly visible on the spectrum of the 28%AMP/SBA-15, because bands of AMP partially or fully overlap with that of SBA-15. This phenomenon has also been reported previously,23 which indirectly proves that there are interactions between the silicon species and the AMP in the framework. Consequently, the Keggin unit could only be characterized by the bands of stretching modes assigned to terminal bond (MoOd) and bridging bond (Mo–Oc–Mo). Here, two well-resolved bands at 963 and 797 cm−1 can be observed in Fig. 1a. The above results support that AMP has been successfully incorporated into the SBA-15 framework.
 | ||
| Fig. 1 FTIR spectra of (a) 28%AMP/SBA-15, (b) bulk AMP, and (c) SBA-15. | ||
Fig. 2 shows the wide-angle X-ray diffraction (WAXRD) patterns of the samples at various stages of the transformation process. The major composition of raw QHS was quartz; the remainder of QHS was made up of kaolinite, and illite (Fig. 2a). After fusion activation using NaOH at 773 K for 2 h, faujasite and NaAlSiO4 were formed, but some of the quartz remained (Fig. 2b). Given the high content of quartz in the raw QHS this is not surprising but disappointing as quartz is no activity in the hydrothermal reaction process. So the fused QHS was treated with deionized water, and the leaching liquor (supernatant) was used as Si and Al sources. WAXRD patterns of the 28%AMP/SBA-15 reveal that the synthesized product is amorphous; no obvious crystalline impurities were observed in the final product (Fig. 2d). Additionally, the characteristic peaks of AMP (Fig. 2c) are not observed in the WAXRD patterns of the 28%AMP/SBA-15, indicating the highly dispersion of AMP in the mesoporous SBA-15 framework, and the AMP is mainly located inside the mesopores.33
 | ||
| Fig. 2 WAXRD patterns of (a) natural QHS, (b) alkaline-fused QHS, (c) bulk AMP, and (d) 28%AMP/SBA-15. | ||
The small-angle X-ray diffraction (SAXRD) pattern of the composite material is shown in Fig. 3. Three well-resolved Bragg peaks indexed as (100), (110), and (200) diffractions planes were found in the pattern of 28%AMP/SBA-15, consistent with the hexagonal P6mm mesoporous structure of SBA-15,22 which indicates that the encapsulation of AMP into the hexagonal support did not affect the structural geometry. The presence of ordered hexagonal mesopores structure in 28%AMP/SBA-15 was directly evidenced by bright parts in the TEM images (Fig. 4).
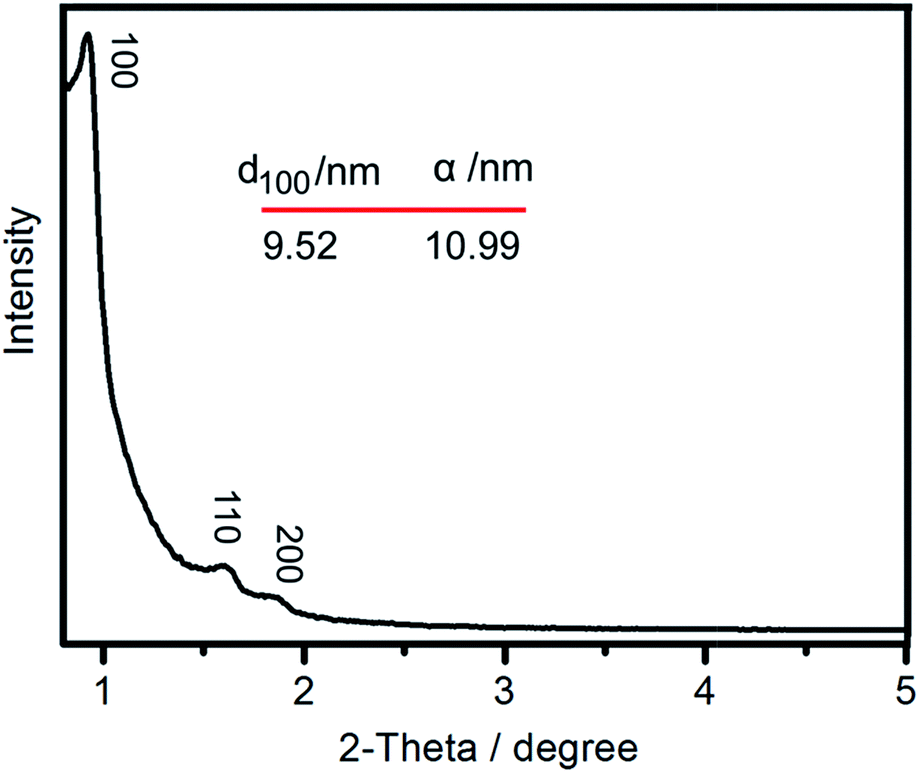 | ||
| Fig. 3 SAXRD pattern for the 28%AMP/SBA-15. The hexagonal lattice unit α = 2d100/31/2. | ||
 | ||
| Fig. 4 TEM images of (a) parallel, and (b) perpendicular to the channels for 28%AMP/SBA-15. | ||
The thermal stability of the as-synthesized composite was investigated by TG-DSC analysis. As shown in Fig. 5, three stages of weight loss in the TG curve in the region of 20–1000 °C were clearly observed. The weight loss below 200 °C was due to the dehydration of the sample. The pronounced weight loss between 200 and 400 °C with 16.1% was assigned to the removal of the surfactant in the sample. The curve exhibited another major stage of weight loss between 400 and 800 °C with 26.64%, corresponding to the decomposition of AMP. The DSC curve showed an endothermic peak at about 60 °C that was accompanied by loss of water. In addition, there were two exothermic peaks in the DSC curve, which were attributed to the decomposition of the surfactant and AMP. The TG-DSC analysis shows that the AMP/SBA-15 sample can be obtained after treating at 400 °C for 6 h.
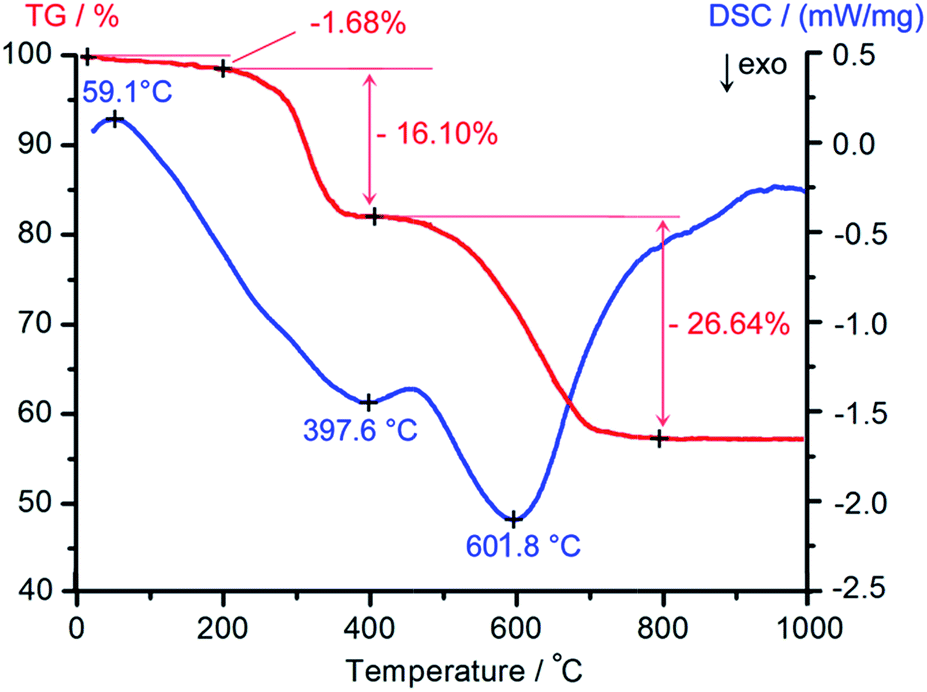 | ||
| Fig. 5 TG-DSC analysis of the as-synthesized AMP/SBA-15. | ||
Representative nitrogen adsorption–desorption isotherm and corresponding pore size distribution of 28%AMP/SBA-15 are shown in Fig. 6. The sample exhibited a well-defined type IV isotherm with a H1 hysteresis loop. This type of hysteresis loop is associated with capillary condensation and desorption in open-ended cylindrical mesopores that are typical for prominent SBA-15 silica.34 The well-characterized sharp inflection point appeared at a relative pressure (P/P0) value between 0.5 and 0.7. This sharpness indicates capillary condensation within the uniform mesopores. The pore size distribution curve shows a narrow pore size distribution centered at 7.5 nm and an average pore size of 8.2 nm. The BET surface area of 28%AMP/SBA-15 was 316.7 m2 g−1 and its pore volume was 0.62 cm3 g−1, which showed a larger relative diminution, in comparison to its native SBA-15 counterpart (650 m2 g−1 and 1.16 cm3 g−1 for SBA-15).35 These changes were attributed to the incorporation of AMP into the mesoporous framework, and indicated that large amounts of AMP were embedded into the inner pores or form thin layers on the internal surface of the mesopores, which ultimately lead to a more stable material.36
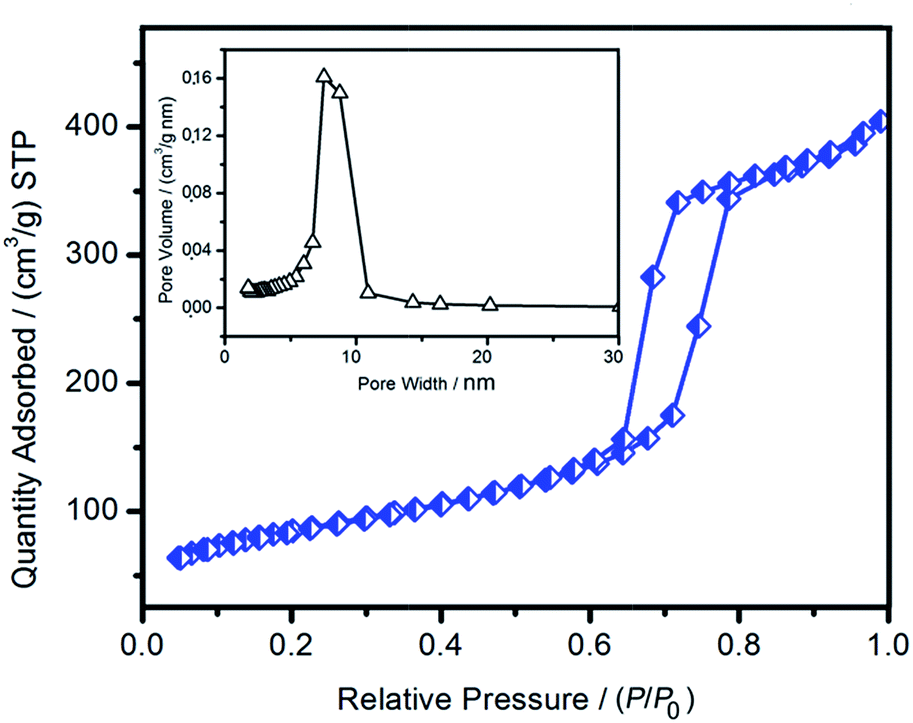 | ||
| Fig. 6 Nitrogen adsorption–desorption isotherm and BJH pore size distribution (inset) of 28%AMP/SBA-15. | ||
The interaction between the AMP and SBA-15 support was investigated using 31P MAS NMR. The chemical shift of bulk AMP is strongly dependent on the number of crystallized water molecules.37,38 In our case, bulk AMP exhibited an intense and sharp line at a chemical shift of −1.27 ppm in the 31P MAS NMR spectrum (Fig. 7a), pointing to a uniform phosphorus environment in the structure of AMP. The 31P MAS NMR spectrum of 28%AMP/SBA-15 also shows an intense and sharp line at around −1.27 ppm; and two low intense down-field chemical shifts (−2.5 and −3.34 ppm, respectively) are observed (Fig. 7b). These could be deemed to represent a significant distortion of the heteropolyanion symmetry because of strong interactions between the molybdophosphoric anions and the framework of SBA-15, which is made up of a network of SiO2. It can be concluded that the Keggin unit (primary structure) is preserved after being incorporated into the framework of SBA-15.39
 | ||
| Fig. 7 31P MAS NMR spectra of (a) bulk AMP, and (b) 28%AMP/SBA-15. | ||
Cesium ions adsorption capability of 28%AMP/SBA-15
Prior to Cs+ adsorption experiments, the stability of the 28%AMP/SBA-15 was tested in various aqueous media for a period of 4 hours at room temperature. The results indicated that the composite material remain stable (<1% of AMP being leached) in almost every media tested (Fig. 8). | ||
| Fig. 8 Leaching tests on 28%AMP/SBA-15. | ||
Investigations on the sorption rate and sorption isotherms of Cs+ in aqueous chloride solutions by 28%AMP/SBA-15 were conducted by batch sorption studies. The effect of the initial ion concentration was performed at initial concentrations of 50, 100 and 150 mg L−1 at 298 K for the sorption of Cs+ ions onto 28%AMP/SBA-15 and the results were shown in Fig. 9. It is clear that the sorption amount of Cs+ ions increases with increasing the initial ions concentration. Also, the amount of Cs+ ion adsorbed rapidly increases with time in the initial stage (0–6 h range), and then reach an equilibrium value in approximately 6–9 h. A further increase in contact time had a negligible effect on the amount of ion sorption. The equilibrium time was found to be independent of the initial concentration. According to these results, the agitation time was fixed at 11 h for the subsequent adsorption experiments to ensure that equilibrium was achieved. The increase in the uptake capacity of the 28%AMP/SBA-15 with increasing initial ion concentration may be due to higher probability of collision between Cs+ ion and the AMP molecule in mesopores. The variation in the extent of sorption may also be due to the fact that initially all sites on the surface of 28%AMP/SBA-15 were vacant and the Cs+ ion concentration gradient was relatively high. Consequently, the extent of Cs+ uptake decreases significantly with the increase of contact time, depending on the decrease in the number of vacant sites on the surface of composite material. The maximum adsorption capacity of 28%AMP/SBA-15 for Cs was about 90 mg g−1 in our experimental conditions, which is higher than that of AMP–SG composite adsorbent (47.8 mg g−1),40 and comparative to that of AMP–CaALG composite adsorbent (91.7 mg g−1).18
 | ||
| Fig. 9 Effect of initial ion concentration and contact time on the amount adsorbed of Cs+ ions onto 28%AMP/SBA-15. | ||
Fig. 10 shows the variation of the amounts of Cs+ ions adsorbed at different time intervals, for the fixed initial ion concentration of 100 mg L−1 and at different sorption temperatures of 298, 313 and 333 K. The amount of the adsorbed Cs+ ions increases with the increase in temperature indicating an endothermic nature of the sorption processes, while the time required reaching equilibrium remained practically unaffected. And the sorption data at 298 K can be successfully modeled using Freundlich isotherm model (Fig. 10 inset). The Kf gives an idea on relative sorption affinity, and the n indicates the intensity of the sorption process. In our case, n was less than 1, indicating the heterogeneity of the composite material surfaces.41
 | ||
| Fig. 10 Adsorption kinetic curves for Cs+ onto 28%AMP/SBA-15 at different temperatures with initial ion concentration of 100 mg L−1. And sorption isotherm at 298 K (inset), the solid lines represent the fitting data by Freundlich. | ||
The fixed bed column operation allows more efficient utilization of the adsorption capacity than the batch process. Preliminary adsorption tests on 28%AMP/SBA-15 using different concentrations of Cs+ were conducted by column operation. 28%AMP/SBA-15 adsorbs up to 80% of Cs+ in the concentration range tested (Table 1). Regeneration of the adsorbent was achieved using 6 M NH4NO3 as an eluting solvent at room temperature. The circular column performance of 28%AMP/SBA-15 only slightly varied after three consecutive adsorption/elution cycles.
| C0 (mg L−1) | X (mg) | qtot (mg) | Column performance (%) | Column performance for 3rd cycle (%) | |
|---|---|---|---|---|---|
| CsCl | 50 | 50 | 36.5 | 73 | 70 |
| 100 | 100 | 72.2 | 72 | 69 | |
| 150 | 150 | 120.5 | 80 | 79 | |
| Brine | 50 | 50 | 31.6 | 63 | 60 |
| 100 | 100 | 67.1 | 67 | 61 | |
| 150 | 150 | 111.3 | 74 | 70 |
The presence of competitive cations was further probed by performing Cs+ column sorption tests in synthetic salt lake brine (see experimental section for the brine composition). As shown in Table 1, the 28%AMP/SBA-15 adsorbed up to 74% of Cs+ in synthetic brine, the presence of other typical cations in large excess (e.g. Na+/Cs+ 2.7 × 10³; K+/Cs+ 3.8 × 10³) does not noticeably influence the Cs+ sorption performance of the composite material. Work is underway to explore the adsorption mechanism in greater detail and expand this approach to other transformations with suitable host matrix and polyoxometalates.
Conclusions
Hexagonally mesoporous SBA-15 encapsulated the Keggin-type AMP was successfully synthesized via one-pot method. The natural impure clay from low-grade potash ores of a salt lake in Qinghai, China, was used as starting material; no additional silica or aluminum reagents were required in this process. Through the one-pot synthesis method, the AMP was efficiently dispersed into SBA-15 matrix. The structure and morphology of SBA-15 and AMP were preserved in the final hybrid material. In addition, the result material as cesium ions adsorbent in solution was investigated. It displays excellent adsorption and reusability. No noticeable AMP leaching has been observed.Taken together, the results of this study demonstrate the multi-purpose use of abundant natural clay resource. For practical implementation, work is underway to explore the adsorption mechanism in greater detail.
Acknowledgements
The authors thank the support of NSFC of 21266027 and Qinghai International S&T Cooperation Program of 2012-H-803.Notes and references
- S. Vdović, D. Sarkisyan and G. Pichler, Opt. Commun., 2006, 268, 58–63 CrossRef PubMed.
- V. Ananév, M. Miklin, N. Nelyubina and M. Poroshina, J. Photochem. Photobiol., A, 2004, 162, 67–72 CrossRef.
- E. Buchy, S. Valetti, S. Mura, J. Mougin, C. Troufflard, P. Couvreur and D. Desmaële, Eur. J. Org. Chem., 2015, 202–212 CrossRef CAS PubMed.
- J. Zhao, J. Xu, J. Xu, J. Ni, T. Zhang, X. Xu and X. Li, ChemPlusChem, 2015, 80(1), 196–201 CrossRef CAS PubMed.
- M. T. Pope, Heteropoly and Isopolyoxometalates, Springer, Berlin, 1983 CrossRef CAS PubMed; M. T. Pope and A. Müller, Angew. Chem., Int. Ed. Engl., 1991, 30, 34–48 CrossRef CAS PubMed; C. L. Hill, Chem. Rev., 1998, 98, 1–50 CrossRef PubMed; D. L. Long, E. Burkholder and L. Cronin, Chem. Soc. Rev., 2007, 36, 105–121 RSC.
- T. Yamase, J. Mater. Chem., 2005, 15, 4773–4782 RSC.
- I. V. Kozhevnikov, Chem. Rev., 1998, 98, 171–198 CrossRef CAS PubMed; A. M. Khenkin, L. Weiner and R. Neumann, J. Am. Chem. Soc., 2005, 127, 9988–9989 CrossRef PubMed.
- H. Murakami, T. Kozeki, E. Ishikawa and T. Yamase, Appl. Phys. Lett., 2001, 79, 3564–3566 CrossRef CAS PubMed.
- N. Glezos, P. Argitis, D. Velessiotis and C. D. Diakoumakos, Appl. Phys. Lett., 2003, 83, 488–490 CrossRef CAS PubMed.
- T. Yamase, E. Ishikawa, K. Fukaya, H. Nojiri, T. Taniguchi and T. Atake, Inorg. Chem., 2004, 43, 8150–8157 CrossRef CAS PubMed.
- N. Casañ-Pastor and P. Gómez-Romero, Front. Biosci., 2004, 9, 1759–1765 CrossRef PubMed.
- V. Pekárek and V. Veselý, Talanta, 1972, 19, 1245–1283 CrossRef.
- H. A. M. Arida, R. F. Aglan and S. A. El-Reefy, Anal. Lett., 2004, 37, 21–33 CrossRef CAS.
- J. H. Park, B. U. Chang, Y. J. Kim, J. S. Seo, S. W. Choi and J. Y. Yun, J. Environ. Radioact., 2008, 99, 1815–1818 CrossRef CAS PubMed.
- J. Dolžal, J. Stejskal, M. Tympl and V. Kouřĭm, J. Radioanal. Nucl. Chem., 1974, 21, 381–387 CrossRef.
- S. D. Roy and M. S. Das, Anal. Chim. Acta, 1970, 51, 520–522 CrossRef.
- J. Satyanarayana, G. S. Murthy and P. Sasidhar, J. Radioanal. Nucl. Chem., 1999, 242, 11–16 CrossRef CAS; T. J. Tranter, R. S. Herbst, T. A. Todd, A. L. Olson and H. B. Eldredge, Adv. Environ. Res., 2002, 6, 107–121 CrossRef.
- X. Ye, Z. Wu, W. Li, H. Liu, Q. Li, B. Qing, M. Guo and F. Ge, Colloids Surf., A, 2009, 342, 76–83 CrossRef CAS PubMed.
- R. D. Gall, C. L. Hill and J. E. Walker, Chem. Mater., 1996, 8, 2523–2527 CrossRef CAS; B. A. Watson, M. A. Barteau, L. Haggerty, A. M. Lenhoff and R. S. Weber, Langmuir, 1992, 8, 1145–1148 CrossRef.
- M. A. Schwegler, H. Van Bekkum and N. A. de Munck, Appl. Catal., 1991, 74, 191–198 CAS.
- J. S. Beck, J. C. Vartuli, W. J. Roth, M. E. Leonowicz, C. T. Kresge, K. D. Schmitt, C. W. Chu, D. H. Olson, E. W. Sheppard, S. B. McCullen, J. B. Higgins and J. L. Schlenker, J. Am. Chem. Soc., 1992, 114, 10834–10843 CrossRef CAS; C. T. Kresge, M. E. Leonowicz, W. J. Roth, J. C. Vartuli and J. S. Beck, Nature, 1992, 359, 710–712 CrossRef.
- D. Y. Zhao, Q. S. Huo, J. L. Feng, B. F. Chmelka and G. D. Stucky, J. Am. Chem. Soc., 1998, 120, 6024–6036 CrossRef CAS.
- B. Li, W. Ma, J. Liu, S. Zuo and X. Li, J. Colloid Interface Sci., 2011, 362, 42–49 CrossRef CAS PubMed; B. Li, W. Ma, J. Liu, C. Han, S. Zuo and X. Li, Catal. Commun., 2011, 13, 101–105 CrossRef PubMed; C. Shi, R. Wang, G. Zhu, S. Qiu and J. Long, Eur. J. Inorg. Chem., 2005, 4801–4807 CrossRef PubMed; C. Shi, R. Wang, G. Zhu, S. Qiu and J. Long, Eur. J. Inorg. Chem., 2006, 3054–3060 CrossRef PubMed; S. Schneider, A. Caldas, M. Tremblay, F. Bilodeau, D. Lariviére and F. Kleitz, New J. Chem., 2013, 37, 3877–3880 RSC.
- D. Kumar and C. Landry, Microporous Mesoporous Mater., 2007, 98, 309–316 CrossRef CAS PubMed.
- J. Juan, J. Zhang and M. Yarmo, J. Mol. Catal. A: Chem., 2007, 267, 265–271 CrossRef CAS PubMed.
- M. Adjdir, T. Ali-Dahmane, F. Friedrich, T. Scherer and P. G. Weidler, Appl. Clay Sci., 2009, 46, 185–189 CrossRef CAS PubMed.
- Y. Xie, Y. Zhang, J. Ouyang and H. Yang, Phys. Chem. Miner., 2014, 41(7), 497–503 CrossRef CAS.
- H. Yang, A. Tang, J. Ouyang, M. Li and S. Mann, J. Phys. Chem. B, 2010, 114, 2390–2398 CrossRef CAS PubMed.
- C. Wang, J. Zhou, Y. Wang, M. Yang, Y. Li and C. Meng, J. Chem. Technol. Biotechnol., 2013, 88, 1350–1357 CrossRef CAS PubMed.
- A. S. Kovo, O. Hernandez and S. M. Holmes, J. Mater. Chem., 2009, 19, 6207–6212 RSC.
- Y. Ma, C. Yan, A. Alshameri, X. Qiu, C. Zhou and D. Li, Adv. Powder Technol., 2014, 25(2), 495–499 CrossRef CAS PubMed.
- Y. P. Jeannin, Chem. Rev., 1998, 98, 51–76 CrossRef CAS PubMed.
- S. R. Mukai, L. Lin, T. Masuda and K. Hashimoto, Chem. Eng. Sci., 2001, 56, 799–804 CrossRef CAS.
- M. Kruk, M. Jaroniec, C. H. Ko and R. Ryoo, Chem. Mater., 2000, 12, 1961–1968 CrossRef CAS; P. I. Ravikovitch and A. V. Neimark, J. Phys. Chem. B, 2001, 105, 6817–6823 CrossRef.
- Y. Wang, G. Chen, F. Zhang and L. Li, Res. Chem. Intermed., 2014, 40, 385–397 CrossRef CAS.
- M. A. Shenashen, S. A. EI-Safty, E. A. Elshehy and M. Khairy, Eur. J. Inorg. Chem., 2015, 179–191 CrossRef CAS PubMed.
- J. B. Black and N. J. Clayden, J. Chem. Soc., Dalton Trans., 1984, 2765–2767 RSC.
- B. Sulikowski, J. Haber, A. Kubacka, K. Pamin, Z. Olejniczak and J. Ptaszyński, Catal. Lett., 1996, 39, 27–31 CrossRef CAS.
- S. Damyanova, L. Dimitrov, R. Mariscal, J. Fierro, L. Petrov and I. Sobrados, Appl. Catal., A, 2003, 256, 183–197 CrossRef CAS.
- J. Doležal, J. Stejskal, M. Tympl and V. Kouřǐm, J. Radioanal. Chem., 1974, 21, 381–387 CrossRef.
- T. Shahwan and H. N. Erten, J. Radioanal. Nucl. Chem., 2002, 253, 115–120 CrossRef CAS.
| This journal is © The Royal Society of Chemistry 2015 |