Removal of emerging contaminants by pre-mixed PACl and carbonaceous materials†
W. Jianga,
F. Xiao*a,
D. S. Wanga,
Z. C. Wangb and
Y. H. Caic
aKey Laboratory of Drinking Water Science and Technology, Research Centre for Eco-Environmental Sciences, Chinese Academy Sciences, 18#, Shuangqing Rd., Haidian District, Beijing, 100085, China. E-mail: jiangwei_2910@163.com; fengxiao@rcees.ac.cn; wgds@rcees.ac.cn
bWison Engineering (China) Co. Ltd., 699 Zhongke Rd., Zhangjiang Hi-techPark, Pudong District, Shanghai, 201210, China
cBefar Group Co. Ltd, 869# 5th Huanghe Road, Binzhou, Shandong 256619, China
First published on 14th April 2015
Abstract
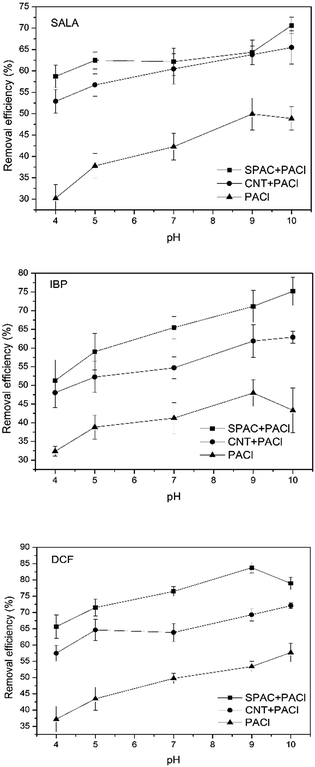
In this study, pre-mixed poly aluminum chloride (PACl) and super powdered activated carbon (SPAC)/carbon nanotubes (CNT) were employed for the removal of emerging contaminants (ECs) from various water sources. Salicylic acid (SALA), ibuprofen (IBP) and diclofenac (DCF) were the targeted ECs. The synergistic effect of the combined coagulation and adsorption process as well as their individual removal performance are discussed in this paper. The results of the three ECs removal indicate that pre-mixed PACl and SPAC/CNT has a better removal ability compared with PACl or SPAC/CNT alone. The maximum adsorption capacities increase at least 5 times after the addition of PACl, attributed to the charge neutralization and adsorption on the flocs. The removal efficiency of ECs by coagulation improves with the addition of SPAC/CNT as a result of the bridging effect as well as adsorption of ECs by carbon materials. The removal efficiency for these three ECs generally exhibited the following trends: SALA (log![[thin space (1/6-em)]](https://www.rsc.org/images/entities/char_2009.gif) P = 1.98) < IBP (log
P = 1.98) < IBP (log![[thin space (1/6-em)]](https://www.rsc.org/images/entities/char_2009.gif) P = 3.84) < DCF (log
P = 3.84) < DCF (log![[thin space (1/6-em)]](https://www.rsc.org/images/entities/char_2009.gif) P = 4.26), indicating that the hydrophobicity of the ECs plays an important role.
P = 4.26), indicating that the hydrophobicity of the ECs plays an important role.
1 Introduction
In recent years, increasing reports of emerging contaminants (ECs) have aroused public awareness and attracted research priorities in China. ECs are a group of compounds that are not commonly monitored but have been recently detected in the environment, which are considered to be a potential ecological and public health risk.1 Different groups of compounds are included in this category such as pharmaceuticals and personal care products (PPCPs), endocrine disrupting chemicals (EDCs), persistent organic pollutants (POPs), perfluorinated compounds (PFCs), disinfection byproducts (DBPs).2 The major sources of emerging contaminants are untreated urban wastewaters and wastewater treatment plant (WWTP) effluents, hospital wastes, industrial wastewater, nonpoint agriculture runoff, landfill leachate and animal feeding operations.3,4 Although ECs are commonly found in the μg L−1 or ng L−1 concentration range in the water, they can cause a variety of effects on aquatic organisms and human health such as acute and chronic toxicity, endocrine disruption, bioaccumulation and biomagnifications.5,6However, these substances are not the priority pollutants with the traditional wastewater treatment processes (WWTP) and waterworks. A large variety of emerging compounds and their metabolites can pass through the treatment processes and enter the aquatic environment.7 Frequently detection of ECs in the treated effluents has been reported in recent studies.8–10 Furthermore, some transformations of those ECs can occur by certain treatment, exhibiting even higher toxicity than their parents.11 Thus, it is vital to find out some effective water treatment processes to remove ECs, and thus ensure that any potential human health risks are mitigated prior to consumption.
The main available techniques to remove ECs are chemical coagulation and flocculation,12 adsorption,13 nanofiltration/reverse osmosis,14 advanced oxidation processes15 and biological treatment.16 In general, the advanced processes such as nanofiltration/reverse osmosis and advanced oxidation process are more complicated to operate and energy intensive. It is logical to find ways to improve the adsorption and coagulation processes, which are cost-effective and commonly used in water treatment processes, to make them adaptive for the ECs removal.
The ECs removal by activated carbon adsorption has been extensively studied.17,18 Recently, works on the super powdered activated carbon (SPAC) and carbon nanotubes (CNT) have demonstrated their effective removal of natural organic matters (NOM) and odor pollutants due to their morphology and surface chemistry.19,20 But only a few studies have involved in the application of carbon nanotubes to the emerging contaminants removal.21,22 Apparently, most of studies are focused on adsorption to ECs alone. Therefore, it is really worth to develop one certain materials to remove ECs by adsorption as well as flocculation simultaneously.
In this study, pre-mixed PACl and super powdered activated carbon (SPAC)/carbon nanotubes (CNT) were employed for the removal of emerging contaminants (ECs) from various water sources. As emerging contaminants, three compounds (salicylic acid (SALA), ibuprofen (IBP) and diclofenac (DCF)) were investigated due to their identified potential risks in the aquatic environment in China.23 The synergistic effect of combined coagulation and adsorption process as well as their individual removal performance were discussed in this paper. Finally, according to the investigation, the mechanism of ECs removal by the pre-mixed agents with PACl and carbonaceous materials were proposed.
2 Materials and methods
2.1 Adsorbents and coagulants
The SPAC and CNT used in this study were purchased from Beijing DK nano technology Co., LTD. The SPAC and CNT were dried in a drying oven (DHG-9146A, Shanghai Jinghong Laboratory Instrument Co., Ltd) at 105 °C for 24 h, then cooled and stored in a desiccator prior to use. PACl were prepared using Na2CO3 and AlCl3 as raw material. 10.36 g Na2CO3 were added to 60 ml AlCl3 solutions (1.0 mol L−1), and the solution was reacted for 16 h at 80 °C. Na2CO3 + CNT and Na2CO3 + SPAC were added to AlCl3 solution (1.0 mol L−1) respectively to obtain the pre-mixed PACl + SPAC and PACl + CNT. The solutions were reacted for 16 h at 80 °C. The pre-mixed agents were freeze-dried and stored at 4 °C for further use.2.2 Chemicals and model waters
All chemicals and reagents used were analytical grade or better unless otherwise stated. SALA, DCF and IBP (chromatographically pure, purchased from Dr Ehrenstorfer GmbH) were selected in this study. These pharmaceuticals were chosen for the experiment because they are priority pollutants according to Bu.23 The properties of the three pharmaceuticals are shown in Table 1.The partition coefficient is a ratio of concentrations of un-ionized compound between the two liquid phases. The logarithm of the ratio of the concentrations of the un-ionized solute in the solvents is called log![[thin space (1/6-em)]](https://www.rsc.org/images/entities/char_2009.gif) P: when one of the solvents is water and the other is a non-polar solvent, then the log
P: when one of the solvents is water and the other is a non-polar solvent, then the log![[thin space (1/6-em)]](https://www.rsc.org/images/entities/char_2009.gif) P value is also known as a measure of lipophilicity. For example, in an octanol–water system:
P value is also known as a measure of lipophilicity. For example, in an octanol–water system:
 | (1) |
Source water, secondary effluent and synthetic water were used in this study to investigate the impact of water quality on the ECs removal. Source water was taken from Beijing Miyun reservoir; effluent water was taken from the secondary effluent of Beijing Gaobeidian wastewater treatment plant; synthetic water was prepared by adding Kaolin, NaNO3 and NaHCO3 to tap water. Table S1† shows the composition of the source water, effluent water and synthetic water. The waters were stored in a refrigerator for further study. The suspension was vigorously stirred for 0.5 h.
2.3 Adsorption experiments
Isotherms were investigated using a batch adsorption technique at room temperature (25 °C). ECs solutions were diluted to initial concentrations of 0.1, 0.3, 0.5, 0.8, 1.0, 3.0, 5.0 mg L−1. CNT/SPAC doses of 100 mg L−1 were added to the ECs solutions. Experiments have been done to test the equilibrium time of ECs adsorbed on SPAC/CNT (Fig. S1†). Samples were then put into 50 mL screwed cap glass vials, and placed in a shaker for 48 h to reach equilibrium. After that, samples were filtered through a 0.22 μm fiberglass membrane filter prior to the ultra-performance liquid chromatography-tandem mass spectroscopy (UPLC-MS) analysis.2.4 Jar tests
Bench scale jar test experiments were performed on a variable speed jar test apparatus using cylindrical jars and liquid volumes of 500 mL each. To simulate coagulation, flocculation and sedimentation conditions, rapid mixing at 250 rpm was performed for 1.5 min, slow mixing at 40 rpm was performed for 10 min, followed by settling for 30 min. The initial dosage of the coagulants was 0.1 mmol L−1 determined by preliminary testing. Once the jar tests were completed, the treated water samples were taken and passed through 0.22 μm filters for UPLC-MS analysis. All experiments were conducted in duplicates and the average values were adopted for analysis.2.5 Characterization of CNT/SPAC and pre-mixed agents
CNT, SPAC and the pre-mixed agents were severally mixed with KBr, and then the samples were compressed into films and scanned by a Fourier Transform Infrared Spectroscopy (FTIR, Nicolet 8700, Thermo Fisher Scientific) to analyze the change of functional groups. Surface morphology was characterized by scanning electron microscopy (SEM, SU-8020, Hitachi Limited, Japan). Physical properties such as porosity, total pore volume and surface area were measured using a Micromeritics Gemini apparatus (ASAP 2020 HD88, Micromeritics Instrument Co.), and calculated according to the Brunauer, Emmett and Teller (BET) method. The elemental compositions were determined by energy dispersive spectrometer (SEM-EDS).2.6 Analytical methods
The concentrations of the ECs were quantified using an UPLC-Q-MS (ACQUITY UPLC, Quattro Premier XE, Waters, USA). The UPLC column was a C18 (1.7 μm, 2.1 * 100 mm) column and the column temperature during the measurement was 30 °C. The sample temperature was 10 °C. The mobile phase included solvent A of 0.1% formic acid in milli-Q water, and solvent B of acetonitrile. Solvent gradients (A/B) for the measurement were: 30% B stepped to 40% B at 0.5 min and increased linearly to 100% B at 5 min, then decreased to 30% B at 6.5 min. The injection volume was 10 μL, and the MRM (Multiple Reaction Monitoring) mode was used. The iron pairs of SALA, IBP and DCF were 137.2/93.2, 205.4/161.4, 294.4/250.4, respectively. Floc sizes and fractal dimensions were characterized by analysis of forwards scattered light using a Mastersizer 2000 (Malvern Instruments, USA), similar to the procedures employed by Lo and Waite.243 Results and discussion
3.1 Characteristics of CNT/SPAC and pre-mixed agents
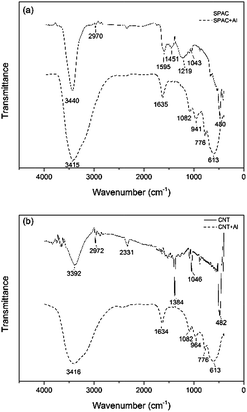
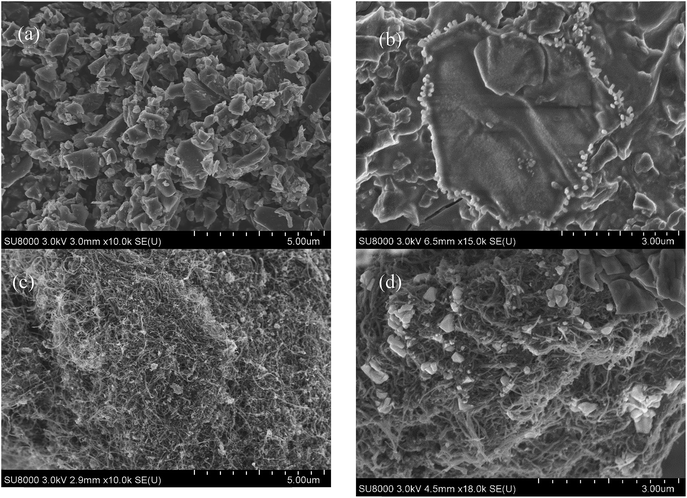
The FTIR spectra of the CNT/SPAC and pre-mixed agents were recorded in the transmission mode between 4000 and 400 cm−1. According to Fig. 1(a), the peaks at 3440/1595, 1451, 1219, 1043 and 480 on SPAC were attributed to O–H stretching, aromatic C–C stretching, C–O stretching, C–O stretching of CH2–O–CH2, Si–O–Si flexural vibration respectively. While the peaks at 3415/1635, 1082/941, 776 and 613 on pre-mixed SPAC and PACl were recognized as the hydroxyl groups of crystal water, the flexural vibration of O–H, the adsorption band of [AlO4] tetrahedron and the adsorption band of [AlO6] octahedron respectively, which was in accordance with the band of Al13. This result indicates Al13 were formed during the preparation of coagulants, which could also be seen from Fig. 2, where white crystals were found on the surface of the carbonaceous materials after mixing with PACl. Al13([AlO4Al12(OH)24(H2O)12]7+) is a cluster known for the pronounced stability that arises from coincident closures of its geometric and electronic shells. With the properties of high positive charge and strong binding ability to aggregates, Al13 could help improve the coagulants' ability to remove contaminants from water. As is shown in Fig. 1(b), the peaks of CNT at 3392, 2972, 2331, 1384, 1046 and 482 were attributed to O–H stretching, aliphatic C–H stretching, CO2, C–O stretching, C–O stretching of CH2–O–CH2 and Si–O–Si flexural vibration respectively. The band of pre-mixed CNT/PACl was similar to that of pre-mixed SPAC/PACl, indicating that Al13 were also formed on the surface of the CNT.Median and effective diameters of the CNT and SPAC were shown in Table 2. CNT had a volumetric median particle diameter of 43.87 μm. In contrast, the median diameter of SPAC was only 0.99 μm, which was less than 1/40 of that for CNT. The effective diameter (10% undersize) of SPAC was 0.46 μm, which was less than 1/20 of the value for CNT (10.87 μm). The differences of pore size distribution of SPAC and CNT were confirmed visually by the SEM pictures (Fig. 2). It was observed that the SPAC was actually comprised of small particles with diameters ranging from 0.1 μm to 2 μm, whereas there were no particles of CNT observed at 10![[thin space (1/6-em)]](https://www.rsc.org/images/entities/char_2009.gif) 000 × magnification.
000 × magnification.
| Adsorbent | Surface elemental composition (%) | Surface area (m2 g−1) | Vmicro (cm3 g−1) | Vmeso (cm3 g−1) | Vtotal (cm3 g−1) | Effective diameter (μm) | Median diameter (μm) | |||
|---|---|---|---|---|---|---|---|---|---|---|
| C | O | Al | Cl | |||||||
| SPAC | 86.1 | 13.9 | N/A | N/A | 221.94 | 0.078 | 0.118 | 0.196 | 0.46 | 0.99 |
| CNT | 92.1 | 7.9 | N/A | N/A | 120.34 | 0.003 | 0.447 | 0.450 | 10.87 | 43.87 |
| SPAC + Al | 22.9 | 28.8 | 22.1 | 26.2 | 175.83 | 0.060 | 0.111 | 0.171 | 0.504 | 1.319 |
| CNT + Al | 36.1 | 25.4 | 14.8 | 23.7 | 107.66 | 0.004 | 0.442 | 0.446 | 11.617 | 44.575 |
The characteristics of the surface area, pore volume and elemental composition of SPAC and CNT were summarized in Table 2. As demonstrated, the specific surface area of SPAC was about 2 times of CNT. CNT possessed larger pore volumes than SPAC, and most of the pore volume (>99%) was consisted of mesopores. On the contrast, SPAC also contained considerable micropores (40%). The proportion of mesopore on the surface of SPAC is lower than CNT, which could be attributed to the structure destruction during the preparation of SPAC.
3.2 Adsorption isotherm and adsorption capacity with or without PACl
Adsorption isotherm were obtained by batch experiment, in which 0.1 g L−1 adsorbents were added into 50 mL of 0.1–5 mg L−1 EC solutions. Representative Langmuir adsorption isotherms were obtained by eqn (2):
 | (2) |
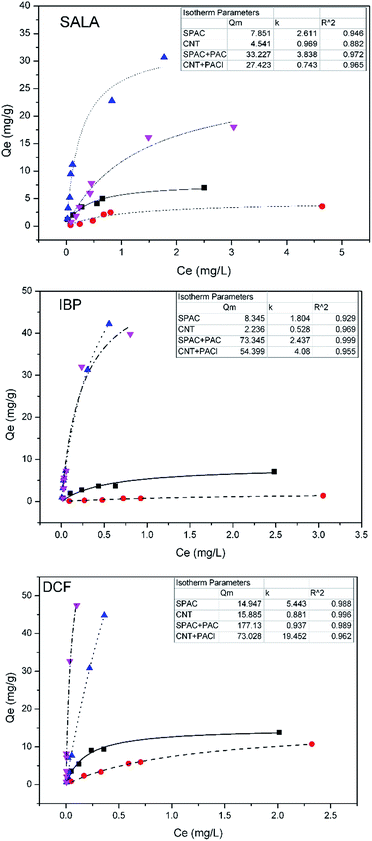
The maximum adsorption capacity generally followed the order of SPAC > CNT, which was coincide with the external surface area of the materials (Table 2), with the exception of the DCF, where the Qm of CNT was slightly higher than SPAC. This means the specific surface area of the adsorbents plays the predominant role in the adsorption of ECs. The Qm of SPAC was lower than that of CNT for DCF, and the reasons could be: (1) the mesopore volume of CNT was about three times larger than that of SPAC. While the molecular size of DCF was higher than that of IPB and SALA, and thus it could not penetrate into the internal areas of the micropore. (2) DCF contained more electron donor, thus there could be more π–π interactions between DCF and the graphite like surface (act as electron acceptor) of CNT.25
The SPAC and CNT with the addition of PACl exhibited significantly higher maximum adsorption capacities than the original ones. Because the surfaces of the carbons are negatively charged (zeta potential values of SPAC and CNT were −16.8 and −15.8 mV respectively, Fig. S2†), Al3+ may accumulate from the bulk solution and thus provides larger flocs than the original coagulants. Thus, the flocs with positive charges could adsorb ECs, which were negatively charged at pH 7. Subsequently, the energy required for the particles contact were minimized resulted from the charge neutralization effect. Based on this hypothesis, ECs adsorption could be positively affected by coagulation than the original carbons. After adding PACl, aggregation started to occur and thus benefited the accumulation of ECs. The floc sizes of the aggregated ECs were incapable of diffusing into the inner pores and ECs might have adsorbed onto the outer surface of the carbon. Thus, the total external surface areas of the adsorbents were the key factor for the maximum amount of ECs adsorbed. Therefore, with a larger external surface area and more dispersed form, SPAC could absorb more ECs than CNT. In conclusion, both the surface chemistry and the morphology influenced the adsorption behavior of the molecules on the different adsorbents.
The order of maximum adsorption capacity for the ECs follows the trend: SALA < IBP < DCF. However, when converting Qm value in terms of mol-adsorbate/g-adsorbent, the adsorption capacities of SPAC or CNT are comparable for the three ECs. The maximum adsorption capacities for SALA, IBP, DCF are 0.0568, 0.0405, 0.0555 mol g−1 respectively for SPAC, and 0.0329, 0.0108, 0.0590 mol g−1 respectively for CNT. It is known that the adsorption capacities for these two materials should be directly related to the adsorption sites on the surface. Thus, it can adsorb similar amount of ECs with these three ECs, indicating a similar mol-adsorbate/g-adsorbent. After the addition of PACl, the Qm value of SALA, IBP, DCF for SPAC is 0.241, 0.356 and 0.658 (mol g−1 -(SPAC + PACl)). And the Qm value for CNT is 0.198, 0.264 and 0.271 (mol g−1 -(CNT + PACl). It can be noticed that both materials have a highest adsorption capability of DCF. It may be explained by the following reasons. The PACl will replaced some adsorption sites on the carbon materials by forming flocs. In addition, ECs with a higher log![[thin space (1/6-em)]](https://www.rsc.org/images/entities/char_2009.gif) P values are less soluble in the water and have a higher tendency to adsorb on the flocs. Therefore, there are presented a tendency and a relationship with log
P values are less soluble in the water and have a higher tendency to adsorb on the flocs. Therefore, there are presented a tendency and a relationship with log![[thin space (1/6-em)]](https://www.rsc.org/images/entities/char_2009.gif) P of the ECs.
P of the ECs.
3.3 Coagulation performance in removing ECs
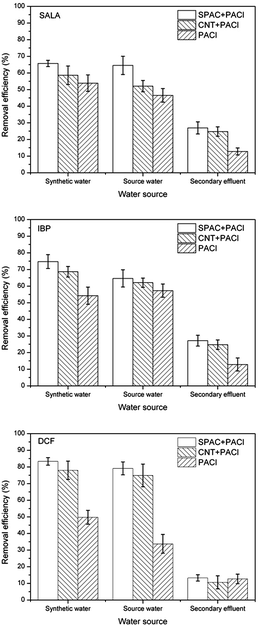
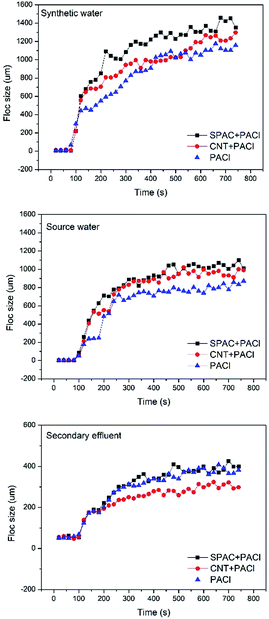
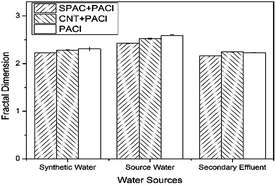
The removal efficiency of ECs from synthetic water and source water during coagulation were about the same. However, poor removal of ECs from secondary effluent was observed, with removal efficiency less than half of that from synthetic water and source water. Secondary effluent consists more organic material of NOM, which were often described as weak anionic polymer with complex structure.28 These compounds were adsorbed onto the surface of the suspended particles and thus coating more negatively charges on the colloidal particles. This process would cause the floc restabilization and lower the possibility of the floc aggregation. As can be seen from Fig. 6, the floc sizes of the secondary effluent are significantly smaller than that of the synthetic water and source water. Furthermore, competitive displacement occurs where high absorption affinity compounds replaced low affinity ones.29 Therefore, with larger concentration of NOM existed in the solution of secondary effluent, the inhibition on ECs plays an important role. Fractal dimensions during coagulation process are shown in Fig. 7. According to the result, fractal dimensions decreased with the addition of carbonaceous materials. This result is in consistent with previous studies.30 The fractal dimension of flocs formed with the addition of CNT is slightly larger than that of SPAC, indicating that flocs formed on the surface of CNT is more compact than that of SPAC.
3.4 Mechanisms and implication
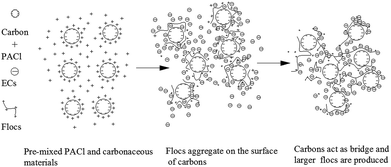
The mechanisms of emerging contaminant removal with pre-mixed SPAC/CNT and PACl could be summarized as Fig. 8. Carbon materials were negatively charged at the original state. After mixing with coagulants, positively charged PACl could be coated on the carbon materials and thus made the adsorbent become positively charged (zeta potential after mixing with SPAC/CNT are demonstrated in Fig. S2†). During coagulation processes, positively charged flocs were formed and aggregated on the surface of carbon materials. And carbons could act as bridge and assemble more particles coated with Al13 flocs, which makes the flocs become larger. ECs could be removed from water either by monolayer adsorption or enmeshment in the flocs. As the flocs become larger with the addition of carbons, ECs could be removed more efficiently.It was demonstrated that coagulation and adsorption could interact with each other and help improve the removal effect of both processes. The finding of this study elucidate that the combination of coagulation and adsorption could achieve a better removal for emerging contaminant, which may provide useful information for developing coagulation based hybrid process for emerging contaminant removal.
4 Conclusions
Emerging contaminants have become an increasing cause of concerns as they can cause a variety of effects on aquatic organisms and human health. This study provided insights into the adsorption behavior of three selected ECs (SALA, IBP and DCF) on SPAC and CNT and the effectiveness of pre-mixed PACl and SPAC/CNT for the removal of ECs. The synergistic effect of coagulation and adsorption process were also discussed in this study. The results of this study could be summarized as follows:(1) Pre-mixed PACl and SPAC/CNT shows significantly better removal ability compared with PACl or SPAC/CNT alone. The maximum adsorption capacities increase at least 5 times after the addition of PACl, attributed to the charge neutralization and adsorption on the flocs.
(2) The addition of SPAC/CNT could help improve the removal efficiency by coagulation, as a result of adsorption of ECs on carbon materials, as well as the bridging effect of the carbons.
(3) As higher pH values facilitate the formation of larger flocs and thus increasing the adsorption and enmeshment of ECs, the ECs removal efficiency improves with the increasing of pH values.
(4) As the three ECs conducted in this study, the removal efficiency always performs as the following trends: SALA (log![[thin space (1/6-em)]](https://www.rsc.org/images/entities/char_2009.gif) P = 1.98) < IBP (log
P = 1.98) < IBP (log![[thin space (1/6-em)]](https://www.rsc.org/images/entities/char_2009.gif) P = 3.84) < DCF (log
P = 3.84) < DCF (log![[thin space (1/6-em)]](https://www.rsc.org/images/entities/char_2009.gif) P = 4.26), indicating that the hydrophobicity of the ECs plays a dominant role.
P = 4.26), indicating that the hydrophobicity of the ECs plays a dominant role.
Acknowledgements
We gratefully thank the National Basic Research Program from Ministry of Science and Technology (no. 2011CB933700), National Natural Science Foundation of China (no. 51378014, 51338008, 51338010).Notes and references
- J. Virkutyte, R. S. Varma and V. Jegatheesan, in Treatment of Micropollutants in Water and Wastewater, IWA Publishing, London, 2010, ch. 1, pp. 1–19 Search PubMed.
- R. Loos, B. M. Gawlik, G. L. Locoro, E. Rimaviciute, S. Contini and G. Bidoglio, Environ. Pollut., 2009, 157, 561–568 CrossRef CAS PubMed.
- A. M. Becker, S. Gerstmann and H. Frank, Chemosphere, 2008, 72, 115–121 CrossRef CAS PubMed.
- S. Mompelat, B. Le Bot and O. Thomas, Environ. Int., 2009, 35, 803–814 CrossRef CAS PubMed.
- N. Bolong, A. F. Ismail, M. R. Salim and T. Matsuura, Desalination, 2009, 239, 229–246 CrossRef CAS PubMed.
- P. Amrita, Y. G. Karina, Y. L. Angela and R. Martin, Sci. Total Environ., 2010, 408, 6062–6069 CrossRef PubMed.
- J. Rivera-Utrilla, M. Sánchez-Polo, M. A. Ferro-García, G. Prados-Joya and R. Ocampo-Pérez, Chemosphere, 2013, 93, 1268–1287 CrossRef CAS PubMed.
- N. M. Vieno, H. Harkki, T. Tuhkanen and L. Kronberg, Environ. Sci. Technol., 2007, 41, 5077–5084 CrossRef CAS.
- A. Kumar and I. Xagoraraki, Sci. Total Environ., 2010, 408, 5972–5989 CrossRef CAS PubMed.
- Y. Wu, Y. Jia and X. Lu, Ecotoxicol. Environ. Saf., 2013, 94, 138–146 CrossRef CAS PubMed.
- M. L. Farré, S. Pérez, L. Kantiani and D. Barceló, TrAC, Trends Anal. Chem., 2008, 27, 991–1007 CrossRef PubMed.
- M. Huerta-Fontela, M. T. Galceran and F. Ventura, Water Res., 2011, 45, 1432–1442 CrossRef CAS PubMed.
- D. P. Grover, J. L. Zhou, P. E. Frickers and J. W. Readman, J. Hazard. Mater., 2011, 185, 1005–1011 CrossRef CAS PubMed.
- K. Košutić, D. Dolar, D. Ašperger and B. Kunst, Sep. Purif. Technol., 2007, 53, 244–249 CrossRef PubMed.
- C. Zwiener and F. H. Frimmel, Water Res., 2000, 34, 1881–1885 CrossRef CAS.
- C. Park, Y. Fang, S. N. Murthy and J. T. Novak, Water Res., 2010, 44, 1335–1340 CrossRef CAS PubMed.
- B. Ruiz, I. Cabrita, A. S. Mestre, J. B. Parra, J. Pires, A. P. Carvalho and C. O. Ania, Appl. Surf. Sci., 2010, 256, 5171–5175 CrossRef CAS PubMed.
- E. S. Rigobello, A. Di Bernardo Dantas, L. Di Bernardo and E. M. Vieira, Chemosphere, 2013, 92, 184–191 CrossRef CAS PubMed.
- N. Ando, Y. Matsui, H. Sasaki, T. Matsushita and K. Ohno, Water Res., 2011, 45, 761–767 CrossRef CAS PubMed.
- C. Lu and F. Su, Sep. Purif. Technol., 2007, 58, 113–121 CrossRef CAS PubMed.
- Z. Wang, X. Yu, B. Pan and B. Xing, Environ. Sci. Technol., 2010, 44, 978–984 CrossRef CAS PubMed.
- L. Zhang, F. Pan, X. Liu, L. Yang, X. Jiang, J. Yang and W. Shi, Chem. Eng. J., 2013, 218, 238–246 CrossRef CAS PubMed.
- Q. Bu, B. Wang, J. Huang, S. Deng and G. Yu, J. Hazard. Mater., 2013, 262, 189–211 CrossRef CAS PubMed.
- B. Lo and D. Waite, J. Colloid Interface Sci., 2000, 222, 83–89 CrossRef CAS PubMed.
- D. Zhu and J. J. Pignatello, Environ. Sci. Technol., 2005, 39, 2033–2041 CrossRef CAS.
- X. Ma, G. Zeng, C. Zhang, Z. Wang, J. Yu, J. Li, G. Huang and H. Liu, J. Colloid Interface Sci., 2009, 337, 408–413 CrossRef CAS PubMed.
- J. Lin, C. Chin, C. Huang, J. Pan and D. Wang, Water Res., 2008, 42, 4281–4290 CrossRef CAS PubMed.
- E. L. Sharp, P. Jarvis, S. A. Parsons and B. Jefferson, Colloids Surf., A, 2006, 286, 104–111 CrossRef CAS PubMed.
- M. J. Avenea and J. K. Koopal, Environ. Sci. Technol., 1999, 33, 2739–2744 CrossRef.
- H. Xu, F. Xiao and D. S. Wang, Sep. Purif. Technol., 2014, 124, 9–17 CrossRef CAS PubMed.
Footnote |
| † Electronic supplementary information (ESI) available: Supplementary information includes water quality and preliminary experiment results. See DOI: 10.1039/c5ra03183d |
| This journal is © The Royal Society of Chemistry 2015 |


![[thick line, graph caption]](https://www.rsc.org/images/entities/char_e117.gif) ), CNT (
), CNT (![[dash dash, graph caption]](https://www.rsc.org/images/entities/char_e091.gif) ), SPAC + PACl (⋯), SPAC (
), SPAC + PACl (⋯), SPAC (![[dash dot, graph caption]](https://www.rsc.org/images/entities/char_e090.gif) ).
).