Adhesion and bending rigidity-mediated wrapping of carbon nanotubes by a substrate-supported cell membrane†
Yonggang Zheng,
Huayuan Tang,
Hongfei Ye and
Hongwu Zhang*
State Key Laboratory of Structural Analysis for Industrial Equipment, Department of Engineering Mechanics, Faculty of Vehicle Engineering and Mechanics, Dalian University of Technology, Dalian 116024, P. R. China. E-mail: zhanghw@dlut.edu.cn
First published on 8th May 2015
Abstract
A fundamental understanding of the adhesive interaction between carbon nanotubes (CNTs) and a cell membrane is essential for the design and potential applications of CNT-based drug delivery systems, gene carries, as well as biosensors. In this work, we set up a theoretical model to explore the wrapping effect of a substrate-supported membrane on CNTs, taking the deformation of CNTs into consideration. Our results show that the competition between the membrane bending stiffness and the CNT–membrane adhesion strength induces a double-edged effect on the stability of a single CNT wrapped by a substrate-supported membrane, that is, the membrane can facilitate the laying down and collapse of the CNT due to its bending rigidity, while it tends to maintain the upright and open shape of the CNT as a result of the CNT–membrane adhesion. The phase boundary for the open and collapsed configurations due to this competition can be well described by a simple analytical model. Furthermore, the competition can also result in the transition of the membrane between adhering to and detaching from the substrate in the system of two widely spaced CNTs covered by a substrate-supported cell membrane, which is consistent with experimental observations.
1 Introduction
The interactions between nanomaterials and a cell membrane are significant issues to assess the potential nanotoxicity and enhance the efficiency of drug delivery systems and have been investigated extensively in recent years, such as in studies on the mechanics of receptor-mediated endocytosis of nanoparticles1–3 and the toxicity of nanomaterials.4–7 As one of the most intriguing nanomaterials, carbon nanotubes (CNTs), due to their unique mechanical, physical, electrical and chemical properties, have shown great potential applications in biomedical devices. For example, CNTs can serve as artificial trans-membrane channels for water transportation8,9 and key components of biosensors integrated by CNTs and cell membranes for directly translating the interaction between target molecules and the CNT surface into electrical signals.10–13 It is thus of great importance to understand the interaction between CNTs and cell membranes.In the past decade, a lot of works have been conducted and many significant progresses have been made to study the CNT–membrane interaction. For examples, Cui et al.14 found that cell membrane can wrap the CNTs into nodular structure. Shi et al.15 showed that CNTs can enter the cell membrane via wrapping or directly piercing mechanism depending on the diameters of CNTs. Later, Shi et al.16 discovered that nanotubes with end caps or carbon shells can enter the cell by tip recognition and rotation. Yi et al.17 proposed that the interaction mode of one-dimensional nanomaterials with cell membrane is determined by a dimensionless parameter ![[small sigma, Greek, macron]](https://www.rsc.org/images/entities/i_char_e0d2.gif) = 2σa2/κ, where σ and κ are the membrane tension and bending stiffness, respectively, and a is the radius of nanomaterials. All these results were obtained by ignoring the deformation of CNTs during the interaction with the cell membrane. However, both experimental18 and theoretical19,20 studies have confirmed the importance of the elastic deformation of nanomaterials during the interaction with cell membrane. When considering the CNT–membrane interaction, the bending stiffness of cell membrane is in the order of 1 eV,21 which is close to that of the CNT.22 Therefore, the CNT–membrane interaction can induce the finite radial deformation of CNTs, especially the radial collapse of CNTs. The collapsed configuration consists of middle flat regions and two highly strained circular edges at each end. Significant differences have been found between the properties of the circular configuration and the collapsed one. For examples, the electrical conductivity of collapsed CNTs is higher than that of circular ones23 and the strength of super-strong nanotube bundles based on collapsed CNTs can be enhanced up to about 130% compared with their circular counterparts.24,25 Moreover, the collapse of CNTs may induce abnormal CNT–membrane interactions and thus tune the functionalities of CNT-based bio-devices, which need to be well understood for practical uses.
= 2σa2/κ, where σ and κ are the membrane tension and bending stiffness, respectively, and a is the radius of nanomaterials. All these results were obtained by ignoring the deformation of CNTs during the interaction with the cell membrane. However, both experimental18 and theoretical19,20 studies have confirmed the importance of the elastic deformation of nanomaterials during the interaction with cell membrane. When considering the CNT–membrane interaction, the bending stiffness of cell membrane is in the order of 1 eV,21 which is close to that of the CNT.22 Therefore, the CNT–membrane interaction can induce the finite radial deformation of CNTs, especially the radial collapse of CNTs. The collapsed configuration consists of middle flat regions and two highly strained circular edges at each end. Significant differences have been found between the properties of the circular configuration and the collapsed one. For examples, the electrical conductivity of collapsed CNTs is higher than that of circular ones23 and the strength of super-strong nanotube bundles based on collapsed CNTs can be enhanced up to about 130% compared with their circular counterparts.24,25 Moreover, the collapse of CNTs may induce abnormal CNT–membrane interactions and thus tune the functionalities of CNT-based bio-devices, which need to be well understood for practical uses.
In this work, we present a two-dimensional continuum model to investigate the morphology of CNTs covered by substrate-supported membrane. The membrane is modeled following the Canham–Helfrich's framework and the energy of the CNT contains bending energy and van der Waals self-interaction energy. The model also takes the interaction between the substrate, the CNT and the membrane into consideration. We demonstrate how the stability and morphology of CNTs wrapped by substrate-supported membrane can be mediated by the competition between the membrane bending stiffness and the CNT–membrane adhesion strength. We also present phase diagrams to describe the competition-mediated wrapping of a single CNT and two widely spaced CNTs by the substrate-supported membrane.
2 Models and methods
In our two-dimensional continuum model, as illustrated in Fig. 1, the membrane is modeled as a continuous line since it has been demonstrated that the CNT-supported membrane can retain its continuity.11 The CNTs are also represented by closed and continuous lines and the substrate is modeled as a rigid and infinitely-long line.22 This system is similar to the experimental one studied in Zhou et al.'s work,11 in which the CNT contacts with the membrane and doesn't destroy the continuous profile of the membrane. The total energy of the system is| E = Ebm + Etm + Ebc + Ecc + Ecm + Esm + Esc, | (1) |
The membrane is modeled by the Canham–Helfrich's model21,26 and the bending energy of the membrane Ebm can be described as
 | (2) |
 and
and  with the boundary conditions xm(0) = −L and ym(0) = h. In actual calculation, the total arc length of the membrane profile 2L should be large enough to eliminate the boundary effect and h should be chosen as the equilibrium distance between the membrane and the substrate. To further simplify the calculation, the tangent angle is expanded in Fourier series as
  where An are the Fourier coefficients. Thus we have
  . Similarly, the shape of the CNT can be described by xc(sc) and yc(sc) and the corresponding tangent angle ϕ(sc) is expanded in Fourier series as
  where Bm are the Fourier coefficients, which should satisfy the boundary conditions, i.e. ϕ(πd) − ϕ(0) = 2π, xc(πd) = xc(0) and yc(πd) = yc(0). Thus, the bending energy of CNT Ebc can be expressed as
  . The tension energy Etm of the membrane can be expressed as
  , that is, the multiplication between the tension σ and the excess length.
The self-interaction of the CNT and the CNT–substrate interaction are modeled by Lennard-Jones (LJ) 12–6 potentials.27,28 The CNT–membrane and substrate–membrane interaction can be described by the adhesion energy, which is usually represented by the product of the adhesion strength and the contact area,29 while a more accurate calculation is to integrate the Morse potential30,31 or LJ potential.32 For the sake of accuracy and unification, here, we adopt LJ potential to calculate the adhesion energy. Because the adhesion energy is mainly determined by the interfaces properties of material, we can simplify the calculation by integrating the LJ potentials over the surface atoms. That is, the adhesion energy between the CNT and the membrane is given by28
| Ecm = ∫ρmdSm∫Vcm(r)ρcdSc, | (3) |
 , where εcm is the depth of the potential and σcm is a parameter determined by the equilibrium distance. By integrating the LJ potential over surfaces (details can be found in the ESI†), Ecm can be finally expressed as33
 | (4) |
The system parameters are list in Table 1 and the equilibrium configuration of the system is influenced by many of them. Getting a complete phase diagram of the equilibrium configuration is difficult and beyond the scope of this paper. Here we mainly focus on these factors that may have significant influences on the final configurations. For simplicity, all the equilibrium separation distances in the present model are set to be 0.34 nm (i.e., σcc = σcm = σsm = σsc = 0.34 nm).22 The van der Waals self-adhesion strength of the CNT, the CNT–substrate and the membrane–substrate adhesion strength are all set to be 2.29 eV nm−2 (i.e., Ucc = Usc = Usm = 2.29 eV nm−2).
| Symbol | Meaning | Values |
|---|---|---|
| d | Diameter of the CNT | 2–4 nm |
| L | Half length of the membrane profile | 10 nm |
| Dm | Bending stiffness of membrane | 1–6 eV |
| Dc | Bending stiffness of the CNT | 1.4 eV |
| σ | Membrane tension | 2 × 10⁻⁵ to 2 × 10⁻³ eV nm−2 |
| σcm (σsc, σsm) | LJ parameters | 0.34 nm |
| Ucm | CNT–membrane adhesion strength | 0.2–1.6 eV nm−2 |
| Usc | Substrate–CNT adhesion strength | 2.29 eV nm−2 |
| Usm | Substrate–membrane adhesion strength | 2.29 eV nm−2 |
3 Results and discussion
One CNT wrapped by the membrane
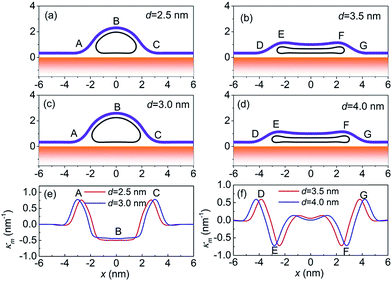
Whether the CNT collapses or not can be determined by energetic comparison of systems with open and collapsed CNTs.34 At the critical diameter, there is no energy difference between two configurations. For free CNT, the critical diameter predicted by the present model is 4.3 nm (see Fig. S1a in the ESI†), which is consistent with previous studies.35 When the CNT is supported on the substrate, the van der Waals interaction between the CNT and the substrate can further distort its configuration, resulting in elliptical geometries.35 The corresponding critical diameter is 2.9 nm (see Fig. S1b in the ESI†), which is smaller than that of the free CNT, indicating that the CNT–substrate interaction can enhance the stability of collapsed geometries. When the CNTs are covered by the membrane, the transition critical diameter further changes. For instance, when Dm = 4.0 eV, Ucm = 0.64 eV nm−2 and σ = 2 × 10⁻³ eV nm−2, the critical diameter is 3.2 nm (see Fig. S1c in the ESI†), which is smaller than that for the free CNT but larger than that for the CNT on a substrate. However, it should be noted that, when the diameter of the CNT is larger than the critical diameter, an energy barrier should be overcome to change the system from an open configuration to a collapsed one. Details of the transition between the neighbor minima can be found in the ESI.† Moreover, the critical diameter can be regulated by changing the bending stiffness of the membrane and the CNT–membrane adhesion strength, which will be discussed later.To clarify the diameter-dependent effect, the curvatures of membrane, which reflect disturbance of membrane, are calculated and plotted in Fig. 2. For CNTs with d = 2.5 nm and d = 3.0 nm, open geometries are the stable ones, see Fig. 2a and c. When the CNT is open, the membrane curvature has two peaks (points A and C), occurring when the membrane begins to detach from (point A) and adhere to (point C) the substrate, respectively. For the CNT with d = 3.0 nm, the disturbance width (i.e., the total width of membrane where the curvature is nonzero) is 4.0 nm and the maximum curvature is 0.78 nm−1, which are slightly larger than 3.5 nm and 0.76 nm−1 for the CNT with d = 2.5 nm, indicating that larger diameter CNT in open geometry leads to larger deformation of the membrane. The conclusion is consistent with that of the CNT–graphene system.8 When the diameters are 3.5 nm and 4.0 nm, the collapsed geometries are more stable, see Fig. 2b and d. In these cases, the membrane curvature has four peak values. Apart from points D and G, the same as open geometries, the membrane wrapping around the ends of collapsed CNT (points E and F) can also be highly curved. The disturbance width of the membrane is 10.46 nm for the CNT with d = 4.0 nm and 9.5 nm for the CNT with d = 3.5 nm, which are much larger than that for open CNTs. The membrane curvatures at points D and E are 0.60 nm−1 and −0.73 nm−1, respectively, which are the same for both diameters. This can be attributed to that the elliptical ends of the collapsed CNT have a fixed diameter and the distance between two flat walls at the middle section is also unchanged for various diameters.36
It has been found that the membrane tension plays an important role in the nanomaterial–membrane interaction.29 Moreover, the membrane tension can be mediated by Ca2+ ions37 and the typical membrane tension varies in a wide range from 0.003 mN m−1 to 1 mN m−1 (i.e., about from 10−5 eV nm−2 to 10−3 eV nm−2).38 To investigate the influence of membrane tension, configurations of systems with σ = 2 × 10⁻³ eV nm−2, 2 × 10⁻⁴ eV nm−2 and 2 × 10⁻⁵ eV nm−2 are calculated (other parameters keep unchanged). Surprisingly, little differences have been found regard to the system energy, deformations of the membrane and CNT. That is, the membrane tension plays a negligible role in the equilibrium configuration of the membrane–nanomaterial system, which is different from the results of Yi et al.17 This variance can be explained in that the radius of the one-dimensional nanomaterial studied by Yi et al. is a = 40–150 nm, so small membrane tension σ = 0.002–0.033 mN m−1 can lead to the dimensionless parameter ![[small sigma, Greek, macron]](https://www.rsc.org/images/entities/i_char_e0d2.gif) = 2σa2/Dm ≈ 1. When the radius is down to 2 nm,
= 2σa2/Dm ≈ 1. When the radius is down to 2 nm, ![[small sigma, Greek, macron]](https://www.rsc.org/images/entities/i_char_e0d2.gif) is much smaller than 1, indicating that the tension energy contribution is much smaller as compared with the bending energy. In the following discussions, σ is set to be 2 × 10⁻³ eV nm−2 for simplicity.
is much smaller than 1, indicating that the tension energy contribution is much smaller as compared with the bending energy. In the following discussions, σ is set to be 2 × 10⁻³ eV nm−2 for simplicity.
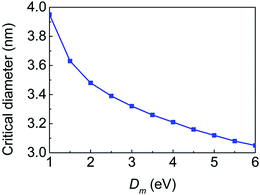
The bending stiffness of membrane, which can be adjusted by the proteins and the actin polymerization beneath the membrane, is a key factor that can affect the critical diameter and the equilibrium configurations of the system.19 To investigate the influence of the bending stiffness, systems with different bending stiffnesses are considered. It is found that the critical diameter decreases from 3.95 nm to 3.05 nm when Dm increases from 1.0 eV to 6.0 eV (here the CNT–membrane adhesion strength is fixed as 0.64 eV nm−2), as shown in Fig. 3. The decrease of the critical diameter is mainly ascribed to the fact that when the membrane becomes stiffer, the system adopts more flat configuration to lower the bending energy of the membrane, which makes the CNT easier to collapse.
 | ||
| Fig. 3 The critical diameter as a function of the bending stiffness of the membrane. The CNT–membrane adhesion strength is fixed as 0.64 eV nm−2. | ||
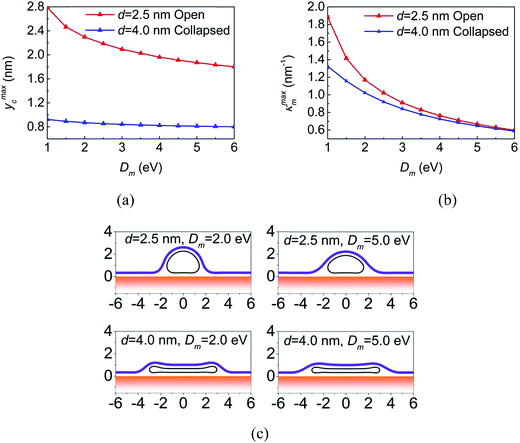
To further evaluate the influence of the bending stiffness on the equilibrium configurations, systems containing CNTs with d = 2.5 nm and d = 4.0 nm are investigated since when Dm varies from 1.0 eV to 6.0 eV, these CNTs can always keep open and collapsed geometries, respectively, as indicated in Fig. 3. The maximum y coordinate of the CNT (ymaxc) and the maximum curvature of the membrane (κmaxm) as a function of Dm are shown in Fig. 4a and b. For systems with the small CNT, ymaxc decreases from 2.79 nm to 1.80 nm when the membrane becomes stiffer, that is, the stiffer membrane forces the CNT to be flat shape (see the up row in Fig. 4c). However, ymaxc of the collapsed large-diameter CNT changes slightly from 0.92 nm to 0.80 nm (see the bottom row in Fig. 4c) because further deformation of the collapsed CNT will causes high repulsive van der Waals force between the walls of the CNT. As for the deformation of the membrane, the maximum curvature of the membrane decreases as the membrane becomes stiffer in both open and collapsed configurations.
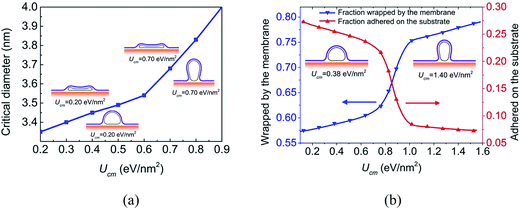
Nanoparticle–membrane adhesion strength has been demonstrated to critically govern their cellular uptake.39 The CNT–membrane interaction strength can be adjusted by functionalizing the CNT with proteins or other molecules.15 To understand the influence of CNT–membrane adhesion strength, systems with different Ucm are also considered. The critical diameter for the CNT wrapped by Dm = 1.4 eV membrane as a function of the CNT–membrane adhesion strength is plotted in Fig. 5a. Generally, the critical diameter increases when the CNT–membrane adhesion strength becomes stronger. However, two different stages can be found, that is, the critical diameter increases rapidly when the CNT–membrane adhesion strength is strong, while it increases slowly when the adhesion strength becomes weak. This is because that a large proportion of the CNT in open configuration is wrapped by the membrane instead of adhering on the substrate when the CNT–membrane adhesion strength is strong. As mentioned before, the substrate adhesion would stabilize the collapsed configuration.
To clearly describe the contact area, the surface fractions of the CNT with d = 3.0 nm wrapped by the membrane and adhered on the substrate are calculated and shown in Fig. 5b. When Ucm is small, the long axis of the CNT is parallel to the substrate, and a large portion of the CNT is adhered to the substrate (see the left inset in Fig. 5b). The fraction of CNT wrapped by the membrane is about 57%. When Ucm reaches about 1.00 eV nm−2, the fraction of the CNT wrapped by the membrane becomes about 74% (see the right inset in Fig. 5b). The fast increase can be attributed to the reorientation of the long axis of the CNT, namely from parallel to the substrate to perpendicular to the substrate. At the same time, the fraction of the CNT adhered to the substrate decreases from 27% when Ucm = 0.13 eV nm−2 to 7% when Ucm = 1.65 eV nm−2. The transition of the surface fraction indicates the adhesion energy competition mechanism between CNT–membrane interaction and CNT–substrate interaction. This configuration transition is similar to the ‘laying down to standing up’ endocytic pathway of spherocylindrical nanoparticles driven by the competition of the nanoparticle–membrane adhesion energy and the membrane bending energy as revealed by Huang et al.40 and the omega shape of the membrane as shown in Fig. 5 is also similar to the morphology of membrane supported by a nanowire observed in experiments.41
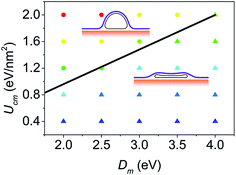
Furthermore, to identify how the bending stiffness of membrane and the CNT–membrane adhesion strength influence the equilibrium configuration, a phase diagram for system with d = 3.5 nm CNT is plotted in Fig. 6. Generally, it can be seen that large bending stiffness can stabilize the collapsed configuration while strong CNT–membrane adhesion strength makes the open configuration more energetically favored, which is consistent with above discussions. The phase diagram is similar to the one proposed by Chang et al.42 to characterize the influence of temperature on the energetically favored configuration of CNT. Both the results of Chang et al. and this paper suggest that the equilibrium configuration of CNT cannot be determined solely by the mechanical properties of the CNT, but also the surrounding environment, such as the properties of membrane. Furthermore, from Fig. 6 we can see that there is a clear phase boundary to distinguish the open and collapsed configurations, which can be well described by a simply analytical model (details can be found in the ESI†). This model suggests that the phase boundary can be approximated by a straight line Ucm = C1Dm − C2 as shown in Fig. 6 with C1 = 0.519 and C2 = 0.079.
Two parallel CNTs wrapped by the membrane
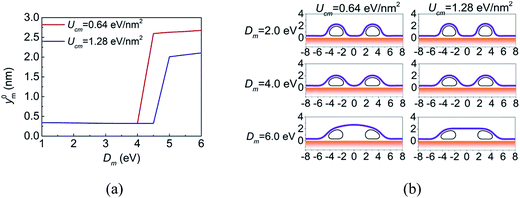
Structures of CNTs networks covered by lipid membrane have shown high performance in the selective detection of the presence and activities of ionophores in native lipid environment.13 Here, the morphology of the membrane regulated by two parallel CNTs, as shown in Fig. 1b, is also investigated. The considered situation is limited to widely spaced parallel CNTs, so that the van der Waals interaction between two CNTs can be neglected. The distance between the CNTs is defined as the distance between the centers of the deformed configurations. The diameters of the CNTs are 2.0 nm, which are small enough to make the open configurations energetically stable. Fig. 7a plots the y coordinates of the membrane at the center between two CNTs (y0m) as a function of the bending stiffness of the membrane. The center distance of the CNTs is fixed at 6.0 nm. When the membrane is very flexible, it wraps around the CNT and contacts with the substrate. In this case, y0m tends to be a constant that is the equilibrium distance between the membrane and the substrate. Increasing the rigidity of the membrane before a critical value makes little change to y0m. By contrast, when Dm is large enough, the membrane would detach from the substrate. These results are consistent with the observations of Gagner et al.,43 that is, they found via SEM that the single bilayer membrane does not conform to the surface structure of hydrophilized CNTs thin-films and hypothesized that the membrane adopts a flat and lamella-like configuration and bridges the basins of the CNT network due to a high membrane rigidity. Apart from the bending stiffness of the membrane, the morphology of the system can also be regulated by the center distance of the CNTs, see ESI† for details.A significant feature in Fig. 7a is the sharp transition of y0m when Dm reaches a critical value Dcrm, which reflects that the morphology of the membrane between the CNTs snaps between (a) well conforming to the CNTs and adhering to the substrate and (b) detaching from the substrate. The snap-through instability has also been observed in graphene morphology regulated by nanowires44 and by substrate with periodic surface grooves.45,46 All these snap-through instabilities can be attributed to the double-well of the total energy at the critical bending stiffness, which can be demonstrated by the fact that near the critical bending stiffness, the above two morphologies have almost the same energy. The value of Dcrm can be controlled by the diameter of the CNT, the adhesion strength of CNT–membrane and the center distance of the CNTs. For example, when Ucm = 0.64 eV nm−2, the critical bending stiffness is Dcrm = 4.0–4.5 eV, and when Ucm = 1.28 eV nm−2, the critical bending stiffness increases to Dcrm = 4.5–5.0 eV. Some typical configurations are shown in Fig. 7b.
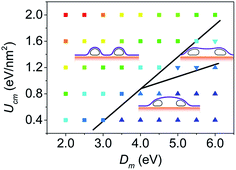
Fig. 8 shows the phase diagram that characterizes the effects of bending stiffness of the membrane and the CNT–membrane adhesion strength. The phase diagram is divided into three regions. In general, when the membrane is flexible or the CNT–membrane adhesion strength is strong, the membrane would conform well to the CNTs and adhere to the substrate. When the bending stiffness of the membrane is large and the CNT–membrane adhesion is weak, the membrane would adopt a convex configuration and the geometry is similar with an arc supported by the two ends. When the bending stiffness and the CNT–membrane adhesion are mediate, the membrane would detach from the substrate but still partially conform to the CNTs, which finally form a concave shape. The phase diagram reflects that the transition of the equilibrium configuration is due to the competition between the bending energy of the membrane with the CNT–membrane and membrane–substrate adhesion energies.
4 Conclusions
In summary, considering the deformability of CNTs, we have studied the morphology of bio-systems that composed of CNTs, cell membrane and substrate. It is found that the presence of the substrate can facilitate the collapse of the CNT and thus reduce the critical diameter of the CNT to collapse. Moreover, the critical diameter of a single CNT wrapped by substrate-supported membrane decreases or increases with the increase of the membrane bending stiffness or the CNT–membrane adhesion strength, respectively. This indicates that increasing the membrane bending stiffness or reducing the CNT–membrane adhesion strength will facilitate the laying down and collapse of the CNT. In addition, changing the membrane bending stiffness and the CNT–membrane adhesion strength can also induce three distinguished configurations of the system composed of two widely spaced CNTs, cell membrane and substrate. These conclusions are clearly demonstrated and explained by the phase diagrams proposed in this work. These results provide useful guidance for the design of CNT-based biosensors. Although the present work mainly focuses on interaction between CNTs and cell membrane, our model can be easily applied to study the wrinkle networks in supported graphene,47 the morphology of graphene suspended on nanostructured substrate27 and the stability of ultrathin liquid films on nanostructured surfaces.48Acknowledgements
The supports from the National Natural Science Foundation of China (11272003, 11232003 and 91315302), Program for New Century Excellent Talents in University (NCET-13-0088), the 111 Project (B08014), PhD Programs Foundation of Ministry of Education of China (20130041110050) and Fundamental Research Funds for the Central Universities are gratefully acknowledged.References
- H. Gao, W. Shi and L. B. Freund, Proc. Natl. Acad. Sci. U. S. A., 2005, 102, 9469 CrossRef CAS PubMed.
- R. Vácha, F. J. Martinez-Veracoechea and D. Frenkel, Nano Lett., 2011, 11, 5391 CrossRef PubMed.
- P. Decuzzi and M. Ferrari, Biomaterials, 2007, 28, 2915 CrossRef CAS PubMed.
- M. A. Dobrovolskaia and S. E. McNeil, Nat. Nanotechnol., 2007, 2, 469 CrossRef CAS PubMed.
- A. Nel, T. Xia, L. Mädler and N. Li, Science, 2006, 311, 622 CrossRef CAS PubMed.
- J. Q. Lin, Y. G. Zheng, H. W. Zhang and Z. Chen, Langmuir, 2011, 27, 8323 CrossRef CAS PubMed.
- J. Q. Lin, H. W. Zhang, Z. Chen and Y. G. Zheng, ACS Nano, 2010, 4, 5421 CrossRef CAS PubMed.
- B. Liu, X. Li, B. Li, B. Xu and Y. Zhao, Nano Lett., 2009, 9, 1386 CrossRef CAS PubMed.
- J. Geng, K. Kim, J. Zhang, A. Escalada, R. Tunuguntla, L. R. Comolli, F. I. Allen, A. V. Shnyrova, K. R. Cho, D. Munoz, Y. M. Wang, C. P. Grigoropoulos, C. M. Ajo-Franklin, V. A. Frolov and A. Noy, Nature, 2014, 514, 612 CrossRef CAS PubMed.
- K. Bradley, A. Davis, J.-C. P. Gabriel and G. Grüner, Nano Lett., 2005, 5, 841 CrossRef CAS PubMed.
- X. Zhou, J. M. Moran-Mirabal, H. G. Craighead and P. L. McEuen, Nat. Nanotechnol., 2007, 2, 185 CrossRef CAS PubMed.
- C. Kataoka-Hamai and Y. Miyahara, Sci. Technol. Adv. Mater., 2010, 11, 033001 CrossRef.
- Y. Huang, P. V. Palkar, L. J. Li, H. Zhang and P. Chen, Biosens. Bioelectron., 2010, 25, 1834 CrossRef CAS PubMed.
- D. Cui, F. Tian, C. S. Ozkan, M. Wang and H. Gao, Toxicol. Lett., 2005, 155, 73 CrossRef CAS PubMed.
- X. Shi, Y. Kong and H. Gao, Acta Mech. Sin., 2008, 24, 161 CrossRef CAS PubMed.
- X. Shi, A. von dem Bussche, R. H. Hurt, A. B. Kane and H. Gao, Nat. Nanotechnol., 2011, 6, 714 CrossRef CAS PubMed.
- X. Yi, X. Shi and H. Gao, Nano Lett., 2014, 14, 1049 CrossRef CAS PubMed.
- K. A. Beningo and Y. L. Wang, J. Cell Sci., 2002, 115, 849 CAS.
- X. Yi, X. Shi and H. Gao, Phys. Rev. Lett., 2011, 107, 098101 CrossRef.
- X. Yi and H. Gao, Phys. Rev. E: Stat., Nonlinear, Soft Matter Phys., 2014, 89, 062712 CrossRef.
- R. Lipowsky, Nature, 1991, 349, 475 CrossRef CAS PubMed.
- V. Perebeinos and J. Tersoff, Nano Lett., 2014, 14, 4376 CrossRef CAS PubMed.
- W. J. Yu, S. H. Chae, D. Perello, S. Y. Lee, G. H. Han, M. Yun and Y. H. Lee, ACS Nano, 2010, 4, 5480 CrossRef CAS PubMed.
- N. M. Pugno, J. Mech. Phys. Solids, 2010, 58, 1397 CrossRef CAS PubMed.
- Y. Cheng, N. M. Pugno, X. Shi, B. Chen and H. Gao, J. Appl. Mech., 2013, 80, 040902 CrossRef.
- W. Helfrich, Z. Naturforsch., C: Biochem., Biophys., Biol., Virol., 1973, 28, 693 CAS.
- M. Neek-Amal and F. M. Peeters, Phys. Rev. B: Condens. Matter Mater. Phys., 2012, 85, 195445 CrossRef.
- L. Girifalco and M. Hodak, Phys. Rev. B: Condens. Matter Mater. Phys., 2002, 65, 125404 CrossRef.
- M. Deserno, Phys. Rev. E: Stat., Nonlinear, Soft Matter Phys., 2004, 69, 031903 CrossRef.
- M. Raatz, R. Lipowsky and T. R. Weikl, Soft Matter, 2014, 10, 3570 RSC.
- A. H. Bahrami, M. Raatz, J. Agudo-Canalejo, R. Michel, E. M. Curtis, C. K. Hall, M. Gradzielski, R. Lipowsky and T. R. Weikl, Adv. Colloid Interface Sci., 2014, 208, 214 CrossRef CAS PubMed.
- J. Wang, H. Yao and X. Shi, J. Mech. Phys. Solids, 2014, 73, 151 CrossRef CAS PubMed.
- J. Zhao, J.-W. Jiang, Y. Jia, W. Guo and T. Rabczuk, Carbon, 2013, 57, 108 CrossRef CAS PubMed.
- T. Tang, A. Jagota, C.-Y. Hui and N. J. Glassmaker, J. Appl. Phys., 2005, 97, 074310 CrossRef PubMed.
- C. Zhang, K. Bets, S. S. Lee, Z. Sun, F. Mirri, V. L. Colvin, B. I. Yakobson, J. M. Tour and R. H. Hauge, ACS Nano, 2012, 6, 6023 CrossRef CAS PubMed.
- A. Pantano, D. M. Parks and M. C. Boyce, J. Mech. Phys. Solids, 2004, 52, 789 CrossRef CAS PubMed.
- I. Gözen, B. Ortmen, I. Põldsalu, P. Dommersnes, O. Orwar and A. Jesorka, Soft Matter, 2013, 9, 2787 RSC.
- C. E. Morris and U. Homann, J. Membr. Biol., 2001, 179, 79 CAS.
- H. Yuan, J. Li, G. Bao and S. Zhang, Phys. Rev. Lett., 2010, 105, 138101 CrossRef.
- C. Huang, Y. Zhang, H. Yuan, H. Gao and S. Zhang, Nano Lett., 2013, 13, 4546 CrossRef CAS PubMed.
- N. Misra, J. A. Martinez, S. C. J. Huang, Y. Wang, P. Stroeve, C. P. Grigoropoulos and A. Noy, Proc. Natl. Acad. Sci. U. S. A., 2009, 106, 13780 CrossRef CAS PubMed.
- T. Chang and Z. Guo, Nano Lett., 2010, 10, 3490 CrossRef CAS PubMed.
- J. Gagner, H. Johnson, E. Watkins, Q. Li, M. Terrones and J. Majewski, Langmuir, 2006, 22, 10909 CrossRef CAS PubMed.
- Z. Zhang and T. Li, J. Appl. Phys., 2010, 107, 103519 CrossRef PubMed.
- T. Li and Z. Zhang, Nanoscale Res. Lett., 2009, 5, 169 CrossRef PubMed.
- T. Li and Z. Zhang, J. Phys. D: Appl. Phys., 2010, 43, 075303 CrossRef.
- K. Zhang and M. Arroyo, J. Mech. Phys. Solids, 2014, 72, 61 CrossRef CAS PubMed.
- H. Hu, C. R. Weinberger and Y. Sun, Nano Lett., 2014, 14, 7131 CrossRef CAS PubMed.
Footnote |
| † Electronic supplementary information (ESI) available. See DOI: 10.1039/c5ra04426j |
| This journal is © The Royal Society of Chemistry 2015 |


