A consensus subunit-specific model for annotation of substrate specificity for ABC transporters†
Yayun Hu,
Yanzhi Guo*,
Yinan Shi,
Menglong Li and
Xuemei Pu*
College of Chemistry, Sichuan University, Chengdu 610064, People's Republic of China. E-mail: yzguo@scu.edu.cn; xmpuscu@scu.edu.cn; Fax: +86-028-85412290; Tel: +86-028-85412290
First published on 5th May 2015
Abstract
Members of the ATP-binding cassette (ABC) transporter family are present in three kingdoms of life and play a vital role in most cellular functions. ABC transporters function as either importers that bring nutrients and other molecules into cells, or as exporters that pump toxins, drugs and lipids across membranes. Currently, the limitation of 3D structures highlights the importance of the functional annotation for transporters using bioinformatics-based methods. In this work, we focused on annotation of substrate specificity for ABC transporters. Three types of the subunit proteins of ABC transporters, namely permease protein, ATP-binding protein and substrate binding protein all contribute much to the transport process, but have unique structures and properties. However previous computational methods have only considered the three subunit proteins in the same way and cannot individually characterize each type of subunit protein. Here, through individual feature evaluation and selection, specific representation for each type of subunit protein was implemented. Then three subunit-specific models were built to consistently analyse four major classes of ABC transporters with different transport targets. Our method achieved a 5-fold cross validation accuracy of 93.35%, 84.34%, 87.24% and 81.96% for sugar transporter, ion transporter, amino acid/protein transporter and others, respectively. Our method also showed an overall prediction accuracy of 88.02% with a Mathew's correlation coefficient of 0.6736 on an independent dataset. The results suggest that considering three subunit proteins separately and developing individual models for three substrate protein groups are recommendable. This method would be an effective tool for computational annotation of substrate specificity for ABC transporters.
1. Introduction
A transporter is a necessary medium for transport processes that are essential biological actions for all life and endow many processes, including metabolism, communication, biosynthesis, and reproduction. They allow the entry of all essential nutrients into cells and efflux toxic substances to provide the cell with a benign growing environment.1 The importance of transporters to cells can been illustrated by the fact that transporters typically make up 5–15% of the total gene content of sequenced organisms2 to accommodate the diversity of molecules that a cell might need to acquire from the environment. ATP-binding cassette (ABC) transporter is one of the largest membrane transporter super-families that plays a vital role in the cellular functions and is universally distributed in three kingdoms of life. In Escherichia coli, the genes encoding ABC transporters occupy almost 5% of the genome with about 80 distinct transporters3 and 4% of the genome are encoded as ABC transporters in the Xanthomonas citri.4 And in human about 50 ABC transporters are present.5 ABC transporter proteins carry various substrates in and out of membrane to provide nutrients and efflux toxics for organism. Depending on the direction of transport, ABC transporter can be classified as importers or exporters. For importer, each ABC transport has three types of subunit proteins.6 For example, the E. coli maltose importer system7 (shown in Fig. 1) contains permease proteins MalF and MalG, ATP-binding protein MalK and maltose binding protein MBP. These three types of subunits form a complex, e.g. MBP–MalFGK2, to conduct the transport process. And for ABC exporter, substrate binding protein is absent.8 Three type subunit proteins have their particular structures and functions. Permease protein and ATP-binding protein are dominated by subunit of transmembrane domain (TMD) and nucleotide binding domain (NBD), respectively.9 The former offers a membrane-spanning channel for transmitting the substrates and the latter provides the energy during the transport process. For importer, additional substrate binding protein is specifically associates with the ligand in the periplasm for delivery to the appropriate permease protein.10 Mutations of these proteins have been implicated in various diseases such as immune deficiency, cystic fibrosis and progressive familial intrahepatic cholestasis-2.11 Currently, the limitation of 3D structures highlights the importance of the functional annotation for ABC transporters with bioinformatics-based methods and the classification of ABC transporters based on their specific substrates remains an important challenge in structural and functional biology.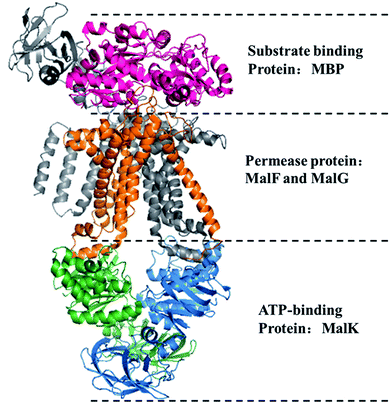 | ||
| Fig. 1 Structure of E. coli maltose importer system (PDB ID: 2R6G). Stereo view of three subunits is shown in a ribbon diagram. Color code: hot pink, MBP; grey, MalF; orange, MalG; blue and green, MalK dimer. | ||
Early studies have employed homology search and motif search to classify and predict transporters. For example, transportDB12 is a transporter database annotated through BLAST13 search. Hidden Markov Model14 and PST15 are commonly applied in motif-based methods. However these traditional similarity search-based approaches have their shortcomings, because the level of conversation within many transporter families may be very low.16 Machine learning methods sidestep lack of conversation by using various features that can truly reflect intrinsic correlation between biological samples and the target to be predicted. Several computational methods have been proposed to identify and predict membrane transport proteins, also known as transporters. A SVM machine method has been proposed by Lin et al.17 to discriminate five super-families and three families of transporters. Li et al.18 integrated traditional analysis methods into a machine learning framework and proposed an automatic transporter prediction system, TransportTP with a two-phase classification approach.19 Barghash et al.20 have functionally annotated transporters at family level and substrate level from three organisms based on sequence similarity and sequence motifs. Different features or descriptors have been used to characterize the transporters in different machine learning models such as amino acid occurrence,21 amino acid composition,22 pair amino acid composition and pseudo amino acid composition.23 Position-specific scoring matrices (PSSM) and biochemical properties have been used by Ou et al.24 and Chen et al.25 to develop network-based models for functional classification and prediction of transporters. More recently, Nitish K. et al.26 have proposed a method to achieve the goal to classify transporter into the maximum possible number of transported substrates classes by building a model based on biochemical composition and PSSM. These methods may get a good performance in overall transporters, but they have not considered family characteristic, such as ABC transporter super-family. Previous bioinformatics studies on substrate specificity of ABC transporter are focus on the prediction of substrate properties for multidrug transporters. P-Glycoprotein27,28 and breast cancer resistance protein (BCRP)29–31 have been widely studied on their specific substrate properties. These studies on transport candidates by multidrug transporters might helpful to drug screening and cancer therapy.
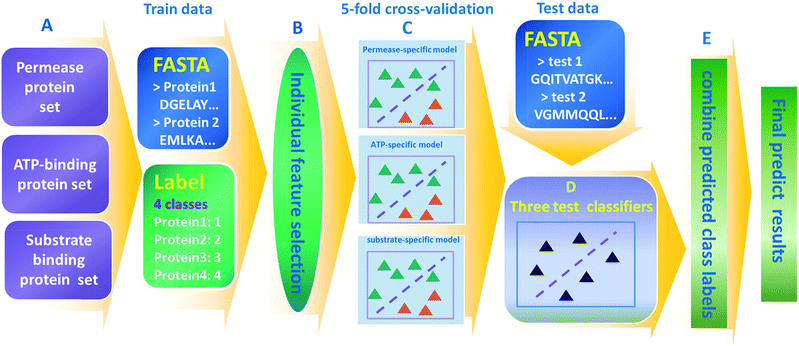
Our work aims to predict the substrate-specific classes for ABC transporters. As we know, ABC transporters have two or three subunit proteins, namely permease protein, ATP-binding protein and substrate binding protein. They have unique structures and properties, but all have significant contributions to transport process. Ashok et al.32 focused on functional genomic re-annotation of ABC transporter in G. sulfurreducens PCA using five one-dimensional tools including BLAST, family, domain, orthologous groups and signature recognition search. To best of our knowledge, there is no functional annotation of ABC transporters from protein sequence information. Moreover, ABC transporters have their own characteristic and previous researches on functional prediction of transporters only consider any one of the three types of subunits as the same one transporter protein. In this work, through comparative analysis on sequence features including amino acid composition and biochemical properties, great differences are found between three subunit protein sequences in ABC transporter system. Moreover, we have made difference analysis among four substrate-specific classes in different datasets. We found that differences are more obvious among these four classes in three subunit protein sets than that in the dataset of all proteins, which proposed us to build subunit-specific models. First step is to subunit-specific representation of ABC transporters. Through individual feature evaluation and selection for each type of subunit, the different optimal features were obtained for the three types of subunit. Then three consensus support vector machine models respond to three types of subunit were constructed to computationally predict the substrate specificity for four major classes of ABC transporters with different transport targets. Each one is a multi-classification model that can simultaneously classify sugar, ion, amino acid/protein and other transporters respectively. At last, we combined the prediction results of the three subunit-specific models to justify the substrate specificity of ABC transporters.
Our method yields a promising result with the prediction accuracy of higher than 80% for all the four substrate classes either on the cross validation test or on the independent dataset. Moreover, it performs better than uniform model which uses same descriptors to characterize all ABC transporters, indicating that it is a more reasonable way to consider three subunit proteins separately and develop individual models for them. Despite each type of subunit is individually represented, the method is still concise because the three models can consensually predict four classes of substrate at one time.
2. Materials and methods
2.1 Dataset
We originally downloaded dataset from the IUBMB-endorsed transporter classification database by Saier et al.33 and collected 1507 transporter sequence IDs of ABC transporter super-family. Then we mapped these IDs to UniProt database (release 2014_01) and deleted sequences recorded in TrEMBL database or labelled as “putative”, “probable” or “uncharacterized”. The remaining 518 ABC transporters were divided into three sets according to three types of subunit proteins including permease proteins, ATP-binding proteins and substrate binding proteins. We also removed the sequences with sequence identity higher than 70% in each subunit set using CD-hit software.34 So 259 permease proteins, 127 ATP-binding proteins and 87 substrate binding proteins were remained. At last, each subunit protein dataset was further divided into four classes based on the substrate specificity. In this work, four major classes of substrates were considered, including sugar, ion, amino acid/protein and others. According to the ratio of 4![[thin space (1/6-em)]](https://www.rsc.org/images/entities/char_2009.gif) :
:![[thin space (1/6-em)]](https://www.rsc.org/images/entities/char_2009.gif) 1, each dataset was divided into training set and independent dataset and the detailed information about the datasets is listed in Table 1. The training sets were used to construct and valid the SVM models and the independent sets were for testing the practical performance of the model. The data can be freely accessible at http://cic.scu.edu.cn/bioinformatics/ABCtrans_pred.zip.
1, each dataset was divided into training set and independent dataset and the detailed information about the datasets is listed in Table 1. The training sets were used to construct and valid the SVM models and the independent sets were for testing the practical performance of the model. The data can be freely accessible at http://cic.scu.edu.cn/bioinformatics/ABCtrans_pred.zip.
| Target class | Subunit protein set | ||
|---|---|---|---|
| Permease protein set | ATP-binding protein set | Substrate binding protein set | |
| Sugar | 22 | 14 | 14 |
| Ion | 43 | 27 | 24 |
| Amino acid/protein | 46 | 26 | 23 |
| Other | 96 | 34 | 8 |
| Total | 207 | 101 | 69 |
| Sugar | 5 | 4 | 4 |
| Ion | 11 | 7 | 6 |
| Amino acid/protein | 12 | 6 | 6 |
| Other | 24 | 9 | 2 |
| Total | 52 | 26 | 18 |
2.2 Feature extraction
Here, we tried to represent ABC transporters from protein primary sequences. Four sequence features, including AAC, CTD, PSSM and biochemical properties have been commonly considered to functionally characterize different transporters. So the four features were also extracted and fused as one feature vector to represent the substrate specificity of ABC transporters.It is defined as:
 | (1) |
Composition describes the global composition of each class in the sequence. It can be defined as:
 | (2) |
Transition represents the frequencies with which the encoded class changes along the entire length of the protein. It is defined as:
 | (3) |
Distribution (D) is calculated to measures the chain length where the first, 25%, 50%, 75% and 100% of the amino acids of a particular property are located. It is calculated as following:
 | (4) |
The seven properties associated with CTD features are hydrophobicity, normalized van der Waals volume, polarity, polarizability, charge, secondary structures and solvent accessibility. Thus, CDT feature set gives a fixed length of (3 + 3 + 15) × 7 = 147 attributes.
We used the following formula to compute each property value:
 | (5) |
 is the arithmetic sum of the ith biochemical property, and n is the length of the protein sequence.
2.3 Support vector machine (SVM)
SVM provided by Vapnik45 et al. is one of the most popular learning-machine algorithms to solve classification problems. Here, we used the commonly used software LIBSVM to construct the prediction model by downloading this tool from http://www.csie.ntu.edu.tw/%7Ecjlin/libsvm. LIBSVM is proposed by Lin et al. and is integrated software for support vector classification, regression and distribution estimation.46 Besides, it can solve multi-class classification problems efficiently based on one-against-one strategy. For an n classification problem, it constructs n × (n − 1)/2 binary classifiers and fuses them into one multi-class classifier model using a voting strategy. Each binary classification is considered to be a voting where votes can be cast for all data points and the end point is designated to be in a class with maximum number of votes. In case that two classes have identical votes, it simply selects the one with the smallest index. In this work, we selected radial basis function as kernel function to develop multi-class classification model and found best corresponding parameters C and γ by grid search.In our work, each subunit-specific set contains four classes of substrates. We used LIBSVM to construct one multi-class classifier model to simultaneously discriminate the four classes, so only three subunit-specific SVM models are needed to be constructed.
2.4 Model validation and evaluation
In statistical prediction, sub-sampling test is a good validation method to verify the stability of the model and estimate accuracy. Here, 5-fold cross-validation was used to investigate the training set. In the 5-fold cross validation, the training set is randomly partitioned into 5 equal size subsets. In every case, each of the 5 subsets is used as testing set and the remaining are used for training. The process of model training and testing is repeated 5 times and the performance of each model is computed as the average of the five runs.Four parameters including sensitivity (SE), specificity (SP), accuracy (ACC) and Mathew's correlation coefficient (MCC) were used to evaluate the prediction ability of our model. They are defined as following:
 | (6) |
 | (7) |
 | (8) |
 | (9) |
3. Results and discussion
3.1 Compositional biases among three subunit proteins
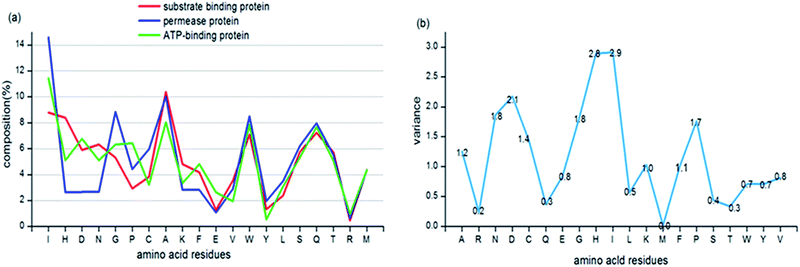
We firstly analysed the compositions of 20 standard amino acids in three subunit proteins of ABC transporters. Fig. 2(a) indicates that several amino acids, such as Ile, His, Asp and Asn express significant difference among the three subunit proteins. The variances of 20 AACs among three subunit proteins are shown in Fig. 2(b) and we can see that the mean variance has reached to 1.2. The hydrophobic amino acid, Ile presents the largest variance in permease protein, ATP-binding protein and substrate binding protein.Moreover, Fig. 2(b) shows that eight AACs give big differences with the variances lager than the mean value of 1.2. Except Ile, the other seven are His, Asp, Asn, Gly, Pro, Cys and Ala respectively. Most of these residues are hydrophobic or neutral, which may be relevant to the different biological environment and functions of the three subunit proteins.
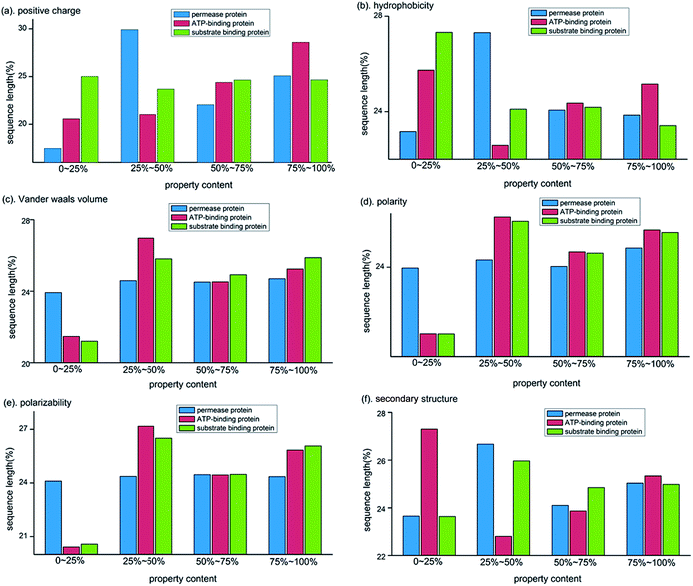
For the biochemical compositions, we also calculated the distribution of amino acid properties in the three subunit proteins and further compared these properties among them. Here six physicochemical and structural properties were selected, including positive charge (Lys, Arg), hydrophobicity (Cys, Leu, Val, Ile, Met, Phe, Trp), van der Waals volume (Gly, Ala, Ser, Thr, Pro, Asp), polarity (Pro, Ala, Thr, Gly, Ser), polarizability (Gly, Ala, Ser, Asp, Thr) and secondary structure-heilx (Glu, Ala, Leu, Met, Gln, Lys, Arg, His). We divided each property composition into four equal parts in protein sequence and computed the share of sequence length for each part. As shown in Fig. 3, obvious distribution differences among three subunit proteins are found, especially for properties of positive charge (Fig. 3(a)), hydrophobicity (Fig. 3(b)) and secondary structure (Fig. 3(c)). Moreover, for each property, the composition in both ends of protein sequence show more diversity in three subunit proteins. It suggests that two ends of the subunit protein sequences are less conservative than the middle segments.
From the above comparative analysis, we can further confirm that the three subunit proteins of ABC transporters have unique sequential properties. So it is a more reasonable way to individually represent them during the model construction, rather than describe them with the same feature vector.
3.2 Property comparisons among different transport targets
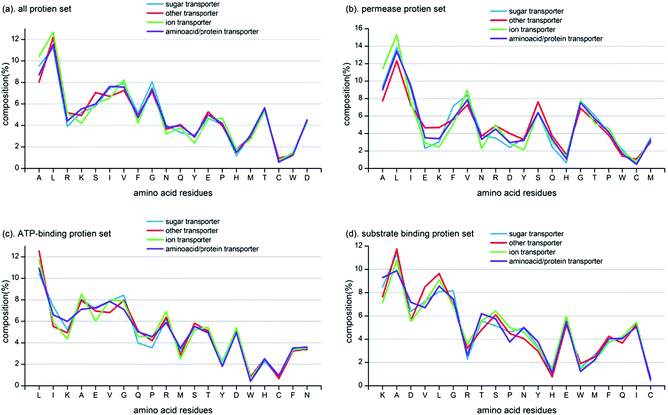
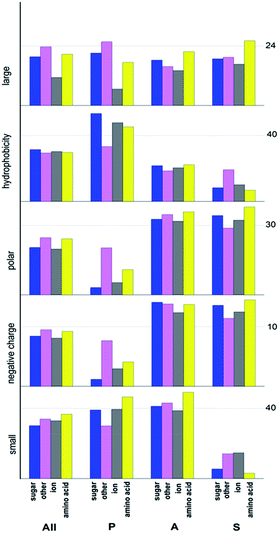
Based on the comparative analysis among three subunit proteins, we further computed the amino acid composition of ABC transporters with different transport targets on the three subunit protein sets and all protein set (put all ABC transporters together regardless of subunit proteins). The amino acid comparisons among the four classes of transport targets (substrates) in every one of the four sets are shown in Fig. 4. Almost no difference can be seen among sugar transporter, ion transporter, amino acid/protein transporter and other transporter on all protein set, but more obvious differences are found among the three subunit protein sets, especially for permease protein set and substrate binding protein set. Since ATP-binding proteins have strict conservative nucleotide binding domain47 which makes them less diverse than other two subunit proteins, and it is also the reason why we called this super-family as ABC (ATP-binding cassette) transporter. In addition, amino acid residues that have much variation across four classes on each set are different (shown in Fig. 4). For the all protein set, six most diverse amino acids among sugar transporter, ion transporter, amino acid/protein transporter and other transporter are Ala, Leu, Arg, Lys, Ser and Ile. There are six most diverse amino acids of Ala, Leu, Ile, Glu, Lys and Phe in permease protein set, of Leu, Ile, Lys, Ala, Glu and Val in ATP-binding protein set and of Lys, Ala, Asp, Val, Leu and Gly in substrate binding protein set, respectively. These diverse amino acids for each set have different characteristic and functions, and it suggests that individual consideration for each subunit protein is needed when we construct the prediction model for ABC transporters.In addition, biochemical properties of large van der Waals volume (Met, His, Lys, Phe, Arg, Tyr, Trp), hydrophobicity (Cys, Leu, Val, Ile, Met, Phe, Trp), polar (Arg, Lys, Glu, Asp, Gln, Asn), negative charge (Asp, Glu) and small van der Waals volume (Asn, Val, Glu, Gln, Ile, Leu) are also popularly used for functional annotations of proteins.
So we used them to analyse the property biases among different transport target of ABC transporters. As Fig. 5 shows, sugar transporter, ion transporter, amino acid/protein transporter and other transporter have different characteristic properties. On all protein set, composition of large van der Waals volume shows obvious difference across four transporter classes, but for other properties, variances is not significant. While, property composition among four transporter classes on the three subunit protein sets show more differences and variances are also larger than that on all protein set. This disparity can be easily seen on permease protein set and substrate binding protein set.
So the comparative analysis among different transporter targets further suggests that dividing ABC transporters into three groups according to the subunit type is good for functional classification about transport target because it gives prominence to the differences between sugar transporter, ion transporter, amino acid/protein transporter and other transporter and to their own characteristic on each subunit protein set.
3.3 The optimization of models on different feature sets
We used AAC, CTD, PSSM, AAindex and their different combinations to build a series of models to discriminate sugar, ion, amino acid/protein and other ABC transporters for each subunit protein set. The entire flowchart of our work can be seen in Fig. 6. Performances of different models on 15 feature sets using the training set and 5-cross validation test for three subunit protein sets can be seen in ESI Tables S1–S3.† For the permease-specific model construction, we can see that PSSM performs better than AAC, CTD and AAindex, and the model based on PSSM feature set is also the best one in all 15 models with an average accuracy of 89.59% and a MCC of 0.7078. Since the model based on the feature set of AAindex and PSSM gives a nearly result to the best model with an accuracy of 89.40%, but sensitivity of it (74.95%) is lower than that of the best model (76.38%). So for optimal permease-specific model was selected based on PSSM profile.For ATP-binding protein dataset, the performance of the models on different feature sets is relatively poor, which may be caused by the conservation of NBD in ATP-binding protein, as mentioned above. However, we still easily find the optimal model that is the one based on the feature set of AAindex combined with PSSM and it achieves an average accuracy of 80.36% with a MCC of 0.5050.
Similarly, PSSM feature set also performs best for substrate binding protein set with an accuracy of 86.12% and a MCC of 0.6784. So we can conclude that PSSM is a good feature in functional classification and bioinformatics annotation for ABC transporter as the previous reports have confirmed.25,26
Finally, we summed up the results of the three optimal subunit-specific models to finally annotate substrate-specific function of ABC transporters. Our method that integrates the best models of three subunit protein sets achieved an accuracy of 93.35%, 84.34%, 87.24% and 81.96%, and a MCC value of 0.7411, 0.5709, 0.6658 and 0.6324 for sugar transporter, ion transporter, amino acid/protein transporter and others respectively, using the training set and 5-fold cross validation test (shown in Table 2).
| Transporter class | Sensitivity (%) | Specificity (%) | Accuracy (%) | MCC |
|---|---|---|---|---|
| Cross validation dataset | ||||
| Sugar | 75.20 | 96.56 | 93.35 | 0.7411 |
| Ion | 65.21 | 91.23 | 84.34 | 0.5709 |
| Amino acid/protein | 76.90 | 90.90 | 87.24 | 0.6658 |
| Others | 79.77 | 84.56 | 81.96 | 0.6324 |
![[thin space (1/6-em)]](https://www.rsc.org/images/entities/char_2009.gif) |
||||
| Independent test set | ||||
| Sugar | 69.23 | 96.39 | 92.71 | 0.6789 |
| Ion | 82.86 | 88.52 | 83.33 | 0.7097 |
| Amino acid/protein | 79.17 | 84.72 | 89.58 | 0.5968 |
| Others | 66.67 | 97.22 | 86.46 | 0.7088 |
3.4 Results on the independent test dataset
We evaluated the practical performance of our models with an independent dataset of 96 ABC transporter sequences, including 13 sugar transporters, 24 ion transporters, 24 amino acid/protein transporters and 35 other transporters. The result proves that our method by considering three subunit proteins individually has yielded a good performance with an accuracy of 92.71%, 83.33%, 89.58% and 86.46% for sugar transporter, ion transporter, amino acid/protein transporter and other transporter respectively on the independent dataset. Detailed results can be seen in Table 2. Three subunit models and best features for each set are also http://cic.scu.edu.cn/bioinformatics/ABCtrans_pred.zip and results can be easily got with them using LIBSVM in MATLAB.3.5 Comparison with uniform model on the all protein set and multiple sequence alignment
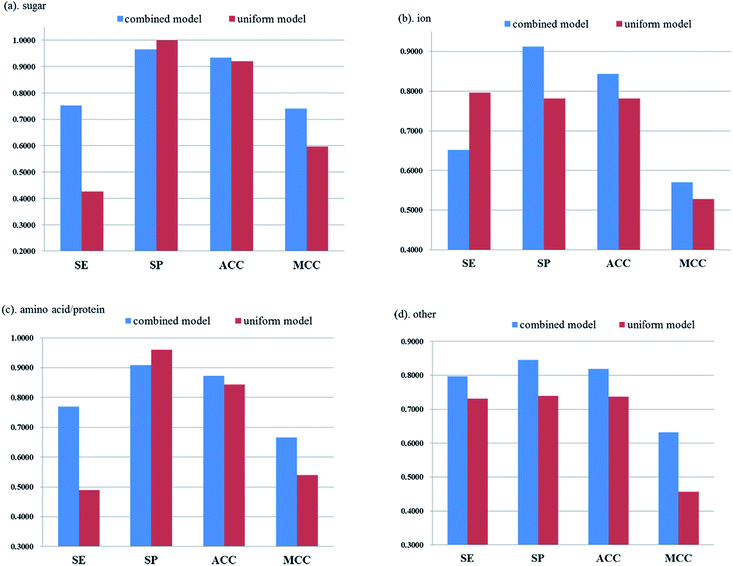
To further evaluate the superiority of our individually considered models, we used the above 15 different feature sets to develop uniform models on the all protein set. Result of each model on the training set of all proteins with 5-fold cross validation test is shown in ESI (Table S4†) and the best model is the one based on PSSM + AAindex + AAC feature set. Using the best uniform model, the detailed performance of the cross validation set and independent test set for different substrate-target ABC transporter classes is shown in Table 3. So we can make a comparison between the best uniform model on all proteins and the combined model by three individual subunit-specific models (shown in Fig. 7). It is obvious that individually considered models perform much better than uniform model in a whole especially for other transporter class. Fig. 7 demonstrates that both the accuracy and MCC values of the combined model are higher than those of the uniform model for four substrate-specific classes of ABC transporter.| Transporter class | Sensitivity (%) | Specificity (%) | Accuracy (%) | MCC |
|---|---|---|---|---|
| Cross validation dataset | ||||
| Sugar | 42.59 | 100.0 | 92.03 | 0.5961 |
| Ion | 79.61 | 78.17 | 78.22 | 0.5283 |
| Amino acid/protein | 49.00 | 96.00 | 84.36 | 0.5405 |
| Others | 73.09 | 73.96 | 73.74 | 0.4572 |
![[thin space (1/6-em)]](https://www.rsc.org/images/entities/char_2009.gif) |
||||
| Independent test set | ||||
| Sugar | 38.46 | 98.80 | 90.63 | 0.5266 |
| Ion | 75.00 | 81.94 | 80.21 | 0.5273 |
| Amino acid/protein | 58.33 | 97.22 | 87.50 | 0.6455 |
| Others | 82.86 | 77.05 | 79.17 | 0.5798 |
By comparison between the results listed in Tables 2 and 3, although individually considered model show a slightly lower sensitivity than uniform model for ion transporter, it has improved sensitivity for sugar transporter, amino acid/protein transporter and other transporter by 32.61%, 27.9% and 6.68% on cross validation test, respectively. And same results can be seen in independent test set. Individually considered model has achieved higher accuracy for all four classes and much higher sensitivity can be seen especially for sugar, ion and amino acid/protein transporters. By comparing the individually considered model with the uniform model, we can further believe that individual representation and model construction for each type of subunit proteins is a more reasonable way in predicting the substrate specificity of ABC transporters.
In addition, multi-sequence alignment methods are simple and effective for classification research. These methods have shown good performance,20 while they may obtain failed results when the query protein has very low identity within other known members. ABC transporters have some family resemblance especially for conserved NBD. Therefore it is probable to predict substrate-specificity of transporter using multi-sequence alignment methods such as BLAST. To make a comparison between our method and the multi-sequence alignment methods on ABC transporter system, we used BLAST to predict our test dataset.
Considering alignment within the family and some ABC transporters have conserved NBD as mentioned above, we ran BLAST with E-value of 1 × 10⁻²⁰ to match transporters in test data set and 76 of 96 transporters are matched. It got an average accuracy of 75% (57/76) which is lower than ours (80%) and more than 20% transporters cannot be matched. The results are list in ESI Table S5.† When the similarity threshold was set higher permissively, more matching numbers were got but false predictions also increased. And likewise, with higher E-value, the accuracy increased with more unclassified members. Previous works20 have got the same conclusions. In all, our method has its own advantages and shows better performance compared to simple multiple sequence alignment.
3.6 Component and biological function of other transporters class
Substrates transported by the other class transporters have a wide variety such as lipids, drugs, haemins and other biological macromolecules which are very important for life. While numbers of transporters for each substrate are so limited that we cannot build the valid statistical models and make predictions individually for them. Here we give an analysis of the component and biological function of other transporter class particularly. Lipids are fundamental to life and probably, apart from amino acids and possibly ribose.48 Our present dataset includes 5 ABC lipid transporters which are all divided into training set randomly during model building. We make statistics of prediction results for these 5 transporters and find that our model can correctly predict 4 of them. Another important component is drug transporter, most of they are associated with distribution and concentration of drug in the organism especially for the multidrug resistance transporters that can reduce effective drug concentration during the cancer therapy. Works on predicting substrates of these multidrug transporters can be seen in ref. 27–31. Our present dataset contains 12 multidrug transporters, they all have been correctly predicted in cross validation test. It suggests that our descriptions can effectively distinguish multidrug transporters from sugar, ion and amino acid/protein transporters. So we can expect that if more members of one specific class will be discovered in the future, our method would be used specially for these new transporters and be tested in a wider range.4. Conclusions
In this work, our study focused on the functional classification of ABC transporter family based on substrate-specificity. We take account of family properties for ABC transporters rather than considering them just as common transporters like previous studies. Since ABC transporters have two or three subunit proteins with unique structures and properties, we analysed the differences among three type subunit proteins of ABC transporters and divided all ABC transporters into three protein sets responding to three subunit proteins. And individual representation and model construction was implemented for each type of subunit proteins. Then we developed three multi-classification models for sugar transporter, ion transporter, amino acid/protein transporter and other transporter on each subunit protein set. Finally, we summed up all results of three subunit-specific models to make systematic functional classification of ABC transporters. This procedure yields three multi-class classification models which are assigned according to the greatest preferences for three subunit protein sets (Fig. 6). Our method has achieved accuracy in range of 81–93% on training set of 377 ABC transporters. Compared with uniform models on all proteins, it has improved sensitivity for sugar transporter, amino acid/protein transporter and other transporter by 32.61%, 27.9% and 6.68% on training set, respectively. Our method also performed well on the independent test dataset with the accuracy of 92.71%, 83.33%, 89.58% and 86.46% for sugar transporter, ion transporter, amino acid/protein transporter and other transporter respectively. These results suggest that considering three subunit proteins separately highlights the difference between ABC transporter classes and developing individual models for three substrate protein groups is a recommendable and effective way for functional annotation of ABC transporters.Acknowledgements
This work was funded by the National Natural Science Foundation of China (no. 21175095, 21273154, 21375090).References
- W. Busch and M. H. Saier, Crit. Rev. Biochem. Mol. Biol., 2002, 37, 287–337 CrossRef CAS PubMed.
- T. J. Lee, I. Paulsen and P. Karp, Bioinformatics, 2008, 24, 259–267 CrossRef PubMed.
- K. J. Linton and C. F. Higgins, Mol. Microbiol., 1998, 28, 5–13 CrossRef CAS.
- F. J. Medrano, C. S. de Souza and A. Romero, Acta Crystallogr., Sect. F: Struct. Biol. Commun., 2014, 70, 564–571 CAS.
- M. Dean, Y. Hamon and G. Chimini, J. Lipid Res., 2001, 42, 1007–1017 CAS.
- K. Tomii and M. Kanehisa, Genome Res., 1998, 8, 1048–1059 CAS.
- M. L. Oldham, D. Khare and F. A. Quiocho, Nature, 2007, 450, 515–521 CrossRef CAS PubMed.
- R. J. Dawson, K. Hollenstein and K. P. Locher, Mol. Microbiol., 2007, 65, 250–257 CrossRef CAS PubMed.
- D. C. Rees, E. Johnson and O. Lewinson, Nat. Rev. Mol. Cell Biol., 2009, 10, 218–227 CrossRef CAS PubMed.
- G. F. Ames, Annu. Rev. Biochem., 1986, 55, 397–425 CrossRef CAS PubMed.
- F. Klepsch, P. Vasanthanathan and G. F. Ecker, J. Chem. Inf. Model., 2014, 54, 218–229 CrossRef CAS PubMed.
- Q. Ren, K. H. Kang and I. T. Paulsen, Nucleic Acids Res., 2004, 32, D284–D288 CrossRef CAS PubMed.
- S. F. Altschul, W. Gish and W. Miller, J. Mol. Biol., 1990, 215, 403–410 CrossRef CAS.
- A. Krogh, M. Brown and I. S. Mian, J. Mol. Biol., 1994, 235, 1501–1531 CrossRef CAS PubMed.
- E. Eskin, W. S. Noble and Y. Singer, J. Comput. Biol., 2003, 10, 187–213 CrossRef CAS PubMed.
- B. Heil, J. Ludwig and H. Lichtenberg-Fraté, Bioinformatics, 2006, 22, 1562–1568 CrossRef CAS PubMed.
- H. H. Lin, L. Y. Han and C. Z. Cai, Proteins: Struct., Funct., Bioinf., 2006, 62, 218–231 CrossRef CAS PubMed.
- H. Li, X. Dai and X. Zhao, Bioinformatics, 2008, 24, 1129–1136 CrossRef CAS PubMed.
- H. Li, V. A. Benedito and M. K. Udvardi, BMC Bioinf., 2009, 10, 418 CrossRef PubMed.
- A. Barghash and V. Helms, BMC Bioinf., 2013, 14, 343 CrossRef PubMed.
- M. M. Gromiha and Y. Yabuki, BMC Bioinf., 2008, 9, 135 CrossRef PubMed.
- N. S. Schaadt and V. Helms, Biopolymers, 2012, 97, 558–567 CrossRef CAS PubMed.
- N. S. Schaadt, J. Christoph and V. Helms, J. Chem. Inf. Model., 2010, 50, 1899–1905 CrossRef CAS PubMed.
- Y. Y. Ou, S. A. Chen and M. M. Gromiha, Proteins: Struct., Funct., Bioinf., 2010, 78, 1789–1797 CAS.
- S. A. Chen, Y. Y. Ou and T. Y. Lee, Bioinformatics, 2011, 27, 2062–2067 CrossRef CAS PubMed.
- N. K. Mishra, J. Chang and P. X. Zhao, PLoS One, 2014, 9, e100278 Search PubMed.
- L. Zhong, C. Y. Ma and H. Zhang, Comput. Biol. Med., 2011, 41, 1006–1013 CrossRef CAS PubMed.
- E. Hazai, I. Hazai and I. Ragueneau-Majlessi, BMC Bioinf., 2013, 14, 130 CrossRef PubMed.
- Z. Wang, Y. Chen and H. Liang, J. Chem. Inf. Model., 2011, 51, 1447–1456 CrossRef CAS PubMed.
- J. Huang, G. Ma and I. Muhammad, J. Chem. Inf. Model., 2007, 47, 1638–1647 CrossRef CAS PubMed.
- Z. Bikadi, I. Hazai and D. Malik, PLoS One, 2011, 6, e25815 CAS.
- A. Selvaraj, V. Sumantran and N. Chowdhary, Curr. Bioinf., 2014, 9, 166–172 CrossRef CAS.
- M. H. Saier, V. S. Reddy and D. G. Tamang, Nucleic Acids Res., 2014, 42, D251–D258 CrossRef CAS PubMed.
- W. Li and A. Godzik, Bioinformatics, 2006, 22, 1658–1659 CrossRef CAS PubMed.
- C. Z. Cai, L. Y. Han and Z. L. Ji, Nucleic Acids Res., 2003, 31, 3692–3697 CrossRef CAS PubMed.
- H. H. Lin, L. Y. Han and C. Z. Cai, Proteins: Struct., Funct., Bioinf., 2006, 62, 218–231 CrossRef CAS PubMed.
- B. A. Van den Berg, M. J. Reinders and J. A. Roubos, BMC Bioinf., 2014, 15, 93 CrossRef PubMed.
- H. B. Rao, F. Zhu and G. B. Yang, Nucleic Acids Res., 2011, 39, W385–W390 CrossRef CAS PubMed.
- S. Ding, S. Yan and S. Qi, J. Theor. Biol., 2014, 353, 19–23 CrossRef CAS PubMed.
- L. Zou, C. Nan and F. Hu, Bioinformatics, 2013, 29, 3135–3142 CrossRef CAS PubMed.
- C. Fang, T. Noguchi and D. Tominaga, BMC Bioinf., 2013, 14, 300 CrossRef PubMed.
- M. M. Gromiha and S. Selvaraj, Biophys. Chem., 1999, 77, 49–68 CrossRef CAS.
- M. M. Gromiha, A. M. Thangakani and S. Selvaraj, Nucleic Acids Res., 2006, 34, W70–W74 CrossRef CAS PubMed.
- M. M. Gromiha, S. Selvaraj and A. M. Thangakani, J. Chem. Inf. Model., 2006, 46, 1503–1508 CrossRef CAS PubMed.
- V. Vapnik, Statistical learning theory, Wiley, New York, 1998 Search PubMed.
- C. C. Chang and C. J. Lin, ACM Transactions on Intelligent Systems and Technology, 2011, 2, 27 CrossRef.
- K. Hollenstein, D. C. Frei and K. P. Locher, Nature, 2007, 446, 213–216 CrossRef CAS PubMed.
- R. P. Bywater and K. Conde-Frieboes, Astrobiology, 2005, 5, 568–574 CrossRef CAS PubMed.
Footnote |
| † Electronic supplementary information (ESI) available. See DOI: 10.1039/c5ra05304h |
| This journal is © The Royal Society of Chemistry 2015 |

