
Fabrication and design of a toxic gas sensor based on polyaniline/titanium dioxide nanocomposite film by layer-by-layer self-assembly
Shaoqing Cuiab,
Jun Wang*a and
Xinlei Wang*b
aDepartment of Biosystems Engineering and Food Science, Zhejiang University, 866 Yuhangtang Road, Hangzhou 310058, PR China. E-mail: jwang@zju.edu.cn; Fax: +86-571-88982191; Tel: +86-571-88982178
bDepartment of Agriculture and Biological Engineering, University of Illinois at Urbana-Champaign, 332 AESB, MC-644, 1304 W Pennsylvania Avenue, Urbana, IL 61801, USA
First published on 12th June 2015
Abstract
A sensitive polyaniline (PANI)/titanium dioxide (TiO2) based toxic gas sensor deposited on a quartz crystal microbalance (QCM) chip was fabricated and developed through electrostatic layer-by-layer (LbL) self-assembly (SA) with polyaniline and titanium dioxide sol as original materials. The synthesis process and the obtained nanocomposite were confirmed through a home-made measurement set-up, field-emission scanning electron microscopy (FE-SEM), transmission electron microscopy (TEM), Fourier transform infrared spectroscopic (FTIR) and X-ray diffraction (XRD), which demonstrates that a thin PANI/TiO2 nanocomposite sensing film was successfully achieved by LbL self-assembly. The sensor response was found to be greatly influenced by the number of deposited layers. The resulting PANI/TiO2 based gas sensor exhibited good sensitivity and smooth shift in terms of responses based on frequency data compared to responses based on resistance data. It exhibited high sensitivity toward 10 ppm of three different toxic gases (ammonia, hydrogen sulfide and trimethylamine) with an evident frequency shift and a fast response and recovery time. The sensor showed excellent reversibility and long-term stability as well as good selectivity towards NH3. In real-time application, the obtained PANI/TiO2 based gas sensor exhibited excellent performance and accurate evaluation of three typical foodstuffs. The PANI/TiO2 nanocomposite based gas sensor coated on QCM substrate via LbL self-assembly provides a promising efficient sensor to detect toxic gases in relatively low concentrations.
Introduction
With the wide and extensive use of gas sensors in food quality monitoring, environmental protection, health care, industrial production, and the safety of society,1–4 characteristics such as high sensitivity, good reversibility, excellent reproducibility, and long stability of gas sensors are strongly required. Therefore, developing novel and efficient sensitive materials has been greatly promoted. Among various known materials, semiconducting polymers such as polyaniline, polypyrrole, and polythiophene have attracted great interest because of their prominent advantages of low cost, flexible modification, facile synthesis, and friendly operating conditions.5–7 PANI is one of the most popular semiconducting polymers and has been extensively investigated because of its additional unique doping chemistry and high conductivity. Researchers have reported that the electric conductivity changes of polyaniline after solidification and during the melting transition, when changing the concentrations of the mixed conducting polymer.8 Previous literature has intensively investigated the mechanisms, structural aspects, physicochemical characteristics and the applications of polyaniline.9,10 However, its fabrication and applications are relatively limited because of its low processability, poor mechanical strength, and environmental instability.To address the problems, inorganic metal oxides such as ZnO2, WO3, and TiO2 are introduced through the synthesis with the organic polymer. According to previous studies from Mohammad et al. and An et al., this heterogeneous organic–inorganic material exhibited good properties and unique electrical, catalytic, optical, and sensing properties allowing for optimized and expanded applications.11,12 The improvement is attributed to structural modifications and an extended surface area as well as physical or chemical interaction. Among many metal oxide nanoparticles, TiO2 has been reported to be an excellent partner for PANI. Su et al. found that different PANI/TiO2 mixture ratios have significant influence on the conductivity of the composite.13 Karim et al. revealed that different crystal forms of TiO2 and oxide forms of PANI significantly affect the composite characteristics.14,15 For the synthesis of PANI/TiO2 nanocomposites, several methods such as chemical oxidative polymerization of aniline in the presence of TiO2,13 electrochemical polymerization of aniline, polymerization of aniline using reverse micelles, ultrasonic, sol–gel methods, and physical mixing have been employed.16–18 However, most of these studies are focused on the preparation of PANI nanostructures via in situ polymerization in the presence of TiO2 nanoparticles; only limited studies are focused on the layer-by-layer (LbL) synthesis approach.19,20 Compared with conventional in situ polymerization, LbL self-assembly exhibits attractive advantages of fabricating ultrathin films; saving energy, facile operation, and improved versatility. More importantly, the synthesis process and the thickness of sensitive film can be easily visible and controlled, which are critical for promoting sensor properties. However, disadvantages still exist. The limited studies mostly measured the resistance parameter based on silicon substrates. However, the resistance value is usually tremendously high with some noise signal because TiO2 nanoparticles are insulated, thereby leading to difficulties in measurement, reduced sensitivity, and complex data processing. In addition, noise is also introduced by incomplete electron attachment, inconsistent film thickness, and circuit resistance. To overcome these problems, studies have focused on the use of innovative materials such as piezoelectric materials.
In this research, a toxic gas-sensitive film was deposited on quartz crystal microbalance (QCM), which was developed as a highly sensitive mass sensor based on the piezoelectric properties of quartz crystal. The primary principle of QCM sensors is based on the physical or chemical interaction between the sensitive film and the target gas, resulting in mass change (Δm), which is in the function of the resonant frequency change (Δf) of the QCM crystal. Their relationship (Δm and Δf) could be illustrated and demonstrated by the Sauerbrey equation, which shows that a mass change on the nanoscale can cause an observed frequency shift, indicating extremely high sensitivity.21 Moreover, given that different sensitive films correspond to different target gases, specific gas sensors can be designed by coating special films on the surface to realize satisfactory selectivity and flexible processability. This is possible because the p/n junction is considered to be generated between an adjacent layer to the PANI and TiO2 layers, which enhances the conductivity of the prepared polymer. When exposed to different toxic gases, the absorption ability and the number of exchanged electrons are likely different, leading to different frequency shifts which therefore improve the conductivity and selectivity of the fabricated sensitive film. In addition, sensor behaviors based on frequency measurements perform much better than those based on chemical resistance because of high sensitivity, high signal-to-noise ratio, good reversibility, and easy operation. Therefore, the QCM sensor has been widely used in biomedical engineering, biochemical analysis, analytical science, and industry monitoring.22–24 However, few studies have investigated the nanocomposite sensitive film of PANI/TiO2 by depositing it on QCM by LbL and then examining its properties for real-life applications, e.g. shelf-life evaluation of easily rotten foodstuffs.
In this work, with QCM as the substrate and as-prepared PANI and TiO2 colloid as the starting materials. An ultrathin nanocomposite of PANI/TiO2 was fabricated and its corresponding gas sensor was deposited on QCM via a facile electrostatic LbL self-assembled approach. The process and the resulting sensitive film were fully characterized via home-made examination, field-emission scanning electron microscopy (FE-SEM), transmission electron microscopy (TEM), and X-ray diffraction (XRD) analysis. Sensor performance based on frequency and resistance data were accordingly compared and analyzed before further examination. The sensitivity, reversibility, and stability of the obtained QCM gas sensor in a corresponding E-nose system were examined with three pure targeted gases by observing dynamic responses. The corresponding home-made measurement device based on the QCM gas sensor was examined by detecting toxic VOCs, involved in NH3, H2S and trimethylamine (TMA), which were emitted from three typical types of foodstuff during one week of storage.
Experimental
Reagents and chemicals
Aniline was purchased from Alfa Aesar and distilled at reduced pressure. Ammonium persulfate (APS) was purchased from Wulian Chem. Co. Titanium(IV) isopropoxide and poly styrenesulfonic acid (PSSA, MW: 75![[thin space (1/6-em)]](https://www.rsc.org/images/entities/char_2009.gif) 000, 30 wt% in water) was purchased from Alfa Aesar. Hydrogen peroxide (30% wt), concentrated sulfuric acid (98% wt), concentrated nitric acid, and polydiallyldimethyl ammonium chloride (PDDA, MW; 200000–350000, 20 wt% water solution) were purchased from Sigma-Aldrich Co.
000, 30 wt% in water) was purchased from Alfa Aesar. Hydrogen peroxide (30% wt), concentrated sulfuric acid (98% wt), concentrated nitric acid, and polydiallyldimethyl ammonium chloride (PDDA, MW; 200000–350000, 20 wt% water solution) were purchased from Sigma-Aldrich Co.
Preparation of polyaniline and titanium dioxide
PANI was synthesized via solution polymerization of aniline with APS as oxidant and PSSA as soft template. The resulting PANI was considered as PANI–PSSA in this research. Accord to previous literature,19 the molar ratios of aniline/APS/PSSA was set at 1/1/1.19,25 Commonly, water vapor is a typical interfering gas in gas monitoring, and it should be thoroughly avoided when designing gas sensors. PANI–PSSA exhibited good conductivity and good solubility in water.TiO2 sol was synthesized via peptization of precipitation from titanium(IV) isopropoxide in the presence of nitric acid.26 The molar ratio of titanium isopropoxide to deionized water was controlled at 1/200. The specific procedure was as follows: 15 mL of titanium isopropoxide was dropwise added into 185 mL of deionized water with vigorous stirring at room temperature. A white suspension was immediately observed. Afterwards, 1.3 mL of concentrated HNO3 was added, and the suspension was transferred to an open flask and heated at 85 °C with stirring for 8–12 h. A semi-transparent light blue TiO2 sol was then obtained.
Fabrication of QCM sensor deposited by PANI–PSSA/TiO2
The designed QCM gas sensor coated with PANI–PSSA/TiO2 was fabricated via an electrostatic LbL self-assembled method. The specific procedure was as follows: a prepared QCM sensor was treated with piranha solution (30% H2O2:98% H2SO4 = 1:3, v/v) for 30 min to increase the concentration of hydroxyl and carboxyl groups on the gold surface of the QCM sensor. The treated sensors were decorated with three bilayers of PDDA and PSS (PDDA/PSS)3 by alternately immersing into 2 wt% of PDDA solution and 2 wt% of PSS solution three times. After each immersion, the electrode was rinsed with deionized water and dried with dry N2. The bilayers of TiO2 and PANI–PSSA were self-assembled on the gold electrode of the QCM decorated with (PSS/PDDA)3 LbL. The decorated electrode was alternately immersed in 1 mg mL−1 of TiO2 sol (pH = 1.5, adjusted by HCl, positive charge) and PANI–PSSA solution (pH = 1.5, negative charge) for 10 min. After each immersion, the electrode was rinsed with HCl solution (pH = 1.5) for 60 s and then dried with N2. The electrode covered with the desired number of bilayer of PANI–PSSA/TiO2 was further deposited with a layer of PANI–PSSA by dip coating in PANI–PSSA solution (1 mg mL−1) without rinsing.19 Finally, the fabricated gas sensor was obtained.
Characterization of the QCM gas sensor
The general morphologies of PANI–PSSA, TiO2, and LbL self-assembled ultrathin films were observed via FE-SEM (Hitachi S4800, 3 kV accelerating voltage) and TEM (JEOL Jem-1230, 60 kV accelerating voltage). Crystallinity and crystal phase analysis were carried out via XRD (PAN analytical X’Pert PRO, Cu Kα radiation λ = 1.5418 A) in the range of 2θ of 5–80°. The Fourier transform infrared (FTIR) spectra of PANI–PSSA/TiO2 were obtained in the range of 4000 cm−1 to 400 cm−1 by using a Bruker Vector 22 infrared spectrometer (cast from N,N-dimethyl formamide solution). The LbL self-assembled growth of PANI/TiO2 bilayers was monitored via QCM analysis (QCM, Biolin ZCEC-100768F, 8 MHz QCM gold electrode).Measurement of the QCM sensor in E-nose system
The gas-sensing detection of the QCM sensor coated with PANI–PSSA/TiO2 was conducted using a home-made gas-sensing system that includes a gas configuration part and sensor response examination set, as shown in Fig. 1. | ||
| Fig. 1 Schematic diagram of QCM gas sensor measurement system. | ||
In the gas configuration part, four mass flow controllers (MFC) with their corresponding valves were employed to accurately control the gases at different concentrations. Before arriving in the gas sensing chamber, the target gas and resin gas were mixed first in a gas mixing chamber firstly, which is at a constant pressure and humidity to avoid interference from humidity and non-uniform pressure. The last MFC and valve were designed to ensure that only the specific concentration of gas or dried gas can flow, that is, the given tested gas or resin gas was alternatively injected into the gas sensing chamber.
The sensor response examination set was designed to measure sensor response, record data, and display a response curve. It consists of three units, as illustrated in Fig. 1. The QCM sensors (test and reference sensor) and the corresponding driver oscillator circuits were fixed in the sealed gas sensing chamber at room temperature. The power supply, frequency counter circuit, signal conditioning circuit, and data acquisition card (DAQ 6602 card) constitute the signal processing unit and cooperate to calculate frequency, filter noise signal, and communicate with a computer. The resonant frequency of QCM was measured in this set. By comparison, the impedance change of the PANI/TiO2 based gas sensors was also recorded by Quartz Crystal Analyzer QCA922 (Princeton Applied Research, Oak Ridge, TN, U.S.A). The virtual instrumental software was used as the “brain” in recording, reading, displaying, and analyzing data using different pattern recognition technologies. In this experiment, three different test gases, namely, NH3, H2S, and trimethylamine (TMA), were examined separately from a concentration range of 10 ppm to 250 ppm by recording their sensor response of Δf and ΔR.
Results and discussion
Characterization of the PANI–PSSA/TiO2 nanocomposite
The general morphology of a sensor composite significantly affects the sensor properties.27,28 Specifically, excellent sensitivity and good reversibility of PANI/TiO2 based sensors mainly depend on its homogeneous dispersion, proper doping state, and good adhesion and long-term stability, therefore, their physical and chemical properties were intensively considered during the preparation and synthesis. The process and the resulting film were fully characterized via QCM measurement set, field-emission scanning electron microscopy (FE-SEM), transmission electron microscopy (TEM), and X-ray diffraction (XRD) analysis.The morphologies of the monolayer of PANI and TiO2 deposited on a QCM chip were observed via SEM. For PANI deposition, the QCM chip was first treated with piranha solution and then coated with three bilayers of self-assembled PDDA/PSSA. A layer of PDDA with a positive charge was deposited on the chip before the target PANI layer, which has a negative charge. Similarly, for the TiO2 monolayer, a layer of PSSA with a negative charge was deposited on the chip before the TiO2 layer was coated on, given that TiO2 particles have a positive charge in acid solution. The SEM micrographs are shown in Fig. 2(a) and (b), and clearly reveal that both PANI–PSSA and TiO2 nanoparticles adhered well on the QCM chip. More importantly, they were uniformly distributed, thereby suggesting a successful deposition process on the treated QCM substrate.
 | ||
| Fig. 2 SEM images of TiO2 nanoparticles (a) and PANI nanoparticles (b); TEM image of TiO2 nanoparticles (c) and PANI nanoparticles (d). | ||
The TEM micrographs show the general dispersion and average particle diameter of PANI–PSSA and TiO2 nanoparticles. As shown in Fig. 2(c), TiO2 nanoparticles, dispersed uniformly stayed stable with a diameter ranging from several nanometers to tens of nanometers. Fig. 2(b) is the SEM image of PANI particles, it is observed that PANI particles were also dispersed well in deionized water with a diameter at several nanometers. Clearly, both TiO2 and PANI had a constant diameter range, indicating a relatively uniform particle size. Moreover, after storing for three months at ambient temperature, both solutions remained stable with no agglomeration. As shown in Fig. 3 inset image, the PANI–PSSA solution was dark green (left), which might be ascribed to the emeraldine salt of PANI (dark green) doped by PSSA, whereas the TiO2 solution was a translucent light blue (right). The SEM and TEM images clearly indicate that both the prepared PANI and TiO2 monolayers give excellent uniform films, good adhesion on gold electrodes and allow improved properties for a successfully self-assembled process. Additionally, their excellent spherical geometry allows for potential improvement on the resulting films, such as an enlarged specific surface area and porous frame, which probably results in gas diffusion occurring more easily.
 | ||
| Fig. 3 XRD patterns of PANI and TiO2 nanoparticles. | ||
To verify whether emeraldine salt was completely synthesized, the XRD patterns of nanostructured PANI–PSSA was observed. As shown in Fig. 3, PANI exhibited a broad peak at 21 °C to 25 °C, which is ascribed to the typical crystalline form of emeraldine salt and was disorderly scattered.29 The TiO2 nanoparticles presented a typical conspicuous diffraction peak, demonstrating that the nanoparticles were well crystallized in the anatase phase and the amorphous form. The resulting properties of the fabricated PANI–PSSA and colloid TiO2 materials were proven to be suitable for LbL self-assembly.
To compare and characterize the obtained composite and initial materials, the FTIR spectra were investigated and used to confirm the presence of the emeraldine salt form of PANI in neat PANI and PANI/TiO2. As shown in Fig. 4, PANI emeraldine salt bands can be observed at 1569 [quinonoid ring stretching], 1490 [benzenoid ring stretching], 1243 [the C–N+ stretching in polaron form], and 1146 cm−1 [the stretching vibration of –NH+![[double bond, length as m-dash]](https://www.rsc.org/images/entities/char_e001.gif) in the B–NH+Q segment in the bipolaron form of the PANI emeraldine salt]; the C–H out-of-plane bending vibration was at 821 cm−1. At higher wavenumbers, 2854 cm−1 corresponded to the C–H stretching of aromatic amines, whereas 3225–3451 cm−1 was related to the N–H stretching of aromatic amines. The spectra of neat PANI seems to be similar to that of the PANI/TiO2 composites, which indicates that the properties of PANI in the PANI/TiO2 composites are more significant than that of TiO2. However, they were shown to be different with some peaks weakening and some slightly shifting. For instance, the bands at 1041 cm−1, 618 cm−1 and 588 cm−1 corresponded to shortened hydrogen sulfate counter ions while the band at 3453 cm−1 was slightly shifted. This could possibly be attributed to the action of hydrogen bonding between the surfaces of colloidal TiO2 nanoparticles and the N–H groups in the PANI particles.30 In other words, these observed changes indicated an interfacial interaction occurring between the PANI layer and the inorganic TiO2 layer.
in the B–NH+Q segment in the bipolaron form of the PANI emeraldine salt]; the C–H out-of-plane bending vibration was at 821 cm−1. At higher wavenumbers, 2854 cm−1 corresponded to the C–H stretching of aromatic amines, whereas 3225–3451 cm−1 was related to the N–H stretching of aromatic amines. The spectra of neat PANI seems to be similar to that of the PANI/TiO2 composites, which indicates that the properties of PANI in the PANI/TiO2 composites are more significant than that of TiO2. However, they were shown to be different with some peaks weakening and some slightly shifting. For instance, the bands at 1041 cm−1, 618 cm−1 and 588 cm−1 corresponded to shortened hydrogen sulfate counter ions while the band at 3453 cm−1 was slightly shifted. This could possibly be attributed to the action of hydrogen bonding between the surfaces of colloidal TiO2 nanoparticles and the N–H groups in the PANI particles.30 In other words, these observed changes indicated an interfacial interaction occurring between the PANI layer and the inorganic TiO2 layer.
 | ||
| Fig. 4 FTIR spectra of PANI and PANI/TiO2 composite. | ||
According to previous literature, the thickness of the composite film significantly influences sensor performance;19 thus, the sensor response (frequency shift) as a function of different numbers of assembled bilayers was investigated. Fig. 5 shows that the frequency (Δf) increased with increasing NH3 concentration (from 10 ppm to 250 ppm) for all deposited bilayers at different numbers, thereby indicating that sensor sensitivity significantly depended on the bilayer number. The composite with five bilayers exhibited a nonlinear increase with NH3 concentrations, probably due to saturated absorption by the high content of NH3. By comparison, the composite with 10 bilayers showed good performance not only over 100–250 ppm but also at low concentrations from 10 ppm to 100 ppm. The composite with 15 or more bilayers showed less linear trend and lower sensitivity than that with 10 bilayers. It is supposed that the decrease in sensitivity was associated with the difficulty in gas diffusion caused by the increase in sensing film thickness. Conclusively, the nanocomposite with 10 assembled bilayers exhibited the highest sensitivity to low concentrations and the most excellent linear variance with increasing NH3 concentration. Therefore, it was selected as the most suitable number of bilayers in this study. The progress of self-assembly (10 bilayers) was also monitored by measuring the frequency shift in QCM, as shown in inset plot of Fig. 5. Apparently, the frequency changed linearly with increasing bilayer, thereby indicating the successful self-assembly of PANI and TiO2 particles on the QCM chip via electrostatic interaction.
 | ||
| Fig. 5 Effect of self-assembled number on the NH3 sensitivity of the gas sensors. | ||
Comparison of sensor response based on frequency and resistance signal
The sensor performance was examined with different NH3 concentrations using a home-made measurement device. As shown in Fig. 6, the designed strategy consists of three parts: a sensitivity test (labeled A), a fast response test without flush nitrogen (labeled B), and a repeatability test (labeled C). In this test system, both frequency and impedance change were measured and recorded simultaneously in the same conditions. Obviously, in Fig. 6, the frequency signal shows higher sensitivity toward NH3 and behaves much more smoothly than the resistance signal. By contrast, the resistance showed lots of noise peaks over the whole detection range. Specifically, in the sensitivity test (stage A), the frequency signal exhibits noticeable magnitude variation ranging from 25 Hz to 75 Hz, which corresponded to low concentrations from 10 ppm to 50 ppm. However, the magnitude change in the resistance was less significant with only 10 ohm (Ω) to 30 ohm (Ω) variance, thereby revealing that the frequency signal has a higher resolution than the resistance signal. In the fast response test (stage B), the frequency signal presents obvious jumps between different concentrations; however, the impedance signal only showed continuous decrease without clear change, probably due to the significant noise signal which covers the effective signal. In the repeatability evaluation (stage C) in the cycle tests, the frequency showed better and clearer performance than the resistance, indicating a satisfactory reproducibility. Therefore, in the successive study, frequency data was employed as the gas sensor response. | ||
| Fig. 6 Comparison of frequency and resistance signal of NH3 detection. | ||
Two reasons might be attributed to the unexpected sensor behaviors where the impedance data showed poor performance. First, the resulting composite films are ultrathin, leading to no equivalent resistance change when compared with the frequency shift. However, the thin film meets the requirement of Sauerbrey’s equation, allowing frequency changes, which leads to high sensitivity and good reversibility. Another explanation for the poor reversibility and huge noise signal is attributed to the chemical reaction between NH3 and the doping acid, therefore leading to the compensation electrical neutralization of the PANI/TiO2 chains33,34. At stage B, an interaction of ammonia with the APS-doped nanocomposite was proposed, but the irreversible interaction was inhibited because of the lack of N2 flushing, thereby leading to the continuous decrease in resistance without any jumps, despite being exposed to different concentrations.
Gas sensing properties of PANI/TiO2 nanocomposite
NH3 is widely used as an industrial coolant and explosive gas, however, it is pungent and hazardous. Even at few tens of ppm concentration, it can be detected by human beings and could damage human olfactory system at above 25 ppm. Thereby, reliable sensor sensitivity towards lower concentrations is greatly required. Fig. 7(a) shows the typical dynamic sensor performance of the prepared PANI/TiO2 gas sensor toward NH3. It is obvious that NH3 at lower concentration, even at ten ppm, can causing clearly frequency shift (around 25 Hz to 10 ppm), demonstrating high solution and suitable sensitivity. Additionally, the sharp decrease toward rinsing air and instant increase toward NH3 revealed good reversibility and fast recovery (≈100 s response time and 200 s recovery time). This result was greatly consistent with other literature.11,19,31 However, its cross-sensitivity toward other toxic gases, such as H2S and TMA, showing similar physicochemical properties as NH3, was ignored. Therefore, H2S and TMA were employed to test the cross-sensitivity of the obtained PANI/TiO2 based gas sensors. | ||
| Fig. 7 Dynamic responses of the gas sensor deposited by PANI/TiO2 toward (a) NH3, (b) H2S, (c) TMA (d) 100 ppm of NH3, H2S and TMA during cyclic tests. | ||
H2S is irritating toxic gas that can do significant damage to the human respiratory system and is found to be released from decayed eggs. Thus, the need to develop a novel sensor for detecting H2S has gained significant attention. The typical sensor response of the synthesized film toward H2S is illustrated in Fig. 7(b). The sensor exhibited regular frequency shift in contact with H2S as a function of concentration, inferring relatively high sensitivity and good reversibility. Unlike the chemical characteristics of NH3, H2S is acidic gas, which leads to no neutralization interaction with the dopant APS. Thus, the exposure of the sensor to H2S gas mainly involved physical adsorption.
TMA is another harmful gas, which is generated from rotten vegetables, fruits, and fish and is used as a remarkable index to test the freshness of fish during storage. Fig. 7(c) shows the dynamic sensor response of PANI/TiO2 nanocomposite toward TMA. The sensor exhibited a fast and good reversible response over increasing concentrations ranging from 10 ppm to 200 ppm. Compared with the excellent NH3 response, the sensor performance toward TMA presented a little noise in the dynamic response and a slight deviation of response–recovery shape in the repeatability test. This result was probably due to TMA having a larger mass and being more alkaline than NH3, thereby resulting in incomplete adsorption, harder desorption, and slower diffusion of TMA molecules with PANI/TiO2 bilayer.32
The reproducibility test of the PANI/TiO2 sensor was carried out among three targets gases at the same concentration of 50 ppm. Fig. 7(d) shows the fast and accurate change between target gases and flushing air in the cycle tests, exhibiting pretty good reproducibility. Moreover, the different magnitude of frequency shift to three different gases indicates good selectivity to ammonia gas, following with TMA and H2S.
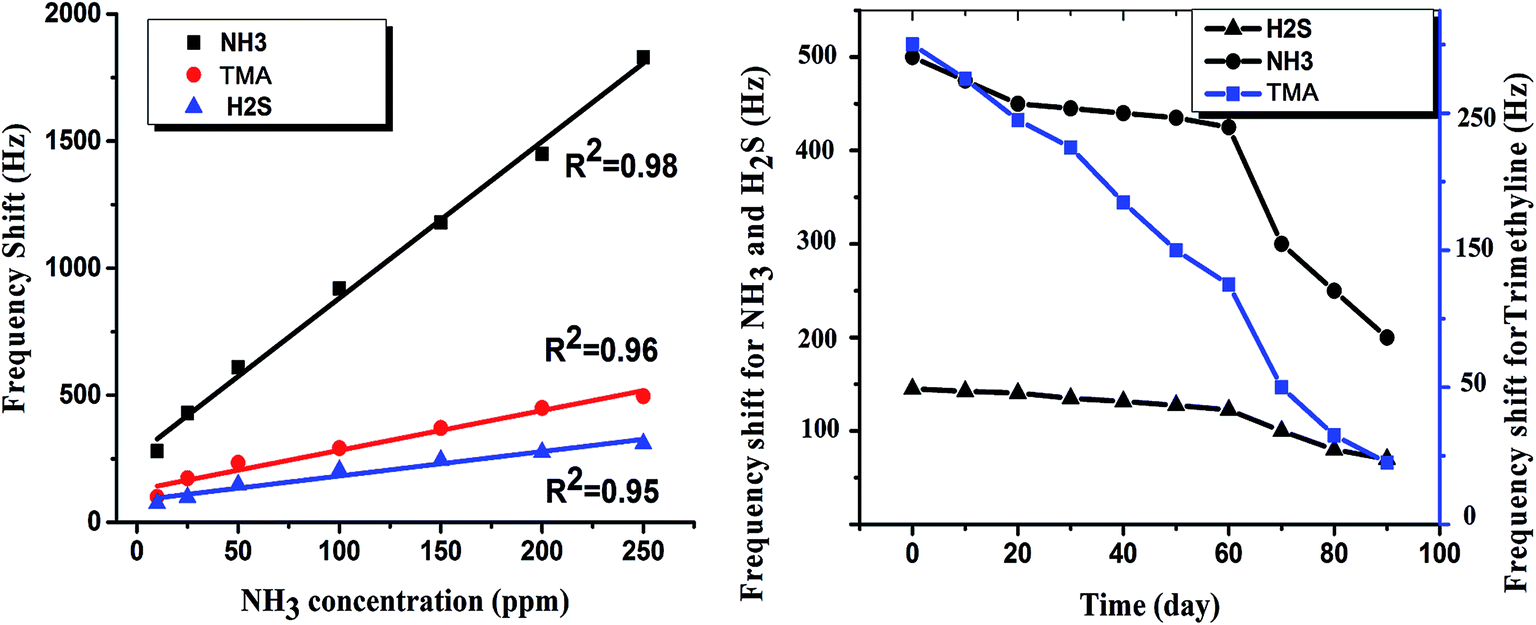
To further improve the wide application of the designed sensor in quantitative analysis, its linearity and stability were also investigated. As shown in Fig. 8(a), the frequency increased linearly with increasing concentration of the three tested gases. Among which, NH3 showed the most regular change and sharpest increase with R2 = 0.98, followed by H2S (R2 = 0.95), and TMA (R2 = 0.96). Excellent linear change is considered to be one of the primary properties for quantitative analysis and prediction. Stability during long periods in open environment was studied. In this work, the frequency changes were continuously measured and recorded toward NH3 at a constant concentration of 200 ppm over 90 days. Obviously, in the first 60 days, the sensor maintained satisfactory stability with slight variations, but in the last 30 days, its response decreased sharply, indicating poor stability, which is probably ascribed to different interaction between the sensitive film and the different toxic gases.
 | ||
| Fig. 8 (a) Fitting curve of sensor response as a function of the concentrations of NH3, TMA, and H2S; (b) stability of the sensor to NH3, TMA and H2S during 90 days. | ||
On the basis of above discussion, excellent sensitivity, good reversibility and linearity were represented, therefore, the facile fabrication of QCM based gas sensor deposited with sensitive PANI/TiO2 composite film by layer-by-layer self-assembled approach might provide an efficient ammonia gas sensor.
Application in food storage
For further investigation, examining the QCM-based sensor in life application is necessary. The home-made measurement device (Fig. 1) was employed to detect toxic gases and further monitor qualitative changes in rotten mango, egg, and fish during one week of storage. Mango is known to readily deteriorate during short storage and releases small amounts of NH3. H2S and TMA are the typical volatile gases generated from rotten eggs and fishes. These three toxic gases are known to be included in volatile organic compounds (VOCs) emitted from some deteriorated foodstuff. Furthermore, the variance in the amounts of NH3, H2S and TMA might be used as biomarkers in evaluating the quality of these three foodstuff (mango, egg and fish). Thereby, sensor response of volatile organic compounds emitted from the above mentioned three typical foods were measured successively during 6 days storage. It was assumed that if an apparent frequency change can be observed among different storage days, the shelf-life could be predicted or evaluated by this obtained sensor and corresponding home-made system. Their typical sensor response (4th day) were shown in Fig. 9. For mango, a typical dynamic sensor response and good reversibility can be observed in Fig. 9(a), revealing effective and accurate frequency values. Fig. 9(b) is the sensor response of decayed eggs. The fast response and good reproducibility could also be observed. In Fig. 9(c), despite the slight shift from the first cycle to the third cycle, excellent sensor behavior and good reversibility can be demonstrated. Fig. 9(d) shows the trends of sensor responses towards designed foodstuff during almost one week storage. It is worth noting that the frequency shift is significantly different from the first several days to the last two days. For example, the curves of mango and eggs present a slight increase over the first four days, but noticeably increase for the last two days, probably due to the growth of biomarker gases in toxic VOCs such as NH3 or H2S during storage. The trend of fish detection is different, as there is early increase starting from the third day. As expected, the trends of sharp increase demonstrate that the designed QCM gas sensors can effectively detect some toxic gases in toxic VOCs and could be used to evaluate the shelf-life of some typical foodstuff. | ||
| Fig. 9 Plot (a) sensor response of mango detection on day 4, plot (b) sensor response of fish detection on day 4, plot (c) sensor response of egg detection on day 4, plot (d) trends of the obtained sensor toward volatile organic compounds (VOCs) emitted from mango, fish and egg during 6 days monitor. | ||
Based on the above analysis, the designed QCM sensor deposited by PANI/TiO2 nanocomposite via LbL self-assembled technology can be successfully applied in food quality monitoring at room temperature.
Conclusion
PANI–PSSA/TiO2 ultrathin film was successfully and facilely synthesized via LbL self-assembly on a QCM chip. The sensor response based on frequency showed higher sensitivity, higher S/N ratio, and better stability than that based on resistance. The resulting QCM gas sensor exhibited high sensitivity to different gases at 10 ppm with high frequency shift, fast response and recovery time within 100 s, significant selectivity toward NH3, TMA, H2S, excellent reversibility, and long-term stability. The sensor sensitivity was closely related to the number of bilayers, with 10 bilayers as the most suitable. The successfully detection of toxic volatile organic compounds emitted from some rotten foodstuff indicated that NH3, H2S and TMA could be considered as biomarkers for shelf-life evaluation. Moreover, the resulting sensitive PANI/TiO2 based toxic gas sensor coated on QCM chip could be considered as a potential sensor in toxic VOCs detection and food quality determination. The satisfying gas sensor characteristics and outstanding sensor performance could be related to the formation of a p/n junction at the interface of the PANI bilayer and TiO2 bilayer and improved high specific surface area, which led to facilitated adsorption and diffusion of target molecules.Acknowledgements
The authors gratefully acknowledge the technical guidance from Dr Zheng Li and writing guidance from Dr Wenqing Wang.References
- K. Arshak, E. Moore, G. M. Lyons, J. Harris and S. Clifford, Sens. Rev., 2004, 24, 181–198 CrossRef.
- E. Ponzoni, I. Comini, M. Concina, M. Ferroni, E. Falasconi, V. Gobbi and G. Sberveglieri, Sensors, 2012, 12, 17023–17045 CrossRef PubMed.
- A. D. Wilson, Sensors, 2013, 13, 2295–2348 CrossRef CAS PubMed.
- E. H. Oh, H. S. Song and T. H. Park, Enzyme Microb. Technol., 2011, 48, 427–437 CrossRef CAS PubMed.
- A. J. Heeger, Angew. Chem., Int. Ed., 2001, 40, 2591–2611 CrossRef CAS.
- A. J. Heeger, Chem. Soc. Rev., 2010, 39, 2354–2371 RSC.
- K. Okamoto and C. K. Luscombe, Polym. Chem., 2011, 2, 2424–2434 RSC.
- C. Dhand, M. Das, M. Datta and B. D. Malhotra, Biosens. Bioelectron., 2011, 26, 2811–2821 CrossRef CAS PubMed.
- J. Vilčáková, P. Sáha, O. Quadrat and J. Stejskal, J. Phys. A: Math. Theor., 2001, 301, 29–36 Search PubMed.
- A. Lengálová, V. Pavlínek, P. Sáha, J. Stejskal, T. Kitano and O. Quadrat, J. Phys. A: Math. Theor., 2003, 321, 411–424 Search PubMed.
- M. O. Ansari and F. Mohammad, Sens. Actuators, B, 2011, 157, 122–129 CrossRef CAS PubMed.
- G. M. An, N. Na, X. R. Zhang, Z. J. Miao, S. D. Miao, K. L. Ding and Z. M. Liu, Nanotechnology, 2007, 18, 435707 CrossRef.
- S. J. Su and N. Kuramoto, Synth. Met., 2000, 114, 147–153 CrossRef CAS.
- M. R. Karim, K. T. Lim, M. S. Lee, K. Kim and J. H. Yeum, Synth. Met., 2009, 159, 209–213 CrossRef CAS PubMed.
- Y. G. Han, T. Kusunose and T. Sekino, J. Ceram. Process. Res., 2009, 10, 208–211 Search PubMed.
- X. M. Sui, Y. Chu, S. X. Xing, M. Yu and C. Z. Liu, Colloids Surf., A, 2004, 251, 103–107 CrossRef CAS PubMed.
- M. R. Karim, J. H. Yeum, M. S. Lee and K. T. Lim, React. Funct. Polym., 2008, 68, 1371–1376 CrossRef CAS PubMed.
- D. C. Schnizler and A. J. G. Zarbin, J. Braz. Chem. Soc., 2004, 15, 378–384 CrossRef PubMed.
- Q. Q. Lin, Y. Li and M. J. Yang, Synth. Met., 2012, 162, 2242–2249 CrossRef CAS PubMed.
- M. Radoičić, Z. Šaponjić, J. Nedeljković, G. Ćirić-Marjanović and J. Stejskal, Synth. Met., 2010, 160, 1325–1334 CrossRef PubMed.
- M. Rodahl, F. Höök, A. Krozer, P. Brzezinski and B. Kasemo, Rev. Sci. Instrum., 1995, 66, 3924–3930 CrossRef CAS PubMed.
- K. Kleo, A. Kapp, L. Ascher and F. Lisdat, Anal. Bioanal. Chem., 2011, 418, 260–266 CAS.
- P. A. Lieberzeit, A. Rehman, B. Najafi and F. L. Dickert, Anal. Bioanal. Chem., 2008, 391, 2897–2903 CrossRef CAS PubMed.
- H. H. Lou, Y. Zhang, Q. Xiang, J. Q. Xu, H. Li, P. C. Xu and X. X. Li, Sens.Actuators, B, 2012, 166–167, 246–252 CrossRef CAS PubMed.
- S. Q. Cui, Ph.D. thesis, Zhejiang University, 2015.
- S. Golczk, A. Kanciurzewska, M. Fahlman, K. Langer and J. J. Langer, Solid State Ionics, 2008, 179, 2234–2239 CrossRef PubMed.
- K. Sato, S. Takahashi and J. I. Anzai, Anal. Sci., 2012, 28, 929–938 CrossRef CAS.
- D. W. Hatchett and M. Josowicz, Chem. Rev., 2008, 108, 746–769 CrossRef CAS PubMed.
- J. P. Pouget, M. E. Jozefowicz, A. J. Epstein, X. Tang and A. G. MacDiarmid, Macromolecules, 1991, 24, 779–789 CrossRef CAS.
- M. R. Karim, H. W. Lee, I. W. Cheong, S. M. Park, W. Oh and J. H. Yeum, Polym. Compos., 2010, 31, 83–88 CAS.
- S. G. Pawar, M. A. Chougule, S. Sen and V. B. Patil, J. Appl. Polym. Sci., 2011, 125, 1419–1424 Search PubMed.
- H. L. Tai, Y. D. Jiang, G. Z. Xie, J. S. Yu and X. Chen, Sens. Actuators, B, 2007, 125, 644–650 CrossRef CAS PubMed.
- F. Mohammad, J. Phys. D: Appl. Phys., 1998, 8, 951–959 CrossRef.
- R. Schöllhorn and H. D. Zagefka, Angew. Chem., Int. Ed., 1997, 16, 199–200 CrossRef PubMed.
| This journal is © The Royal Society of Chemistry 2015 |