A new application of oily cold rolling mill sludge for preparing Fe2O3/graphene as anodes for lithium-ion batteries†
Cheng Liu‡
a,
Xinjing Wang‡b,
Peng Mab,
Jilu Chenb,
Jianzhong Jiangb,
Yani Aib,
Erqin Wanga,
Sheng Han*b and
Shaofeng Rong*a
aSchool of Perfume and Aroma Technology, Shanghai Institute of Technology, Shanghai 201418, China. E-mail: rongshaofeng@163.com; Tel: +86 13818786015
bSchool of Chemical and Environmental Engineering, Shanghai Institute of Technology, Shanghai 201418, China. E-mail: hansheng654321@sina.com; Tel: +86 13524694909
First published on 26th June 2015
Abstract
Oily cold rolling mill sludge, which consists of iron and oil and is hard to degrade, may cause problems in air or soil pollution. Therefore, the effective use of oily cold rolling mill sludge can not only reduce pollution but also produce environmental and economic benefits. In this research, the sludge was first used as the precursor to prepare LIB materials. As an anode material for lithium ion batteries, it showed a large reversible capacity of 560 mA h g−1 after 100 cycles at a small charge–discharge rate current of 100 mA g−1 as well as good rate capabilities of 508 and 380 mA h g−1 at ultrahigh current densities of 2000 and 5000 mA g−1.
1. Introduction
The increasing demand for an environmental friendly industry has attracted great attention from both academic and industrial organizations to develop new processes and novel materials. Oily cold rolling mill (CRM) sludge, a by-product of steel making in the process of cold rolled strip production, is basically composed of metallic iron and iron oxides (70–90 wt%) with variable oil and grease (7–20 wt%).1 In the past, landfill and incineration were generally regarded as the simplest measure for the treatment of oil sludge, which may cause problems in air or soil pollution. Now, more and more pollution-free method was adopted to deal with oil sludge. It has also become an attractive alternative material for sustainable production given the depletion of iron ores and the rapid increase in the price of metal.2–6To avoid the environment pollution, oil–solid separation is the most commonly used method, such as pyrolysis,7–9 electro-demulsification,10 aqueous surfactant washing,11,12 biological treatment,13 and distillation technology.14–16 Regardless of the technologies adopted for oil sludge treatment, only a few studies17 have maximized the use of iron resources in sludge.
Fe2O3/graphene composite is widely utilized in many fields, such as environmental protection,18,19 sensor applications,20–22 and catalysis.23,24 It also widely used in lithium ion batteries (LIBs) and supercapacitors because of its high theoretical specific capacity, good cycling stability, and excellent rate capability. Yu et al. employed a facile one-step hydrothermal method to synthesize Fe2O3/graphene nanocomposites; after cycling at 200 mA g−1 for 450 cycles, a capacity of 1049 mA h g−1 can still be maintained.25 Ning synthesized ∼3 nm of Fe2O3 nanoparticles uniformly distributed in the nanopores of NMG as anodes for LIBs through an adsorption–precipitation process.26 Hao et al. prepared Fe2O3/graphene nanocomposite through a one-step hydrothermal method and obtained high specific capacitance for supercapacitors.27 Nevertheless, fewer people ever synthesized Fe2O3/graphene with the iron resources in sludge. Therefore, developing an efficient and viable method for the synthesis of Fe2O3/graphene using waste is not only a major challenge but also can produce environmental and economic benefits.
In this paper, we present a novel method called alkali liquor-ultrasound to deal with oily CRM sludge. The percentage of oil in the sludge was significantly reduced through this method. Then, by using the metal powder from the oily CRM sludge as a raw material, Fe2O3/graphene was fabricated through a hydrothermal process in a DMF–water co-solvent system. When Fe2O3/graphene was applied as LIB anodes, it allowed for high capacity, good cycling stability, and excellent rate capability because of the combined advantage of metal oxides and graphene.
2. Experimental
2.1. Chemical materials
Oily CRM sludge was obtained from Shanghai Baosteel Group Corporation and graphite flakes were purchased from Sigma-Aldrich (USA). NaNO3, KMnO4, 98% H2SO4, 30% H2O2, and N, N-dimethylformamide (DMF) were purchased from Sinopharm Chemical Reagent Co. Ltd. (Shanghai, China). All chemicals were of analytical grade and were used as received without further purification.2.2. Pretreatment of oily CRM sludge
A mixture with 20 g of oily CRM sludge and sodium hydroxide solution (5%) at a mass ratio of 1 to 6 was ultrasonicated and agitated for 20 min. The mixture was then poured into centrifuge tubes. After centrifugation at 8000 rpm for 20 min, the solid phase was segregated from the mixture. The solid phase was dried in an oven at 60 °C overnight, heated, and then kept at this temperature for 12 h.2.3. Synthesis of Fe2O3/graphene nanocomposites
A total of 1.5 g of the solid phase and 8 mL H2SO4 (98%) were mixed and heated at 120 °C for 10 h. Then, 200 mL of distilled water was added for dilution. The iron source solution was segregated from the mixture after centrifugation at 8000 rpm for 30 min, followed by gradually adding a 10% aqueous solution of sodium hydroxide solution to adjust the pH to 3–4. Graphene oxide (GO) was synthesized from natural graphite flakes through a modified Hummers method.28,29 30 mL of graphene oxide (GO, 450 mg L−1) aqueous dispersion and 50 mL DMF were ultrasonicated with 20 mL of the iron source solution for 30 min to form a homogeneous suspension. At this time, 3 mL of H2O2 was added to accelerate oxidation. The stable suspension was then sealed in a Teflon-lined autoclave and hydrothermally treated at 180 °C for 12 h. After cooling to room temperature, the as-prepared sample was centrifuged, washed with distilled water three times, and then freeze dried for 24 h. For comparison, pure Fe2O3 samples was also prepared by the same procedure without graphene.2.4. Material characterizations
The morphology and structure of the samples was characterize with a field-emission scanning electron microscope (FESEM, Hitachi, S-4800N), a transmission electron microscope (TEM, JEOL, JEM–2010) and powder X-ray diffraction (XRD, PANalytical B.V, PW3040/60) with Cu–Kα irradiation (λ = 0.15406 nm) at 40 kV (20 mA) at 2θ range from 10° to 80°. The elemental analysis of the samples was investigated by X-ray fluorescence spectrometer (XRF, ARL, 9800XP). Raman spectra were obtained with a Senterra R200-L multichannel confocal micro spectrometer with 532 nm laser excitation. Thermogravimetric analysis (TGA) was conducted with TA Q5000IR at a heating rate of 10 °C min−1 under flowing air. Nitrogen adsorption/desorption isotherms at 77 K were determined by Micrometrics SAP 2010.2.5. Electrochemical measurements
The electrochemical properties of the samples were evaluated with CR 2016 coin cells at room temperature. The test electrodes consisted of active materials (80%), conductive carbon black (Super P) as the conductive agent (10%), and polyvinylidene fluoride (PVDF) dissolved in N-methyl-2-pyrrolidone (NMP) as the binder (10%) to form a slurry. The slurry was then coated onto copper foil with a thickness of 100 mm, and then punched into disks with a diameter of 13 mm as the test electrode. The total material loading was 0.8 mg cm−2. Celgard 2400 microporous polypropylene membrane and pure lithium foil were used as separator and counter electrode, respectively. The electrolyte consisted of a solution of 1 M LiPF6 in ethylene carbonate–dimethyl carbonate–diethyl carbonate (1![[thin space (1/6-em)]](https://www.rsc.org/images/entities/char_2009.gif) :
:![[thin space (1/6-em)]](https://www.rsc.org/images/entities/char_2009.gif) 1
1![[thin space (1/6-em)]](https://www.rsc.org/images/entities/char_2009.gif) :
:![[thin space (1/6-em)]](https://www.rsc.org/images/entities/char_2009.gif) 1, in wt%). The CR 2016 coin cells were assembled in an argon-filled glove box with water and oxygen contents less than 1 ppm. The discharge and charge measurements were evaluated with LAND 2001A system, with the cut off potentials being 0.01 V for discharge and 3.0 V for charge. All the specific capacities reported and current densities used were based on the total electrode weight. Electrochemical impedance spectroscopy (EIS) was performed on a CHI760D electrochemical workstation by applying a sine wave with an amplitude of 5 mV in the frequency range 100 kHz to 0.01 Hz.
1, in wt%). The CR 2016 coin cells were assembled in an argon-filled glove box with water and oxygen contents less than 1 ppm. The discharge and charge measurements were evaluated with LAND 2001A system, with the cut off potentials being 0.01 V for discharge and 3.0 V for charge. All the specific capacities reported and current densities used were based on the total electrode weight. Electrochemical impedance spectroscopy (EIS) was performed on a CHI760D electrochemical workstation by applying a sine wave with an amplitude of 5 mV in the frequency range 100 kHz to 0.01 Hz.
3. Results and discussion
3.1. Solid phase
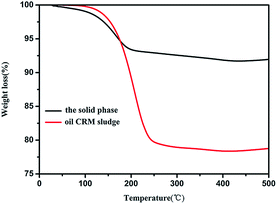
TGA measurement conducted in the air was utilized to determine the percentage of oil in the solid phase. As shown in Fig. 1 and Table S1,† the TGA curve were divided into four stages and the mainly weight loss is in second stage. First stage, the miniscule weight loss of the solid phase (<1%) and oily CRM sludge (2%) appeared at approximately 25–120 °C, indicating the combustion of water. The next stage at 120–200 °C and 120–250 °C was the significant weight loss of the solid phase and oily CRM sludge which was approximately 6% and 20%, respectively, indicating the combustion of the oil. The third stage was a stationary phase. In the fourth stage, there was a slight weight increase (<1%) that appeared at approximately 400–500 °C was attributed to the oxide of iron. Therefore, we concluded that the content of oil in sludge decreased from 20% to 6% through the proposed alkaline liquor-ultrasound method. The content of metals in the solid phase was estimated through XRF. Fig. 1 and Table 1 showed that the sample predominantly contains Fe (74.6 wt%) and small amounts of Cr, Mn, Ni, and Cu.| P | Ca | Mn | Fe | Cr | Ni | Cu | Zn |
|---|---|---|---|---|---|---|---|
| <0.1 | <0.1 | 2.0 | 74.6 | 4.6 | 1.0 | 0.5 | <0.05 |
3.2. Fe2O3/graphene nanocomposites
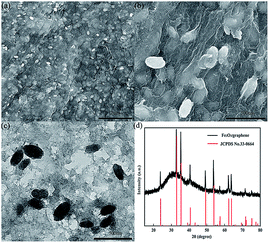
The morphology and microstructure of the as-prepared Fe2O3/graphene were elucidated by means of FESEM and TEM. The low-magnification image in Fig. 2a showed a complete picture, which consists of a thin, wrinkled, “paper-like” structure. The high-magnification SEM image in Fig. 2b showed that the Fe2O3 nanoparticles were uniformly distributed on the surface of graphene. Most Fe2O3 particles were encapsulated within the graphene sheets, which can efficiently prevent the aggregation of particles and avoid direct contact between Fe2O3 particles and electrolytes.The typical Fe2O3 particle size was 200–400 nm in diameter, which can be further confirmed by the TEM image in Fig. 2c. The crystal structure of the iron oxide nanoparticles in the nanocomposite was characterized by powder X-ray diffraction (Fig. 2d). Apparently, all the intense peaks can be well indexed to hematite Fe2O3 (JCPDS no. 33-0664), indicating that the crystallization of Fe2O3 during the hydrothermal treatment was not affected by the addition of GO sheets. No apparent diffraction peaks from graphene or graphene oxide were detected because of the ultrathin characteristic of the graphene sheets in the products.30
In order to explore specific surface area and the porous structure of Fe2O3/graphene, N2 adsorption–desorption analysis have been carried out (Fig. S1(a and b)†). The surface area of Fe2O3/graphene reached up to 175 m2 g−1, which contrasted markedly to that of pure Fe2O3, and the pore volume was 0.1 cm3 g−1 for Fe2O3/graphene. This result revealed that graphene coated was an effective way to achieve a high surface area. Moreover, based on the Barret–Joyner–Halenda (BJH) calculation, the average pore size was 2.5 nm. The high porosity can provide not only more surface reaction sites but also enough space to slow down the volume expansion of Fe2O3 during lithiation and delithiation, and was therefore favorable for the electrochemical properties.31
The synthesis of the Fe2O3/graphene can be described as follows: first, Fe(OH)3 colloid was generated after NaOH and H2O2 was added into the iron source solution. As was well known from colloidal science,32 hydroxide colloid are typically positively charged due to the adsorption of cations, while GO was negatively charged due to the presence of oxygen-containing groups. In this case, the combination of Fe(OH)3 and GO afforded a tight and uniform Fe(OH)3 deposition on the surface of GO. Then, when the mixture was hydrothermally treated at 180 °C, GO was reduced to graphene sheets33 accompanying with in situ transformation of Fe(OH)3 to Fe2O3 in DMF. And the chemical reaction equations can be represented as follows:
| Fe2+ + OH− = Fe(OH)2 |
| Fe(OH)2 + H2O2 = Fe(OH)3 + H2O |
| Fe(OH)3 = Fe2O3 + H2O |
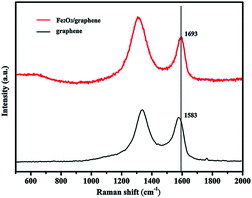
The Raman spectra of GO and Fe2O3/graphene are shown in Fig. 3. The peak at about 1590 cm−1 (G band) corresponding to an E2g mode of graphite is related to the vibration of sp2 hexagonal lattice, whereas the peak at about 1340 cm−1 of bonded carbon atoms in a 2D (D band) is related to the defects and disorders in the hexagonal graphitic layers.34,35 In this study, the intensity ratio of D/G bands for GO was 1.17; it increased to 1.47 for Fe2O3/graphene. The enhancement in the D/G ratio suggests an increase in the number of sp2 domains in Fe2O3/graphene and confirms the reduction in GO36,37 and the presence of Fe2O3 nanoparticles.38 The G peak of α-Fe2O3/graphene shifted to 1693 cm−1 compared with GO (1583 cm−1), which exhibited a 10 cm−1 blue shift. This phenomenon can be explained by the charge transfer between carbon materials and nanomaterials.39–42
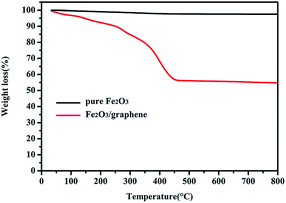
Fe2O3/graphene was characterized through TGA measurement carried out in air to determine its chemical composition. As shown in Fig. 4, the TGA curve of Fe2O3 displayed a significant weight loss of about 300 °C and a constant weight of above 450 °C. The major weight loss at 300 °C to 450 °C was approximately 35%, indicating the oxidation of graphene.38 The weight loss below 300 °C was attributed to the evaporation of unstable organic species as well as adsorbed water molecules.43,44 In a typical process, the weight loss below 300 °C is miniscule (<1%), but in this experiment, the proportion of this part is relatively large (10%), which may be resulting from the impurity in raw material. Therefore, the mass percentage of Fe2O3 in Fe2O3/graphene was calculated to be 55%.
3.3 Electrochemical properties
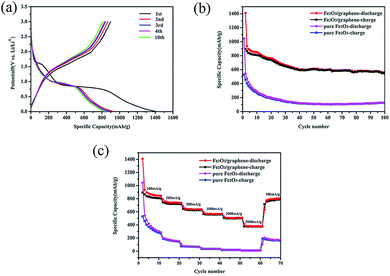
The electrochemical performance of the as-prepared Fe2O3/graphene was evaluated through galvanostatic discharge–charge (Li insertion–Li extraction) cycling in a cell by using lithium metal as the counter electrode at a current density of 100 mA g−1 between 0.01 and 3 V (Fig. 5a). The first discharge profile was divided into three: Fe2O3 → LixFe2O3 → cubic Li2Fe2O3 ↔ Fe + Li2O. The first stage at 1.6 V was caused by the phenomenon that a small amount of lithium ions was inserted into the Fe2O3 crystal structure.45,46 The next stage at 1.0 V was clearly observed and was found to be related to the decomposition of the electrolyte and the formation of a solid-electrolyte interface (SEI) layer.47 The last stage corresponded to the transformation of Fe2+ to Fe0 (ref. 45 and 46).The initial discharge capacity of Fe2O3/graphene was 1400 mA h g−1, and the charging capacity was 895 mA h g−1 with an initial Coulombic efficiency of 64% (Fig. 5a). The irreversible capacity loss (36%) can be ascribed to the formation of solid electrolyte interface (SEI) layer on the surface of the electrode during initial discharge.48 The Coulombic efficiency remained near 99% after 10 cycles, indicating the stability of the SEI film and the good reversibility of the electrochemical reactions.49,50
Fig. 5b shows the cycling performance of Fe2O3/graphene and pure Fe2O3 at a small, constant current rate of 100 mA h g−1. After 100 cycles, the discharge capacity of the Fe2O3/graphene was still close to 560 mA h g−1, which was much higher than the theoretical specific capacity of graphene (372 mA h g−1). Compared with pure Fe2O3, which only delivered a reversible capacity of 100 mA h g−1 after 100 cycles, it displayed good charge and discharge cycles. It could be ascribed to two reasons. First, the volume of the pure Fe2O3 increased sharply during lithiation and led to a reduction in capacity.51 The second reason was the positive contribution of the graphene nanosheet support. Using graphene as anodes for Li ion batteries has a positive influence on the performance of Fe2O3. Graphene provided not only a large specific surface area for the insertion and extraction of lithium ions but also mechanical flexibility to cushion the volume change of Fe2O3 anodes during cycling.52–54
In addition to its good performance rate, Fe2O3/graphene also exhibited excellent rate capability. The rate performance was evaluated by cycling the electrode 10 times at each of the six different current densities (from 0.1 A to 5 A). The representative cycling data were shown in Fig. 5c. It was clearly seen that the Fe2O3/graphene illustrate much better rate performances comparing to the reference pure Fe2O3. The discharge capacities of the Fe2O3/graphene were maintained at 842, 736, 639, and 570 mA h g−1 at current densities of 100, 200, 500, and 1000 mA g−1, respectively. Even at ultrahigh current densities of 2000 and 5000 mA g−1, the discharge capacities remained at 508 and 380 mA h g−1, corresponding to 60% and 46% retention, compared with 100 mA g−1. In addition, when the current density was reduced back to the initial 100 mA g−1 after the high rate test, the discharge capacities recovered to 790 mA h g−1, which indicated excellent rate performance. However, the pure Fe2O3 electrode displayed a noticeably poor rate capability with the increased current densities and the capacity retention is only about 20% after 70 cycles. EIS measurements were carried out, which can make us to gain insight into the electrochemical performances of Fe2O3/grapheme. Fig. S2† showed the Nyquist plots of Fe2O3/graphene and pure Fe2O3. As can be seen from the figure, the diameter of the semicircle for the Fe2O3/grapheme electrode in the high-to-medium-frequency region was much smaller than the pure Fe2O3, suggesting that the existence of graphene improves the conductivity of pure Fe2O3 a lot.55 As a result, the Fe2O3/grapheme performed a better electrochemical properties than the pure Fe2O3.
The high capacity, good cycling stability, and excellent rate capability of Fe2O3/graphene can be attributed to the following factors. First, the small size of the iron oxide nanoparticles accelerated the exchange speed of electrons and lithium irons. Second, the embedded structure between Fe2O3 particles and graphene prevented the aggregation of iron oxide and accommodated its volume expansion during cycling. Third, the high dispersion of Fe2O3 on graphene efficiently reduced the diffusion length for both electrons and lithium ions.
4. Conclusions
In summary, a novel method called alkali liquor-ultrasound was developed to deal with oily CRM sludge. The oil content of the sludge was reduced from 20% to 7%, and the state of the sludge changed from black viscous liquid to solid powder. Fe2O3/graphene was fabricated using the solid powder and graphene via a hydrothermal process in a DMF–water co-solvent system. When the Fe2O3/graphene was applied as LIB anodes, they provided an outstanding enhancement of capacity and rate performance, with a very high capacity of 1400 and 380 mA h g−1 at a high rate of 5000 mA g−1. The proposed synthetic strategy can be further extended to develop other waste metal materials used as lithium battery.Acknowledgements
This project was supported by the Shanghai Leading Academic Discipline Project (Project Number J51503), National Natural Science Foundation of China (Project Number 20976105), Science and Technology Commission of Shanghai Municipality (Project Number 09QT1400600), Innovation Program of Shanghai Municipal Education Commission (Project Number 11ZZ179) and Innovation Program of Shanghai Municipal Education Commission (Project Number 09YZ387), Shanghai Talent Development Funding (Project Number 201335).Notes and references
- B. Liu, S. G. Zhang, J. J. Tian, D. A. Pan, Y. Liu and A. A. Volinsky, Int. J. Miner., Metall. Mater., 2013, 20, 941 CrossRef CAS.
- C. Li, H. H. Sun, J. Bai and L. T. Li, J. Hazard. Mater., 2010, 174, 71 CrossRef CAS PubMed.
- Y. S. Sun, Y. X. Han, P. Gao, Z. H. Wang and D. Z. Ren, Int. J. Miner., Metall. Mater., 2013, 20, 411 CrossRef CAS PubMed.
- Y. L. Zhang, H. M. Li and X. J. Yu, J. Hazard. Mater., 2012, 213, 167 CrossRef PubMed.
- K. Jayasankar, P. K. Ray, A. K. Chaubey, A. Padhi, B. K. Satapathy and P. S. Mukherjee, Int. J. Miner., Metall. Mater., 2012, 19, 679 CrossRef CAS.
- Z. L. Yi, H. H. Sun, X. Q. Wei and C. Li, Int. J. Miner., Metall. Mater., 2009, 16, 355 CrossRef CAS.
- H. Schmidt and W. Kaminsky, Chemosphere, 2001, 45, 285 CrossRef CAS.
- J. L. Shie, C. Y. Chang, J. P. Lin, D. J. Lee and C. H. Wu, Energy Fuels, 2002, 16, 102 CrossRef CAS.
- J. L. Shie, J. P. Lin, C. Y. Chang, S. M. Shih, D. J. Lee and C. H. Wu, J. Anal. Appl. Pyrolysis, 2004, 71, 695 CrossRef CAS PubMed.
- M. Elektorowicz, S. Habibi and R. E. J. Chifrina, J. Colloid Interface Sci., 2006, 295, 535 CrossRef CAS PubMed.
- J. I. Chang, J. J. Lin, J. S. Huang and Y. M. Chang, Resour., Conserv. Recycl., 2006, 49, 191 CrossRef PubMed.
- B. Ruffino and M. C. Zanetti, Resour., Conserv. Recycl., 2008, 52, 1315 CrossRef PubMed.
- B. Mrayyan and M. N. Battikhi, J. Hazard. Mater., 2005, 120, 127 CrossRef CAS PubMed.
- H. C. Eun, H. C. Yang, Y. Z. Cho, H. S. Lee and I. T. Kim, J. Hazard. Mater., 2008, 160, 634 CrossRef CAS PubMed.
- Y. H. Zhou, W. B. Wu and K. Q. Qiu, Waste Manag., 2010, 30, 2299 CrossRef CAS PubMed.
- K. H. Lin, H. T. Hsu, Y. W. Ko, Z. X. Shieh and H. L. Chiang, J. Hazard. Mater., 2009, 171, 208 CrossRef CAS PubMed.
- Bo. Liu, S. G. Zang, J. J. Tian, D. A. Pan and H. X. Zhu, Rare Met., 2013, 32, 518 CrossRef CAS.
- S. Vadahanambi, S. H. Lee, W. J. Kim and I. K. Oh, Environ. Sci. Technol., 2013, 47, 10510 CAS.
- A. P. Singh, M. Mishra, P. Sambyal, B. K. Gupta, B. P. Singh, A. Chandra and S. K. Dhawan, J. Mater. Chem. A, 2014, 2, 3581 CAS.
- S. Radhakrishnan, K. Krishnamoorthy, C. Sekar, J. Wilson and S. J. Kim, Appl. Catal., B, 2014, 148, 22 CrossRef PubMed.
- S. Liang, J. Zhu, C. Wang, S. Yu, H. Bi, X. Liu and X. Wang, Appl. Surf. Sci., 2014, 292, 278 CrossRef CAS PubMed.
- Z. Jiang, J. Li, H. Aslan, Q. Li, Y. Li, M. Chen, Y. Huang, J. P. Froning, M. Otyepka, R. Zbořil, F. Besenbacher and M. Dong, J. Mater. Chem. A, 2014, 2, 6714 CAS.
- Y. Yuan, W. Jiang, Y. Wang, P. Shen, F. Li, P. Li, F. Zhao and H. Gao, Appl. Surf. Sci., 2014, 303, 354 CrossRef CAS PubMed.
- G. K. Pradhan, D. K. Padhi and K. M. Parida, ACS Appl. Mater. Interfaces, 2013, 5, 9101 CAS.
- H. Zhang, L. Zhou and C. Yu, RSC Adv., 2014, 4, 495 RSC.
- X. Zhu, X. Song, X. Ma and G. Ning, ACS Appl. Mater. Interfaces, 2014, 6, 7189 CAS.
- Z. Wang, C. Ma, H. Wang, Z. Liu and Z. Hao, J. Alloys Compd., 2013, 552, 486 CrossRef CAS PubMed.
- W. S. Hummers and R. E. Offeman, J. Am. Chem. Soc., 1958, 80, 1339 CrossRef CAS.
- Y. Y. Liang, D. Q. Wu, X. L. Feng and K. Müllen, Adv. Mater., 2009, 21, 1679 CrossRef CAS PubMed.
- L. Xiao, D. Q. Wu, S. Han, Y. Huang, S. Li, M. He, F. Zhang and X. L. Feng, ACS Appl. Mater. Interfaces, 2013, 5, 3764 CAS.
- C. F. Zhang, Z. X. Chen, Z. P. Guo and X. W. Lou, Energy Environ. Sci., 2013, 6, 974 CAS.
- R. Wang, C. Xu, M. Du, J. Sun, L. Gao, P. Zhang, H. Yao and C. Lin, Small, 2014, 10, 2260 CrossRef CAS PubMed.
- R. H. Wang, Y. Wang, C. H. Xu, J. Sun and L. Gao, RSC Adv., 2013, 3, 1194 RSC.
- M. X. Chen, C. C. Zhang, X. C. Li, L. Zhang, Y. L. Ma, L. Zhang, X. Y. Xu, F. L. Xia, W. Wang and J. P. Gao, J. Mater. Chem. A, 2013, 1, 2869 CAS.
- F. Tuinstra and J. L. Koenig, J. Chem. Phys., 1970, 53, 1126 CrossRef CAS PubMed.
- Y. Gu, Y. Xu and Y. Wang, ACS Appl. Mater. Interfaces, 2013, 5, 801–806 CAS.
- Z. Y. Sui, X. T. Zhang, Y. Lei and Y. J. Luo, Carbon, 2011, 49, 4314 CrossRef CAS PubMed.
- M. Zhang, B. Qu, D. Lei, Y. Chen, X. Yu, L. Chen, Q. Li, Y. Wang and T. Wang, J. Mater. Chem., 2012, 22, 3868 RSC.
- G. Zhou, D. W. Wang, L. C. Yin, N. Li, F. Li and H. M. Cheng, ACS Nano, 2012, 6, 3214 CrossRef CAS PubMed.
- J. Zhou, H. Song, L. Ma and X. Chen, RSC Adv., 2011, 1, 782 RSC.
- S. Niyogi, E. Bekyarova, M. E. Itkis, H. Zhang, K. Shepperd, J. Hicks, M. Sprinkle, C. Berger, C. N. Lau, W. A. deHeer, E. H. Conrad and R. C. Haddon, Nano Lett., 2010, 10, 4061 CrossRef CAS PubMed.
- M. S. Dresselhaus, A. Jorio, M. Hofmann, G. Dresselhaus and R. Saito, Nano Lett., 2010, 10, 751 CrossRef CAS PubMed.
- W. F. Chen, S. R. Li, C. H. Chen and L. F. Yan, Adv. Mater., 2011, 23, 5679 CrossRef CAS PubMed.
- C. Z. Zhu, S. J. Guo, Y. X. Fang and S. J. Dong, ACS Nano, 2010, 4, 2429 CrossRef CAS PubMed.
- L. Zhou, H. Y. Xu, H. W. Zhang, J. Yang, S. B. Hartono, J. Zou and C. Z. Yu, Chem. Commun., 2013, 49, 8695 RSC.
- W. J. Yu, P. X. Hou, F. Li and C. Liu, J. Mater. Chem., 2012, 22, 13756 RSC.
- Z. Wang, D. Luan, S. Madhavi, Y. Hu and X. W. D. Lou, Energy Environ. Sci., 2012, 5, 5252 CAS.
- J. J. Zhang, T. Huang, Z. L. Liu and A. S. Yu, Electrochem. Commun., 2013, 29, 17 CrossRef CAS PubMed.
- F. Han, W. C. Li, M. R. Li and A. H. Lu, J. Mater. Chem., 2012, 22, 9645 RSC.
- F. Han, D. Li, W. Li, C. Lei, Q. Sun and A. Lu, Adv. Funct. Mater., 2012, 23, 1692 CrossRef PubMed.
- J. Lin, A. R. O. Raji, K. Nan, Z. Peng, Z. Yan, E. L. G. Samuel, D. Natelson and J. M. Tour, Adv. Funct. Mater., 2014, 24, 2044 CrossRef CAS PubMed.
- D. Z. Chen, W. Wei, R. N. Wang, J. C. Zhu and L. Guo, New J. Chem., 2012, 36, 1589 RSC.
- D. Q. Wu, F. Zhang, H. W. Liang and X. L. Feng, Chem. Soc. Rev., 2012, 41, 6160 RSC.
- D. Q. Wu, F. Zhang, P. Liu and X. L. Feng, Chem.–Eur. J., 2011, 17, 10804 CrossRef CAS PubMed.
- H. Xiang, K. Zhang, G. Ji, J. Y. Lee, C. Zou, X. Chen and J. Wu, Carbon, 2011, 49, 1787 CrossRef CAS PubMed.
Footnotes |
| † Electronic supplementary information (ESI) available. See DOI: 10.1039/c5ra06602f |
| ‡ These two authors contributed equally to this work. |
| This journal is © The Royal Society of Chemistry 2015 |

