Conformational structure-dependent molecular recognition of two aptamers for tetracycline†
Sai
Wang
,
Jiahui
Liu
,
Yiyang
Dong
*,
Haijia
Su
and
Tianwei
Tan
Beijing Key Laboratory of Bioprocess, College of Life Science and Technology, Beijing University of Chemical Technology, Beijing 100029, P. R. China. E-mail: yydong@mail.buct.edu.cn; Fax: +86-10-64445535; Tel: +86-10-64446260
First published on 11th June 2015
Abstract
Different aptamers towards one target molecule can be selected by Systematic Evolution of Ligands by Exponential Enrichment (SELEX), however, not all aptamers have real world practicability. In this study, conformational structure-dependent molecular recognition of two aptamers towards tetracycline (TC), 76 mer and 40 mer, was studied both quantitatively and computationally. Two formats of competitive enzyme-linked aptamer assay (ELAA), a molecular docking module and Isothermal Titration Calorimeter (ITC) analysis were used to further investigate the two selected aptamers. With longer strand length, more G, C bases, and more recognition sites for TC, the 76 mer aptamer showed better performance than the 40 mer aptamer. Deciphering the relevance of aptamers with different molecular characteristics towards one target molecule can furnish as a referral guidance for aptamer selection and further practical application.
1. Introduction
The past decades have witnessed aptamers' application in the analytical, bioanalytical, diagnostic, and therapeutic fields for researches on cells, proteins, and small molecules, etc.1–5 Aptamers are selected by Systematic Evolution of Ligands by Exponential Enrichment (SELEX) in vitro assisted by other techniques, such as Surface Plasmon Resonance (SPR), for specificity and affinity characterization. Therefore, multiple aptamers, DNA or RNA, with different conformational structures, can be successfully selected towards one target molecule. However, not all selected aptamers can perform well, and poor performance will limit the practical application of aptamers. Although various applications of aptamers have emerged, relevance of practicability versus and conformational structure of aptamers is poorly understood.As the recognition elements, aptamers come into adaptive folding to form stable three-dimensional structures with the presence of target molecules. The specific conformational structures depend on properties of aptamer and environmental variables.6 Furthermore, specific recognition of aptamers with their targets derives from a combination of geometrical complementarity (e.g. stems, loops, bulges, hairpins, pseudoknots, triplexes, or quadruplexes) and molecular interactions (e.g. stacking effect of aromatic rings and the nucleobases of the aptamers, electrostatic attraction between charged groups, van der waals forces and hydrogen bonds).7 For small molecule targets, aptamers fold from disordered structures into well-defined binding pockets, adjusting their recognition surface with the target molecules and encapsulating upon binding.7,8
Identification and quantification of small molecules are essential for clinical diagnosis, environmental security, and food safety. Various novel aptamer-based assays or aptasensors have been reported in recent years as highly sensitive and specific biotechnological tools for small molecule quantitation. Tetracycline (TC), a typical low-molecular-weight antibiotic, is widely used as for prevention and therapy of diseases. However, overdose or off-label prescription to patients and illegal adulteration to animal-derived food may result in high level drug residue and threaten human health. Several specific DNA or RNA aptamers for TC has been selected by SELEX,9–11 however, not all selected aptamers can perform well. For example, Jeong and Rhee Paeng reported that the enzyme-linked aptamer assay (ELAA) in their research was not superior to the ELISA method in terms of specificity.12 In addition, some aptamer-based researches for TC detection in our lab do not obtain satisfactory results in terms of detection sensitivity and linear range, and thus the methods cannot be reported.
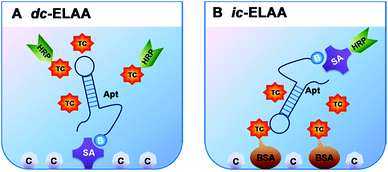
In this study, we chose TC as a representative of small molecules, and investigated two anti-TC DNA aptamers, which have different length (76 mer (ref. 11) and 40 mer (selected by Base Pair Biotechnologies), with comparable Kd, 63.6 nM and 2.94 µM, respectively) and structural complexity (Fig. 1A and B), to analyze the conformational structure-dependent molecular recognition of different aptamers towards one target molecule for the first time. We applied two formats of competitive inhibition assays to investigate the two aptamers: direct enzyme-linked aptamer assay (dc-ELAA), with competition between free TC and TC-HRP conjugates; indirect enzyme-linked aptamer assay (ic-ELAA), with competition between free TC and TC-BSA conjugates (Fig. 2A and B). The competitive inhibition assays were dose-responsive over a wide range of concentrations of TC. With longer strand length, more G, C bases (68.4%), and more recognition sites for TC, the 76 mer aptamer showed better performance than the 40 mer aptamer (32.5% of G, C).
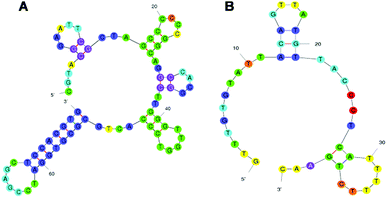 | ||
| Fig. 1 Secondary structures of the aptamers. (A) Predicted secondary structure of the 76 mer aptamer.15 (B) Predicted secondary structure of the 40 mer aptamer. Secondary structure of the aptamers predicted by m-fold according to free energy minimization algorithm. | ||
2. Materials and methods
2.1. Reagents
Streptavidin (SA), horseradish peroxidase labeled streptavidin (SA-HRP), and 3,3′,5,5′-tetramethylbenzidine dihydrochloride (TMB) were purchased from KPL (Gaithersburg, MD, USA). TC standard and Hammerstein bovine casein (casein) were purchased from Sigma-Aldrich (St. Louis, Mo, USA). Horseradish peroxidase labeled tetracycline (TC-HRP) was purchased from Shandong LvDu Bio-sciences & Technology Co., Ltd (Shandong, China). TC-BSA was obtained from NanKai Biotech Co., Ltd. (Hangzhou, China). The single-strand 76 mer DNA aptamer was custom synthesized with 3′-end biotinylated modification (Mw (23![[thin space (1/6-em)]](https://www.rsc.org/images/entities/char_2009.gif) 747.43), Kd = 63.6 nM) by Sangon Biotech Co., Ltd. (Shanghai, China), with the following sequence: 5′-CGTACGGAATTCGCTAGCCCCCCGGCAG GCCACGGC TTGGGTTGGTCCCACTGCGCGTGGATCCGAGCTCCACGTG-3′. The single-strand 40 mer DNA aptamer was custom synthesized and labeled with 3′-end biotinylated modification (Mw (12
747.43), Kd = 63.6 nM) by Sangon Biotech Co., Ltd. (Shanghai, China), with the following sequence: 5′-CGTACGGAATTCGCTAGCCCCCCGGCAG GCCACGGC TTGGGTTGGTCCCACTGCGCGTGGATCCGAGCTCCACGTG-3′. The single-strand 40 mer DNA aptamer was custom synthesized and labeled with 3′-end biotinylated modification (Mw (12![[thin space (1/6-em)]](https://www.rsc.org/images/entities/char_2009.gif) 779.8), Kd = 2.94 µM) by Operon Biotechnologies, Inc. (Alabama, USA) with the following sequence: 5′-GTTTGTGTATTACAGTTATGTTACCCTCATTTTTCTGAAC-3′. Aptamers were dissolved in ultrapure water at a concentration of 100 µM. Single-strand 40 mer DNA aptamer used for Isothermal Titration Calorimeter (ITC) analysis was synthesized by Sangon Biotech Co., Ltd. (Shanghai, China). All chemicals were of analytical grade and buffers were prepared with ultrapure water and filtered using 0.22 µm membrane filter before use.
779.8), Kd = 2.94 µM) by Operon Biotechnologies, Inc. (Alabama, USA) with the following sequence: 5′-GTTTGTGTATTACAGTTATGTTACCCTCATTTTTCTGAAC-3′. Aptamers were dissolved in ultrapure water at a concentration of 100 µM. Single-strand 40 mer DNA aptamer used for Isothermal Titration Calorimeter (ITC) analysis was synthesized by Sangon Biotech Co., Ltd. (Shanghai, China). All chemicals were of analytical grade and buffers were prepared with ultrapure water and filtered using 0.22 µm membrane filter before use.
2.2. Instrumentation
ELAA was performed in 8 well Flat-Bottom Immuno Plates (Nunc, Denmark) and incubated in a SPX-70 biochemical incubator (National Science Instrument and Technology Co., Ltd., Beijing, China). A MX-M 96-well plate mixer (Dragon Laboratory Instruments, Ltd., Beijing, China) was used to shake the plates and an ELx50 microplate strip washer (BioTek Instruments, Inc., Winooki, Vermount, USA) was applied to wash the plates. An ELx800 absorbance microplate reader (BioTek Instruments, Inc., Winooki, Vermount, USA) was used to measure the absorbance at both 450 nm and 630 nm. The ultrapure water was prepared by Thermo Scientific Barnstead GenPure Water Purification System (Thermo Electron LED GmbH, Stockland 3, D-56412 Niederelbert). The ITC analysis was performed on the MicroCal™ iTC200.2.3. Software and web server resource
The secondary structures of aptamers were predicted by the m-fold web server. The tertiary structures of aptamers were predicted by Mc-fold/sym web server and visualized with SYBYL software. Molecule-recognition and specific-recognition-sites prediction were achieved with the molecular docking module surflex-dock in SYBYL package.2.4. Development of ELAA
The two DNA aptamers were applied for the recognition TC. In the dc-ELAA, the immobilized aptamer was competed by TC and TC-HRP, and in the ic-ELAA, the limited aptamer was competed by TC and TC-BSA. Before immobilization or addition, aptamers needed to be denatured at 95 °C for 10 min and cooled down rapidly at 0 °C for 10 min to block its unfolded structure and then the unfolded aptamers came into adaptive folding from uncertain conformation to energy-efficient three-dimension structures when meeting with their targets in solution.5,13,142.5. Isothermal titration calorimetry assay
ITC was performed with a MicroCal iTC200 instrument. The 40 aptamer and TC solution were degassed and temperated before measurement. The 40 aptamer and TC were dissolved in the same buffer (20 mM Tris–HCl (pH 7.4), 100 mM NaCl, 0.005% Tween-20) to ensure the buffer matching. The titration experiment was performed in a sample cell (300 µL) containing 25 µM of 40 mer aptamer and a syringe (40 µL) containing 770 µM of TC. The change of heat rate during the titration was measured in real time. Blank experiment was carried out under the same conditions by directly injecting TC into the buffer without the 40 aptamer. Data were then fitted to a one set of sites binding model and the number of recognition sites was identified.3. Results and discussions
Detailed optimization of concentration of aptamers was carried out to get an absorbance near 1.0 as shown in Fig. 3A and B. At the same diluted concentration, the 40 mer aptamer leads to a smaller absorbance than the 76 mer aptamer. And higher concentration of the 40 mer aptamer, even dozens of times, is needed than that of the 76 mer aptamer to obtain a similar absorbance. Based on these results, 50 nM of 40 mer aptamer and 5 nM of 76 mer aptamer were used in the dc-ELAA, and 50 nM of 40 mer aptamer and 10 nM of 76 mer were applied in the ic-ELAA. TC standard was dissolved and diluted into concentrations varying from 1 pg mL−1 to 10 µg mL−1 in the dc-ELAA and from 0.5 pg mL−1 to 1 µg mL−1 in the ic-ELAA. The inhibition dose-curves are demonstrated in Fig. 4A–D. According to the results, both of the two formats of ELAA exhibited relatively narrower linear range with 40 mer aptamer than with 76 mer aptamer.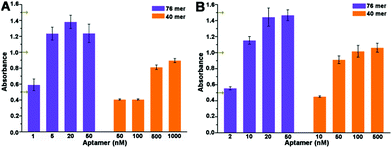 | ||
| Fig. 3 Optimization of concentrations of aptamers. (A) Optimization of aptamer concentration in dc-ELAA. (B) Optimization of aptamer concentration in ic-ELAA. | ||
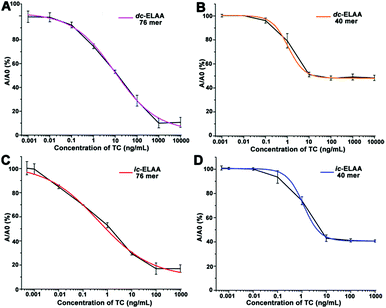 | ||
| Fig. 4 Inhibition curves for TC quantitation in ELAA. (A) Inhibition curves with the 76 mer aptamer in dc-ELAA.16 (B) Inhibition curves with the 40 mer aptamer in dc-ELAA. (C) Inhibition curves with the 76 mer aptamer in ic-ELAA.15 (D) Inhibition curves with the 40 mer aptamer in ic-ELAA. Data points are the average ± one standard deviation (n = 3). All curves were fitted using log/logistic model. | ||
The aptamers generally incorporated and binded with TC molecules on single stranded regions known as “bulge” or “loop”, involving stacking of planar moieties, specific hydrogen bonding, and molecular shape complementarity.7,17 In addition, the planar structure of TC (Fig. S1, ESI†) contributed to the stacking and hydrogen-bonding interactions and numerous other discriminatory intermolecular contacts with the folding aptamers.7,9 The two aptamers had different base sequences and strand length, they folded into different secondary structures, and the number of recognition sites (mainly stem-loop) of aptamers differed from each other (Fig. 1A and B), i.e., the two aptamers had different conformational structural complexity. The structural complexity of aptamers then influenced specific molecular recognition of aptamers for TC. Total recognition sites for interaction between aptamers and TC were determined by both structural complexity and concentration of aptamers. Therefore, higher concentration of the 40 mer aptamer was required than that of the 76 mer aptamer because the 40 mer aptamer had relatively simpler conformational structure. On the other hand, the linear ranges of the ic-ELAA and dc-ELAA were also affected by the structural complexity of aptamers. The 76 mer aptamer folded into a more complex conformational structure and provided more recognition sites for TC during the competition assays; therefore, the high end of the linearity is higher with the 76 mer aptamer than with the 40 mer aptamer in Fig. 4.
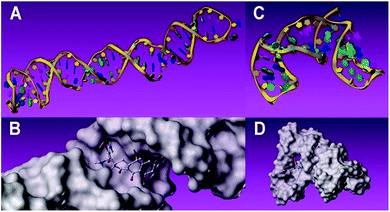
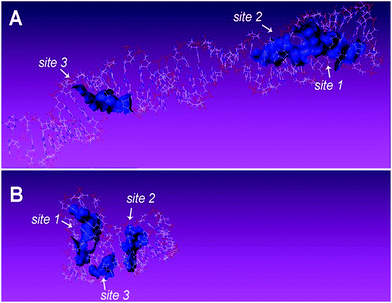
Complementary evidence was provided with a molecular docking module for molecule-recognition and specific-recognition-sites prediction. The tertiary structure of aptamers and surface representation of interaction between the two aptamers and TC are shown in Fig. 5A–D. Three potential recognition sites of the 76 mer aptamer (Fig. 6A) and three potential recognition sites of the 40 mer aptamer (Fig. 6B) are demonstrated. The potential sites of 76 mer aptamer scatter across the tertiary structure, and both the number and location of the predicted recognition sites accord with the predicted stem-loop motifs in the secondary structure (Fig. 1A, Fig. S2A–C, Table S1, ESI†). However, the predicted recognition sites of the 40 mer aptamer distribute rather closely and many component bases are overlapping in the three predicted recognition sites (Fig. 1B, Fig. S2E and F, Table S1, ESI†). In light of the strand length and the stem-loop motifs predicted in the secondary structure (Fig. 1B), the 40 mer aptamer was most likely to have fewer factual recognition sites than the 76 mer aptamer. Therefore, the molecular docking module convinced that the 76 mer aptamer had more recognition sites for TC than the 40 mer aptamer did, which was consistent with our experimental results.
In order to validate the molecular docking results, supportive ITC experiment (Fig. 7) was performed to demonstrate the multivalent binding between TC and the prototypical 40 mer aptamer, the predicted potential recognition sites (N = 2.96 ± 0.0621) were identified by ITC unequivocally. The result confirmed the multivalent binding between aptamers and TC.
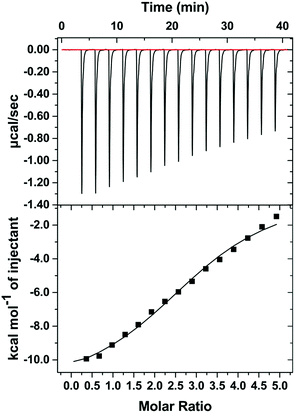 | ||
| Fig. 7 ITC analysis of binding between TC with the 40 mer aptamer in binding buffer II (20 mM Tris–HCl (pH 7.4), 100 mM NaCl, 0.005% Tween-20). | ||
As the 76 mer aptamer had lower Kd towards TC and wider linear range for TC quantitation than the 40 mer aptamer, the 76 mer aptamer might contain more specific bases or have better propensity to fold and combine with TC than the 40 mer aptamer. To ascertain this, we tabulated the aptamers' nucleotide composition (Table 1). The 40 mer aptamer was A, T-rich and the 76 mer aptamer had more G, C bases exposed and had a higher Tm than the 40 mer aptamer. The G bases were strictly required at specific position of the stem-loop motifs.11,18 Both the prediction of secondary structure of aptamers and molecular docking module showed that the G, C bases of the 76 mer aptamer played an important role in the interaction of aptamers and TC, while the influence from A, T bases was less pronounced. As the 40 mer aptamer was A, T-rich, it had fewer specific recognition sites for TC than the 76 mer aptamer.
| Aptamers | A, T (%) | G, C (%) | Tm (°C) |
|---|---|---|---|
| 76 mer | 31.6 | 68.4 | 83.77 |
| 40 mer | 67.5 | 32.5 | 63.13 |
The present study is different from those sequence truncation researches,18,19 which are performed to narrow down the redundant sequence and binding regions that are not important for interaction between one aptamer and its target, thus obtain higher affinity than the original one. For example, M. B. Gu et al. truncated a 76 mer DNA aptamer of oxytetracycline to 8 mer, CGGTGGTG, by utilizing the conserved sequences with high homogeneity that exist in the selected aptamers. The 8 mer aptamer exhibited quite high affinity to TCs. The present study investigated the difference between two aptamers with limited homology (Fig. S3, ESI†) towards the same target. The base composition influenced the aptamers' tendency to form specific binding sites and the strand length further affected the number of recognition sites of aptamers. With different structural complexity, aptamers came into different conformational structures and thus showed different performance in the molecular recognition with their target molecule. Thus the 76 mer aptamer showed better performance than the 40 mer aptamer in the present study. Although the focus point was different from those of truncation researches, the present study may be considered as complementary part of the truncation research.
Insufficient investigation of aptamers after selection with SELEX sometimes leads to time-consuming but unsatisfactory results. In addition, aptamers have significant properties, but they have been applied mostly in scientific researches and introduced slowly to the marketplace, with only one aptamer drug receiving approval so far.20 Although aptamers can be generated against numerous targets with high specificity and affinity, and improvement is being designed to select aptamers with high-throughput, the practical applicability of aptamers needs more attention. Moreover, ELAA may be applied as a simple and convenient method for additional investigation of aptamers after SELEX selection.
4. Conclusions
In conclusion, we demonstrated conformational structure-dependent molecular recognition of two aptamers for TC, substantiated by experimental assays and computer simulation. Assessment of the two aptamers with different conformational structures revealed that the strand length, specific bases-rich property, and number of recognition sites of aptamers for their target codetermined the recognition between aptamers and TC. Deciphering the relevance of various aptamers with different molecular characteristics towards one target molecule is expected to promote studies on the development of aptamer science and technology.Acknowledgements
Authors thank Ph.D Yue Kong in Beijing University of Chemical Technology for her help in the computational prediction. Authors acknowledge Miss Zhiling Zhu in Institute of Medicinal Biotechnology, Chinese Academy of Medical Science and Peking Union Medical College for her technical assistance on ITC measurement.References
- M. Citartan, S. C. B. Gopinathb, J. J. Tominaga, S. C. Tan and T. H. Tang, Biosens. Bioelectron., 2014, 34, 1–11 CrossRef PubMed.
- Y. Y. Dong, Y. Xu, W. Yong, X. G. Chu and D. N. Wang, Crit. Rev. Food Sci. Nutr., 2014, 54, 1548–1561 CrossRef CAS PubMed.
- A. B. Iliuk, L. H. Hu and W. A. Tao, Anal. Chem., 2011, 83, 4440–4452 CrossRef CAS PubMed.
- S. P. Song, L. H. Wang, J. Li, J. L. Zhao and C. H. Fan, Trends Anal. Chem., 2008, 27, 108–117 CrossRef CAS PubMed.
- S. Tombelli, M. Minunni and M. Mascini, Biosens. Bioelectron., 2005, 20, 2424–2434 CrossRef CAS PubMed.
- C. Reinemann and B. Strehlitz, Swiss Med. Wkly., 2014, 144, w13908 Search PubMed.
- T. Hermann and D. J. Patel, Science, 2000, 287, 820–825 CrossRef CAS.
- E. Peyrin, J. Sep. Sci., 2009, 32, 1531–1536 CrossRef CAS PubMed.
- C. Berens, A. Thain and R. Schroeder, Bioorg. Med. Chem., 2001, 9, 2549–2556 CrossRef CAS.
- M. Müller, J. E. Weigand, O. Weichenrieder and B. Suess, Nucleic Acids Res., 2006, 34, 2607–2617 CrossRef PubMed.
- J. H. Niazi, S. J. Lee and M. B. Gu, Bioorg. Med. Chem., 2008, 16, 7245–7253 CrossRef CAS PubMed.
- S. Jeong and I. Rhee Paeng, Sci. World J., 2012, 2012, 159456, DOI:10.1100/2012/159456.
- G. R. Bishop, J. S. Ren, B. C. Polander and B. D. Jeanfreau, Biophys. Chem., 2007, 126, 165–175 CrossRef CAS PubMed.
- F. Ducongé, C. Di Primo and J. J. Toulmé, J. Biol. Chem., 2000, 275, 21287–21294 CrossRef PubMed.
- S. Wang, W. Yong, J. H. Liu, L. Y. Zhang, Q. L. Chen and Y. Y. Dong, Biosens. Bioelectron., 2014, 57, 192–198 CrossRef CAS PubMed.
- S. Wang, J. H. Liu, W. Yong, Q. L. Chen, L. Y. Zhang, Y. Y. Dong, H. J. Su and T. W. Tan, Talanta, 2015, 131, 562–569 CrossRef CAS PubMed.
- H. Xiao, T. E. Edwards and A. R. Ferré-D'Amaré, Chem. Biol., 2008, 15, 1125–1137 CrossRef CAS PubMed.
- Y. S. Kwon, N. H. Ahmad Raston and M. B. Gu, Chem. Commun., 2014, 50, 40–42 RSC.
- S. Jayasena, Clin. Chem., 1999, 45, 1628–1650 CAS.
- A. D. Keefe, S. Pai and A. Ellington, Nat. Rev. Drug Discovery, 2010, 9, 537–550 CrossRef CAS PubMed.
Footnote |
| † Electronic supplementary information (ESI) available: Fig. S1–S3, Table S1. See DOI: 10.1039/c5ra08050a |
| This journal is © The Royal Society of Chemistry 2015 |

