A cathodic luminol-based electrochemiluminescence biosensor for detecting cholesterol using 3D-MoS2–PANI nanoflowers and Ag nanocubes for signal enhancement
Xin Oua,
Xingrong Tanb,
Xiaofang Liua,
Hongmei Chena,
Yu Fana,
Shihong Chen*a and
Shaping Wei*a
aKey Laboratory of Luminescence and Real-Time Analytical Chemistry (Southwest University), Ministry of Education, College of Chemistry and Chemical Engineering, Southwest University, Chongqing 400715, People's Republic of China. E-mail: cshong@swu.edu.cn; shapingw@swu.edu.cn; Fax: +86-23-68253172; Tel: +86-23-68253172
bDepartment of Endocrinology, 9th People's Hospital of Chongqing, Chongqing 400700, China
First published on 21st July 2015
Abstract
A sensitive cathodic luminol-based electrochemiluminescence (ECL) biosensor for detecting cholesterol was fabricated with three-dimensional MoS2–polyaniline (3D-MoS2–PANI) nanoflowers and Ag nanocubes (AgNCs) for signal enhancement. In this study, the synthesized 3D-MoS2–PANI–AgNCs nanocomposites with a large surface area were used as a matrix for loading a high amount of cholesterol oxidase (ChOx). Subsequently, the loaded ChOx efficiently catalyzed the oxidation of cholesterol to produce H2O2 in situ, which could promote the oxidation of luminol to generate a cathodic ECL signal. In addition, 3D-MoS2–PANI–AgNCs nanocomposites accelerate the decomposition of H2O2 into reactive oxygen species (ROSs), which increase the ECL intensity. Due to the integration of the properties of 3D-MoS2–PANI nanoflowers and AgNCs, the proposed cholesterol biosensor exhibits a wide linear response range from 3.3 nM to 0.45 mM with a low detection limit of 1.1 nM.
Introduction
Luminol and its derivatives, as some of the most extensively investigated and used luminophores for electrochemiluminescence (ECL) systems, have attracted considerable attention due to their excellent inherent properties such as non-toxicity, low cost, low oxidation potential and high quantum yield.1,2 As is well known, the ECL emission of luminol can be enhanced by reactive oxygen species (ROSs) such as hydroxyl radical (OH˙) and superoxide anion (O2˙−).3 Moreover, ROSs can be generated from H2O2, which is the product of many biologically active substrates with the catalysis of corresponding enzymes.4 Therefore, luminol-based ECL systems have been widely applied in enzyme biosensing where H2O2 could be produced and further converted to ROSs, thus enhancing the luminol-based ECL emissions.5,6 In particular, many luminol-based sensors have been reported based on anodic ECL of luminol, and the peak potential position was observed at about 0.5 V (vs. Ag/AgCl).7,8 However, there are many factors that hinder detection at this potential. Compared with the anodic ECL of luminol, its cathodic ECL has been investigated relatively rarely.9For example, Jiang et al. reported an immunosensor based on the cathodic ECL of luminol for the detection of carcinoembryonic antigen and the immunosensor exhibited a single peak.10 Therefore, it is necessary to explore new cathodic luminol-based ECL sensors to expand the bioanalytical applications of ECL.
Molybdenum disulfide (MoS2), with a two-dimensional (2D) layered structure similar to graphite, is composed of three stacked atomic layers (S–Mo–S) linked together by weak van der Waals interactions.11,12 With its exceptional physical and chemical properties, MoS2 has aroused considerable attention in many fields such as catalysis,13 sensors,14 and lithium batteries.15 More importantly, Lin et al. discovered that MoS2 possesses intrinsic peroxidase-like activity and can catalyze the decomposition of H2O2 into OH˙.16 Thus, MoS2 could be one of the most suitable nanomaterials for luminol-based ECL enzyme biosensing. In addition, MoS2 can be integrated with carbon-based materials and metal or metal oxide nanoparticles to exhibit synergistic effects such as excellent electrochemical behavior, larger surface area and higher electron conductivity.17
Noble-metal nanocrystals have attracted increasing attention in recent years due to their remarkable physicochemical properties.18–20 In particular, Ag nanocrystals have been widely investigated for their interesting properties and potential applications in biomedicine, catalysis, imaging and sensing.21,22 Importantly, Ag nanocrystals can catalyze the generation of a large amount of ROSs from H2O2, improving the ECL intensity of luminol.23 For example, Lv et al. constructed a luminol ECL immunosensor for the detection of aflatoxin B1 based on the fact that Ag nanoparticles can increase the ECL intensity of luminol and thus enhance the sensitivity and lower the detection limit of the immunosensor.22 To date, different shapes of Ag nanocrystals have been synthesized, such as spheres, cubes, wires, bars, octahedrons and decahedrons.24–26 Among these, Ag nanocubes (AgNCs) have received exceptional interest. For example, Tharmaraj et al. constructed a silver nanocubes-based sensor for detecting Hg2+ ions with rhodamine 6G as an external spectroscopic probe.27
Based on the abovementioned observations, a sensitive cathodic luminol-based ECL biosensor was fabricated in this study for detecting cholesterol using three-dimensional MoS2–polyaniline (3D-MoS2–PANI) nanoflowers and AgNCs for signal enhancement. Cholesterol, as an important component in human cells and tissues, plays a vital role in the synthesis of steroid hormones, bile acids and fat-soluble vitamins. Thus, accurate and fast detection of cholesterol has attracted considerable interest. In this study, 3D-MoS2–PANI nanoflowers and AgNCs were synthesized via a hydrothermal method. The obtained 3D-MoS2–PANI–AgNCs nanocomposites with large surface area and excellent biocompatibility were used as a matrix for loading high amount of cholesterol oxidase (ChOx). Then, the loaded ChOx efficiently catalyzed the oxidation of cholesterol to produce H2O2 in situ, which could promote the oxidation of luminol to generate a cathodic ECL signal. In addition, 3D-MoS2–PANI–AgNCs nanocomposites could accelerate the decomposition of H2O2 into ROSs, which enhanced the ECL intensity and facilitated a highly sensitive detection of cholesterol.
Experimental
Reagents and chemicals
Cholesterol oxidase (ChOx, EC 1.1.3.6, ≥50 units per mg), cholesterol, Triton X-100, chitosan (Chi: MW ca. 1 × 10⁶, >85% deacetylated) and AgNO3 were purchased from Sigma (St. Louis, MO, USA). Na2MoO4·2H2O, aniline, ammonium persulfate (APS), thiourea, polyvinylpyrrolidone (PVP-30000), ethylene glycol (EG), and FeCl3 were obtained from KeLong Chemical Reagent Co. (Chengdu, China). Human serum samples were obtained from Ninth People's Hospital (Chongqing, China). Phosphate-buffered saline (PBS, containing 10% Triton X-100) solutions with various pH values were prepared using 0.050 M Na2HPO4 and 0.050 M KH2PO4 with 0.10 M KCl as a supporting electrolyte. PBS (0.050 M, pH 7.4) containing 10% (w/w) Triton X-100 was used to prepare a stock solution of cholesterol in a water bath heated at 65 °C. Other chemicals used were of analytical grade and used as received. Deionized water was used throughout the experiments.Apparatus
A CHI 600D electrochemical station (Shanghai CH Instruments Co., China) was used to carry out electrochemical impedance spectroscopy (EIS) experiments. An MPI-A model electrochemiluminescence analyzer (Xi'an Remax Electronic Science & Technology Co. Ltd, China) was used to detect ECL signals. The voltage of a photomultiplier tube (PMT) was set at 800 V and the potential scan was set in the range of −0.3 to 0.3 V throughout the detection. All the experiments were performed with a conventional three-electrode system, in which a saturated calomel electrode (SCE) or Ag/AgCl (sat. KCl) was the reference electrode, a platinum wire was the counter electrode and a modified glassy carbon electrode (GCE) was the working electrode. Raman spectra were obtained with an InVia Reflex spectrometer (Renishaw, UK). The morphology of nanocomposites was analyzed by scanning electron microscopy (SEM, S-4800, Hitachi, Japan).Preparation of PANI and 3D-MoS2–PANI nanoflowers
Polyaniline (PANI) was prepared by chemical polymerization of aniline according to the literature.28 3D-MoS2–PANI nanoflowers were fabricated via a hydrothermal method. In brief, 0.017 g PANI was dissolved in 20 mL deionized water with sonication for 20 min. Then, 0.12 g Na2MoO4·2H2O and 0.32 g thiourea were added to the PANI suspension with stirring for 20 min. The obtained suspension was sealed in a 50 mL Teflon-lined autoclave and maintained at 200 °C for 24 h. After cooling to room temperature, 3D-MoS2–PANI was gathered by centrifugation, washed several times with ethanol and deionized water, and then dried at 60 °C. The preparation process is illustrated in Scheme 1.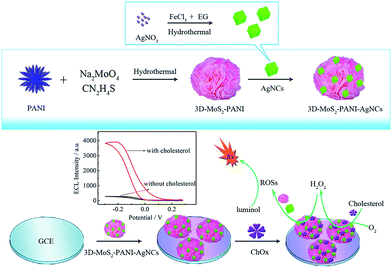 | ||
| Scheme 1 The illustration of the synthetic process of 3D-MoS2–PANI–AgNCs and the preparation of the ECL biosensor. | ||
Preparation of AgNCs and 3D-MoS2–PANI–AgNCs nanocomposites
AgNCs were synthesized by a facile one-step hydrothermal method. In brief, 0.16 g of PVP was dispersed in 22 mL EG. Subsequently, 3 mL AgNO3 (1 mM in EG) and 2.5 mL FeCl3 (0.6 mM in EG) were successively added to the PVP solution. The obtained mixture was then poured to a 50 mL Teflon-lined autoclave followed by thermal treatment at 140 °C for 1 h. AgNCs were collected by centrifugation and dispersed in 10 mL deionized water. To synthesize 3D-MoS2–PANI–AgNCs, first, 1 mL AgNCs and 3 mL 3D-MoS2–PANI (1 mg mL−1) were mixed with stirring overnight. Subsequently, 3D-MoS2–PANI–AgNCs nanocomposites were separated by centrifugation, washing and redispersion. The preparation process is illustrated in Scheme 1.Fabrication of 3D-MoS2–PANI–AgNCs modified electrode
The fabrication process of the biosensor is illustrated in Scheme 1. Prior to modification, a glassy carbon electrode (GCE, Φ = 4 mm) was polished with 0.3 μm and 0.05 μm alumina slurries and sonicated with ethanol and deionized water. After drying in air, the pre-treated GCE was first cast with 15 μL 3D-MoS2–PANI–AgNCs suspension and dried at room temperature. Subsequently, 5 μL ChOx solutions were incubated on the electrode for 8 h. The resulting cholesterol biosensor (ChOx/3D-MoS2–PANI–AgNCs/GCE) was stored at 4 °C until further use.Results and discussion
Characterization of different nanomaterials
Microstructures and morphologies of the as-prepared nanomaterials were characterized by SEM. As can be seen in the SEM image of PANI (Fig. 1A), a typical aggregated fiber nanostructure can be observed. Fig. 1B exhibits a SEM image of 3D-MoS2–PANI nanoflowers. 3D hierarchical flower-like structures are clearly observed, which demonstrates the successful preparation of 3D-MoS2–PANI nanoflowers. For AgNCs, the SEM image shows a cube-like shape with uniform particle size and shape distribution (Fig. 1C). When AgNCs were combined with 3D-MoS2–PANI nanoflowers, the resulting SEM image shows the presence of many AgNCs on 3D-MoS2–PANI nanoflowers (Fig. 1D), which indicates that 3D-MoS2–PANI–AgNCs nanocomposites were synthesized successfully.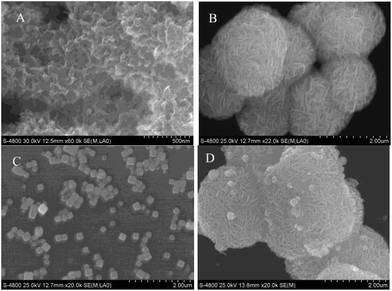 | ||
| Fig. 1 SEM images of (A) PANI, (B) 3D-MoS2–PANI, (C) AgNCs and (D) 3D-MoS2–PANI–AgNCs modified films. | ||
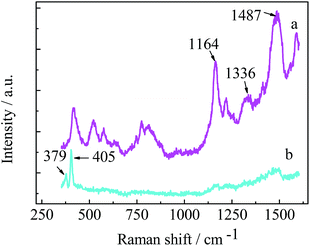
Raman scattering was measured to study the chemical bonding structure of PANI and 3D-MoS2–PANI. Fig. 2 (curve a) shows the Raman spectrum of PANI. Two characteristic Raman bands around 1487 cm−1 and 1336 cm−1 could be attributed to C![[double bond, length as m-dash]](https://www.rsc.org/images/entities/char_e001.gif) N stretching vibrations of quinonoid rings and C–N+ stretching vibrations of benzenoid rings in PANI, respectively. The characteristic peak located around 1164 cm−1 can be assigned to C–H bending of benzenoid rings.29,30 Compared with the Raman spectrum of PANI, 3D-MoS2–PANI nanoflowers exhibited two other characteristic Raman bands at 405 and 379 cm−1 (Fig. 2 curve b), which correspond to the A1g and E12g modes of MoS2 nanostructure, respectively.31,32 The abovementioned results indicate the successful synthesis of 3D-MoS2–PANI nanoflowers.
N stretching vibrations of quinonoid rings and C–N+ stretching vibrations of benzenoid rings in PANI, respectively. The characteristic peak located around 1164 cm−1 can be assigned to C–H bending of benzenoid rings.29,30 Compared with the Raman spectrum of PANI, 3D-MoS2–PANI nanoflowers exhibited two other characteristic Raman bands at 405 and 379 cm−1 (Fig. 2 curve b), which correspond to the A1g and E12g modes of MoS2 nanostructure, respectively.31,32 The abovementioned results indicate the successful synthesis of 3D-MoS2–PANI nanoflowers.
ECL and EIS characterization of stepwise fabrication of the electrode
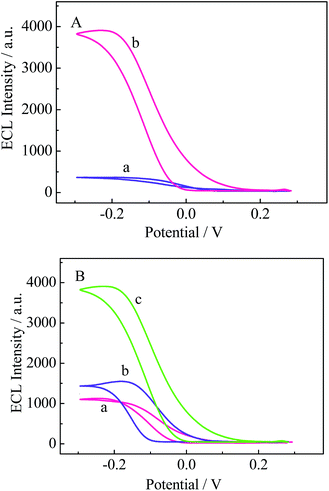
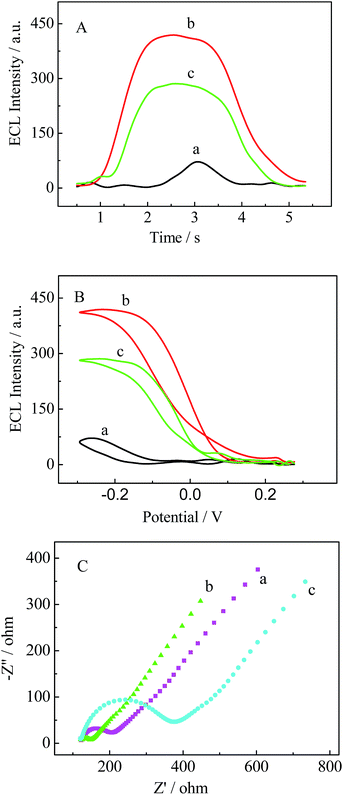
ECL investigation was performed to characterize the stepwise fabrication of the electrode in PBS (pH 7.4) containing 0.25 mM luminol. As indicated by the ECL dynamic curve (Fig. 3A) and ECL potential curve (Fig. 3B), relatively low ECL intensity appears for bare GCE (curve a). When 3D-MoS2–PANI–AgNCs was cast on the GCE, an increase in ECL intensity was observed (curve b) due to the excellent conductivity of 3D-MoS2–PANI–AgNCs. However, after ChOx was incubated on the electrode, the ECL intensity decreased (curve c), which was ascribed to inhibition by the non-conductive ChOx.To obtain a better understanding of the assembly process of the electrode, EIS was conducted in PBS (pH 7.4) containing 5.0 mM K3[Fe(CN)6]/K4[Fe(CN)6]. Fig. 3C shows typical impedance spectra, which are presented in the form of Nyquist plots. The diameter of the semicircle at higher frequencies equals the electron-transfer resistance (Ret). Compared with the bare GCE (curve a), the 3D-MoS2–PANI–AgNCs modified electrode exhibited a decrease in Ret (curve b) because 3D-MoS2–PANI–AgNCs could promote electron transfer. When ChOx was cast onto the electrode, there was an obvious increase in Ret (curve c), which indicates that ChOx could hinder electron transfer of the redox probe [Fe(CN)6]4−/3−.
Optimization of main experimental conditions
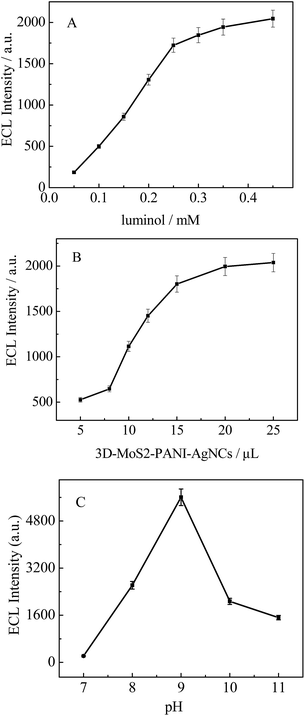
To achieve excellent performance of the prepared luminol-based ECL biosensor for the detection of cholesterol, the concentration of luminol was optimized. As shown in Fig. 4A, the ECL intensity exhibited a rapid increase with an increase in luminol concentration from 0.050 to 0.25 mM. With concentrations above 0.25 mM, only a slight enhancement in ECL intensity was observed. Therefore, 0.25 mM was selected as the optimal concentration of luminol in subsequent work.The volume of the 3D-MoS2–PANI–AgNCs suspension was investigated because it would affect the quantity of 3D-MoS2–PANI–AgNCs deposited onto the electrode. The results indicated that the ECL intensity increased with an increase in the volume of 3D-MoS2–PANI–AgNCs from 5 to 15 μL and then remained relatively stable above 15 μL (Fig. 4B). Therefore, the optimum volume of 3D-MoS2–PANI–AgNCs was 15 μL.
The effect of pH on ECL intensity was also surveyed over the pH range from 7.0 to 9.0 in PBS containing 0.25 mM luminol. As is evident from Fig. 4C, the maximum ECL intensity was obtained at pH 9.0. However, considering the normal physiological pH of the human body and the activity of ChOx, ECL detection was carried out in PBS (pH 7.4) throughout the experiments.
Probable mechanism of the biosensor
As is well known, H2O2 is an efficient coreactant for ECL reactions of luminol. In the luminol–H2O2 system, H2O2 could be catalytically converted to generate ROSs. ROSs, as important intermediates in ECL reactions of luminol, could enhance ECL signals. To investigate the ECL response of the modified electrode, first, the ECL responses of 3D-MoS2–PANI–Ag/GCE with and without ChOx were tested. As shown in Fig. 5A, relatively low ECL intensity was observed for 3D-MoS2–PANI–Ag/GCE without ChOx (curve a), whereas the ECL intensity was significantly enhanced for 3D-MoS2–PANI–AgNCs/GCE with ChOx (curve b). This may be due to the fact that ChOx, as a coreactant of luminol, catalyzed the in situ production of H2O2 from cholesterol, which could promote the oxidation of luminol to generate a cathodic ECL signal. In addition, to investigate the role of MoS2 and AgNCs as control experiments, the ECL responses of ChOx/3D-MoS2–PANI/GCE without AgNCs and ChOx/PANI–AgNCs/GCE without MoS2 were tested in 0.25 mM luminol. As observed, both ChOx/3D-MoS2–PANI/GCE (Fig. 5B curve a) and ChOx/PANI–AgNCs/GCE (Fig. 5B curve b) exhibited relatively low ECL intensities. However, as expected, high ECL intensity was obtained for ChOx/3D-MoS2–PANI–AgNCs/GCE with both MoS2 and AgNCs, as shown in Fig. 5B (curve c). This phenomenon may be attributed to the fact that both AgNCs and MoS2 could catalyze the conversion of H2O2 to generate ROSs, thus amplifying the luminol-based ECL intensity. According to previous reports and experimental results,9,10 a probable mechanism is as follows. First, ChOx deposited on the electrode catalyzed the oxidation of cholesterol to produce H2O2 and cholest-4-en-3-one. Then, MoS2 and AgNCs could catalyze the conversion of H2O2 to generate ROSs, which could react with luminol to produce excited 3-aminophthalate dianions, thus leading to an increase in ECL intensity. A mechanism for the cathodic ECL reaction of luminol is presented in Scheme 1.Performance of the biosensor
The performance of the biosensor for the detection of cholesterol was investigated under the optimized experimental conditions and the results are presented in Fig. 6A. As expected, the cathodic ECL intensity increased proportionally with the concentration of cholesterol in the range of 3.3 nM–0.45 mM and the corresponding calibration curve for cholesterol detection at −0.19 V is illustrated in Fig. 6B. The regression equation was I (a. u.) = 503.67 + 23680c (mM) (R2 = 0.9970) and the detection limit was 1.1 nM (S/N = 3). Compared with other methods of cholesterol detection (Table 1), the proposed biosensor in this study exhibited a lower detection limit, as low as 10−9 M. In addition, the prepared biosensor also displayed high sensitivity and wide dynamic response range over five orders of magnitude. These results may be due to the following facts. On the one hand, 3D-MoS2–PANI–AgNCs nanocomposites with large surface area and good biocompatibility could load more ChOx on the electrodes. On the other hand, 3D-MoS2–PANI–AgNCs nanocomposites could accelerate the decomposition of H2O2 to produce ROSs, which enhance the ECL intensity. Moreover, the cathodic luminol-based ECL exhibits high sensitivity.| Electrode material | Determination method | Linear range (mM) | Detection limit (mM) | Ref. |
|---|---|---|---|---|
| a CS–GR: chitosan–graphene, MWCNTs: multi-walled carbon nanotubes, GO: graphene oxide, Thi: thionine, Au: gold nanoparticles. | ||||
| ChOx/CS-GR/GCE | Differential pulse voltammetry | 5.0 × 10⁻³–1.0 | 7.2 × 10⁻⁴ | 33 |
| ChOx/MnO2/CT/GCE | Amperometry | 3.0 × 10⁻²–1.2 × 101 | 2.1 × 10⁻³ | 34 |
| ChOx/ZnO–CuO/ITO/glass bioelectrode | Cyclic voltammetry | 5.0 × 10⁻¹–1.2 × 101 | — | 35 |
| ChOx/MWCNTs–GO–Thi–Au/GCE | ECL | 1.5 × 10⁻⁴–8.3 × 10⁻¹ | 5.0 × 10⁻⁵ | 36 |
| ChOx/3D-MoS2–PANI–AgNCs/GCE | ECL | 3.3 × 10⁻⁶–4.5 × 10⁻¹ | 1.1 × 10⁻⁶ | This work |
Stability, reproducibility and interference determination
To evaluate the stability of the proposed biosensor, the biosensor was tested under consecutive scanning in PBS containing 0.25 mM luminol. As seen in Fig. 6C, the ECL intensity did not undergo an obvious change after successive scanning for 12 cycles and the relative standard deviation (RSD) was 2.4%. Simultaneously, long-term storage stability was also studied. The biosensor was stored at 4 °C and tested every three days in PBS containing 0.25 mM luminol. During this investigation, the response of the biosensor retained about 92.3% of the initial response after a storage period of 15 days. These results demonstrate that the proposed biosensor exhibited satisfactory stability.The reproducibility of the proposed biosensor was investigated in the following way. Five prepared biosensors were tested with the same concentration of cholesterol (0.1 mM) in the same conditions. The five biosensors displayed similar ECL responses and the RSD was 4.9%, which indicates acceptable reproducibility.
To assess the selectivity and specificity of the proposed biosensor, several possible interferents were studied such as dopamine (DA), ascorbic acid (AA) and uric acid (UA). Fig. 6D shows a comparison of the biosensor activity toward different targets. As expected, the biosensor exhibited a negligible response to DA, AA and UA, which indicates high specificity of the proposed biosensor for cholesterol detection.
Application to real samples and recovery test
The analytical reliability and potential application of the proposed biosensor were examined in human serum samples by a standard addition method. A series of serum samples were diluted with PBS. As seen in Table 2, recoveries ranged between 97.5% and 105%, which indicates that the proposed biosensor was suitable for detecting cholesterol in real biological samples.Conclusions
In conclusion, a sensitive cathodic luminol-based ECL biosensor was fabricated from 3D-MoS2–PANI nanoflowers and AgNCs for enhancement of the ECL signal. The proposed biosensor exhibited high sensitivity and low detection limit for the determination of cholesterol due to the excellent properties of 3D-MoS2–PANI nanoflowers and AgNCs. Therefore, the integration of 3D-MoS2–PANI nanoflowers and AgNCs would provide promising nanomaterials for signal amplifying applications.Acknowledgements
This study was supported by the National Natural Science Foundation of China (21075100, 21275119), Ministry of Education of China (708073), Science and Technology Commission of Beibei (2012-27), Medical Scientific Research Projects of Health Bureau of Chongqing (2012-2-286), State Key Laboratory of Electroanalytical Chemistry (SKLEAC 2010009), Specialized Research Fund for the Doctoral Program of Higher Education (swu113029), Natural Science Foundation Project of Chongqing City (CSTC-2011BA7003, CSTC-2014JCYJA20005) and Fundamental Research Funds for the Central Universities (XDJK2012A004, XDJK2013C115).Notes and references
- H. M. Chen, X. R. Tan, J. J. Zhang, Q. Y. Lu, R. Yuan and S. H. Chen, RSC Adv., 2014, 4, 61759 RSC.
- X. Wang, Z. Q. Bian, C. C. Chu, X. X. Zheng, S. G. Ge, J. H. Yu, M. Yan and X. R. Song, RSC Adv., 2014, 4, 52796 RSC.
- H. Dai, Y. Y. Lin, G. F. Xu, L. S. Gong, C. P. Yang, X. L. Ma and G. N. Chen, Electrochim. Acta, 2012, 78, 508 CrossRef CAS PubMed.
- S. F. Li, X. M. Zhang, W. X. Du, Y. H. Ni and X. W. Wei, J. Phys. Chem. C, 2009, 113, 1046 CAS.
- L. Hong, A. L. Liu, G. W. Li, W. Chen and X. H. Lin, Biosens. Bioelectron., 2013, 43, 1 CrossRef CAS PubMed.
- Z. H. Wang, Z. Y. Yan, N. Sun and Y. Liu, Biosens. Bioelectron., 2015, 68, 771 CrossRef CAS PubMed.
- W. L. Gu, X. Deng, X. X. Gu, X. F. Jia, B. H. Lou, X. W. Zhang, J. Li and E. K. Wang, Anal. Chem., 2015, 87, 1876 CrossRef CAS PubMed.
- G. X. Li, J. L. Lian, X. W. Zheng and J. Cao, Biosens. Bioelectron., 2010, 26, 643 CrossRef CAS PubMed.
- B. Haghighi, A. Tavakoli and S. Bozorgzadeh, Electrochim. Acta, 2015, 154, 259 CrossRef CAS PubMed.
- X. Y. Jiang, Y. Q. Chai, R. Yuan, Y. L. Cao, Y. F. Chen, H. J. Wang and X. X. Gan, Anal. Chim. Acta, 2013, 783, 49 CrossRef CAS PubMed.
- M. Shen, Z. P. Yan, L. Yang, P. W. Du, J. Y. Zhang and B. Xiang, Chem. Commun., 2014, 50, 15447 RSC.
- L. C. Yang, S. N. Wang, J. J. Mao, J. W. Deng, Q. S. Gao, Y. Tang and O. G. Schmidt, Adv. Mater., 2013, 25, 1180 CrossRef CAS PubMed.
- J. Chen, S. L. Li, Q. Xu and K. Tanaka, Chem. Commun., 2002, 16, 1722 RSC.
- P. Jing, H. Y. Yi, S. Y. Xue, Y. Q. Chai, R. Yuan and W. J. Xu, Anal. Chim. Acta, 2015, 853, 234 CrossRef CAS PubMed.
- Y. P. Tang, D. Q. Wu, Y. Y. Mai, H. Pan, J. Cao, C. Q. Yang, F. Zhang and X. L. Feng, Nanoscale, 2014, 6, 14679 RSC.
- T. R. Lin, L. S. Zhong, L. Q. Guo, F. F. Fu and G. N. Chen, Nanoscale, 2014, 6, 11856 RSC.
- L. R. Hu, Y. M. Ren, H. X. Yang and Q. Xu, ACS Appl. Mater. Interfaces, 2014, 6, 14644 CAS.
- S. Nandini, S. Nalini, R. Manjunatha, S. Shanmugam, J. S. Melo and G. S. Suresh, J. Electroanal. Chem., 2013, 689, 233 CrossRef CAS PubMed.
- Y. N. Xia, Y. J. Xiong, B. K. Lim and S. E. Skrabalak, Angew. Chem., Int. Ed., 2009, 48, 60 CrossRef CAS PubMed.
- S. Shanmugam, B. Viswanathan and T. K. Varadarajan, Nanoscale Res. Lett., 2007, 2, 175 CrossRef CAS.
- Y. Wang, Y. Q. Zheng, C. Z. Huang and Y. N. Xia, J. Am. Chem. Soc., 2013, 135, 1941 CrossRef CAS PubMed.
- P. Christopher and S. Linic, J. Am. Chem. Soc., 2008, 130, 11264 CrossRef CAS PubMed.
- J. Z. Guo, H. Cui, W. Zhou and W. Wang, J. Photochem. Photobiol., A, 2008, 193, 89 CrossRef CAS PubMed.
- X. H. Xia, J. Zeng, L. K. Oetjen, Q. G. Li and Y. N. Xia, J. Am. Chem. Soc., 2012, 134, 1793 CrossRef CAS PubMed.
- Y. X. Ran, W. W. He, K. Wang, S. L. Ji and C. H. Ye, Chem. Commun., 2014, 50, 14877 RSC.
- L. Zhang, Y. Zhang, Y. L. Hu, Q. L. Fan, W. J. Yang, A. R. Li, S. Z. Li, W. Huang and L. H. Wang, Chem. Commun., 2015, 51, 294 RSC.
- V. Tharmaraj and K. Pitchumani, Nanoscale, 2011, 3, 1166 RSC.
- K. J. Huang, L. Wang, Y. J. Liu, H. B. Wang, Y. M. Liu and L. L. Wang, Electrochim. Acta, 2013, 109, 587 CrossRef CAS PubMed.
- W. Chen, R. B. Rakhi and H. N. Alshareef, Nanoscale, 2013, 5, 4134 RSC.
- H. Huang, M. Y. Gan, L. Ma, L. Yu, H. F. Hu, F. F. Yang, Y. J. Li and C. Q. Ge, J. Alloys Compd., 2015, 630, 214 CrossRef CAS PubMed.
- N. T. Choudhary, J. H. Park, J. Y. Hwang and W. B. Choi, ACS Appl. Mater. Interfaces, 2014, 6, 21215 CAS.
- Q. L. Feng, K. Y. Duan, X. L. Ye, D. B. Lu, Y. L. Du and C. M. Wang, Sens. Actuators, B, 2014, 192, 1 CrossRef CAS PubMed.
- Z. J. Li, C. C. Xie, J. H. Wang, A. Meng and F. H. Zhang, Sens. Actuators, B, 2015, 208, 505 CrossRef CAS PubMed.
- C. K. Charan and V. K. Shahi, J. Appl. Electrochem., 2014, 44, 953 CrossRef CAS.
- N. Batra, M. Tomar and V. Gupta, Biosens. Bioelectron., 2015, 67, 263 CrossRef CAS PubMed.
- X. P. Wu, Y. Q. Chai, R. Yuan, X. Zhong and J. J. Zhang, Electrochim. Acta, 2014, 129, 441 CrossRef CAS PubMed.
| This journal is © The Royal Society of Chemistry 2015 |

![[thin space (1/6-em)]](https://www.rsc.org/images/entities/char_2009.gif) :
: