A mononuclear diketone-based oxido-vanadium(IV) complex: structure, DNA and BSA binding, molecular docking and anticancer activities against MCF-7, HPG-2, and HT-29 cell lines†
Maryam Mohamadiab,
S. Yousef Ebrahimipour *ab,
Masoud Torkzadeh-Mahanic,
Sabine Forod and
Alireza Akbarib
aDepartment of Chemistry, Faculty of Science, Shahid Bahonar University of Kerman, 76169-14111, Kerman, Iran. E-mail: ebrahimipour@uk.ac.ir; ebrahimipour@ymail.com; Fax: +98 34 3132 2143; Tel: +98 34 3132 2143
bDepartment of Chemistry, Payam Noor University (PNU), 19395-4697 Tehran, Iran
cDepartment of Biotechnology, Institute of Science, High Technology and Environmental Science, Graduate University of Advance Technology, Kerman, Iran
dMaterials Science Department, Alarich-Weiss-Str. 2, 64287 Darmstadt, Germany
First published on 17th November 2015
Abstract
A mononuclear oxido-vanadium(IV) complex, [VO(L)2], has been prepared from the reaction of dibenzoylmethane (HL) and VO(acac)2 in a 2![[thin space (1/6-em)]](https://www.rsc.org/images/entities/char_2009.gif) :
:![[thin space (1/6-em)]](https://www.rsc.org/images/entities/char_2009.gif) 1 molar ratio, and fully characterized using elemental analyses, molar conductivity, FT-IR, and electronic spectroscopy. The structure of this compound was also confirmed by single crystal X-ray diffraction. It was found that in the title complex, the metal coordination geometry is described as a distorted square pyramid. DNA binding activities of this complex were investigated using electronic absorption titration, competitive fluorescence titration and cyclic voltammetry studies. The obtained results showed groove binding of the complex to salmon sperm DNA accompanied with a partial insertion of the ligand between the base stacks of the DNA with a binding constant of 2.3 × 10³ M−1. In addition, the interaction of the complex with bovine serum albumin (BSA) was studied using electronic absorption and fluorescence spectroscopies at different temperatures indicating a good affinity of the complex for BSA. These experimental results were confirmed by the results of molecular docking. Finally, the in vitro cytotoxicity properties of the synthesized complex against MCF-7, HPG-2 and HT-29 cell lines were evaluated and compared with those of the ligand (HL). It was found that complexation improved the anticancer activity significantly. IC50 values for the V(IV) complex against MCF-7, HPG-2 and HT-29 cell lines were obtained as 7.8, 13.5 and 16.1 μM, respectively.
1 molar ratio, and fully characterized using elemental analyses, molar conductivity, FT-IR, and electronic spectroscopy. The structure of this compound was also confirmed by single crystal X-ray diffraction. It was found that in the title complex, the metal coordination geometry is described as a distorted square pyramid. DNA binding activities of this complex were investigated using electronic absorption titration, competitive fluorescence titration and cyclic voltammetry studies. The obtained results showed groove binding of the complex to salmon sperm DNA accompanied with a partial insertion of the ligand between the base stacks of the DNA with a binding constant of 2.3 × 10³ M−1. In addition, the interaction of the complex with bovine serum albumin (BSA) was studied using electronic absorption and fluorescence spectroscopies at different temperatures indicating a good affinity of the complex for BSA. These experimental results were confirmed by the results of molecular docking. Finally, the in vitro cytotoxicity properties of the synthesized complex against MCF-7, HPG-2 and HT-29 cell lines were evaluated and compared with those of the ligand (HL). It was found that complexation improved the anticancer activity significantly. IC50 values for the V(IV) complex against MCF-7, HPG-2 and HT-29 cell lines were obtained as 7.8, 13.5 and 16.1 μM, respectively.
Introduction
Vanadium is biocompatible and has a wide variety of biochemical and physiological functions.1 Transition metal complexes containing vanadium(IV) have been shown to modulate the cellular redox potential and catalyze the generation of reactive oxygen intermediates (ROI) resulting in the regulation of enzymatic phosphorylation, and exertion of pleiotrophic effects in multiple biological systems.2–4It has been reported that some oxido-vanadium complexes exhibit potent anti-HIV properties.5,6 Moreover, both inorganic salts and organic chelates of VO2+ have been found to be able to participate in glucose uptake and metabolism due to their insulin-mimetic effects.7
Moreover, since vanadium has the ability to assume various oxidation states, the coordination chemistry of this metal is versatile in biological systems and allows its interaction with different biomolecules.8 For example, the presence of vanadium species in several proteins including bromoperoxidase and nitrogenase is essential for their catalytic activities9–11 or as another example, the insulin-like properties of VO2+ chelates has been found to be dependent on the binding of these compounds to BSA and possibly other serum transport proteins.12
Serum albumin is the most abundant protein in plasma with multiple functions. This protein has the ability to bind reversibly to a large number of compounds so that it is known as the principal carrier of fatty acids, metabolic products, regulatory mediators, and nutrients.13–15 In addition, serum albumin neutralizes endogenous or exogenous toxins after interaction with them by means of hydrogen bonding,16 hydrophobic, electrostatic, and metal interactions.17
Vanadium ion was used earlier as an antitumor agent.18 It has been observed that oxovanadium(IV) complexes show striking similarities to the well-known anticancer drug, cis-platin and exhibit anticancer activities.19 Both V(IV) complexes and cis-platin are toxic to cells due to their interactions with nuclear DNA. However, the mechanisms of these interactions are different from each other. cis-Platin binds covalently to DNA which makes it a potential mutagen. Unlike cis-platin, vanadium complexes interact with nucleotide phosphate groups and do not disturb the Watson-Crick hydrogen bonding.20 Accordingly vanadium complexes are potential alternatives to platinum-based chemotherapy with limited success due to both intrinsic and acquired drug resistance.21 The chemistry and biology of vanadium compounds in cancer therapeutics have been recently reviewed by Kioseoglou's group.22
β-Diketones possess different interesting properties such as antioxidant, anti-leukemia, antimicrobial and anticancer activities.23 Also, they have hepatoprotective and nephroprotective activities, suppress thrombosis, protect against myocardial infarction and have hypoglycemic and antirheumatic properties.24 β-Diketones have been used as chelating agent to synthesize various metal complexes.25
Generally, molecules which interact with DNA affect DNA replication and transcription and ultimately, induce cell death and apoptosis.26 So, study of the interaction mode and mechanism of such compounds is of importance which helps us to provide new and even more efficient anticancer drugs. Two broad classes of non-covalent DNA-binding agents have been identified: the intercalators and the groove binders. The intercalators bind by inserting a planar aromatic chromophore between adjacent DNA base pairs, whereas the groove binders fit into the DNA minor groove causing a little perturbation of the DNA structure.27
According to the above consideration, we used dibenzoylmethane as chelating agent to synthesize a diketone-base oxido-vanadium(IV) complex. The synthesized complex was fully characterized using spectroscopic and physicochemical methods. Experimental and molecular modeling investigations were also performed to determine the mode and mechanism of the interaction between the complex and DNA and BSA. Moreover, cytotoxicity of the V(IV) complex against MCF-7, HPG-2 and HT-29 cancerous cell lines were studied using MTT assays.
Results and discussion
A square pyramidal V(IV) complex was prepared by the reaction of dibenzoylmethane and VO(acac)2 in 2![[thin space (1/6-em)]](https://www.rsc.org/images/entities/char_2009.gif) :
:![[thin space (1/6-em)]](https://www.rsc.org/images/entities/char_2009.gif) 1 molar ratio. The obtained complex was stable in air and soluble in DMSO, DMF and has less solubility in methanol, chloroform and acetonitrile. It was insoluble in n-hexane and diethyl ether. Molar conductivity value of title complex was equal to 3.2 ohm−1 cm2 mol−1 in DMSO, indicating non-electrolyte behaviors of it. The stability of the complex in PBS buffer was investigated using UV absorption spectroscopy (Fig. S1†). No considerable change was observed in the spectrum of the complex during 2 h indicating the stability of [VO(L)2] in aqueous solution.
1 molar ratio. The obtained complex was stable in air and soluble in DMSO, DMF and has less solubility in methanol, chloroform and acetonitrile. It was insoluble in n-hexane and diethyl ether. Molar conductivity value of title complex was equal to 3.2 ohm−1 cm2 mol−1 in DMSO, indicating non-electrolyte behaviors of it. The stability of the complex in PBS buffer was investigated using UV absorption spectroscopy (Fig. S1†). No considerable change was observed in the spectrum of the complex during 2 h indicating the stability of [VO(L)2] in aqueous solution.
Spectral characterization
Assignments of selected prominent IR bands in the 400–4000 cm−1 region for [VO(L)2] are listed in the Experimental section. In the FT-IR spectrum of this compound (Fig. S2†), the band with high intensity at 1590 cm−1 ascribed to the carbonyl (C![[double bond, length as m-dash]](https://www.rsc.org/images/entities/char_e001.gif) O) vibration.28 The band appeared at 1480 cm−1 is correlated to C
O) vibration.28 The band appeared at 1480 cm−1 is correlated to C![[double bond, length as m-dash]](https://www.rsc.org/images/entities/char_e001.gif) C vibration.29 The stretching vibration of CO appears at 1318 cm−1. The characteristic band of V
C vibration.29 The stretching vibration of CO appears at 1318 cm−1. The characteristic band of V![[double bond, length as m-dash]](https://www.rsc.org/images/entities/char_e001.gif) O is located at 994 cm−1.30,31 The band with medium intensity appeared at 583 cm−1 is assigned to V–O vibrations.32
O is located at 994 cm−1.30,31 The band with medium intensity appeared at 583 cm−1 is assigned to V–O vibrations.32
The electronic spectra of the title complex were recorded in the DMSO (Fig. S3†) and showed two intense peaks at 269 and 368 nm. The first band is attributed to a π → π* transition of aromatic rings and the latter might arise from ligand to metal charge transfer (LMCT) O(p) → V(d) transitions.33 Finally, the lower energy absorption band at 659 nm is related to d–d transition. This band is due to 2B2 → 2E transition indicating the square pyramidal geometry of an oxido-vanadium(IV) chromophore.
X-ray crystal structure
The ORTEP diagram of [VO(L)2] is presented in Fig. 1. Also, the selected bond length and angles are listed in Table 1. The X-ray analysis shows that this complex has been crystallized in a monoclinic space group P21/n with a Z value of 4. In this structure, V(IV) ion is coordinated by oxygen atoms of two monoanionic 1,3-diphenyl-1,3-propanedionato while, the fifth position is occupied by an oxo group. Five-coordinated complexes may have two main geometries of trigonal bipyramidal (TBP) or square pyramidal (SP). Trigonality index (τ) used for determining the geometry of these compounds, is defined as (β − α)/60 where β and α are two largest bond angles around the metal center in the coordination environment.34 In an ideal square pyramid β and α equal to 180° and so, τ = 0. While, an ideal trigonal-bipyramidal structure has β = 180° and α = 120° resulting in τ = 1. The trigonality index for the complex synthesized here is calculated to be 0.055 indicating SP geometry for this complex. As can be seen from packing diagram (Fig. S4†), the only parameter that stabilizes the lattice structure is van der Waals interaction and no hydrogen bond exists in this compound.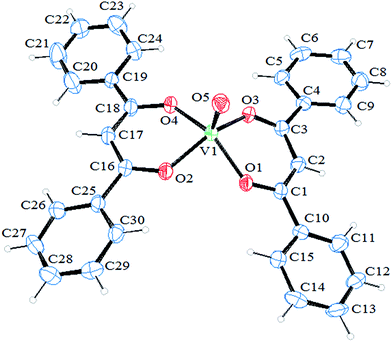 | ||
| Fig. 1 ORTEP drawing of [VO(L)2] with the atom numbering. Thermal ellipsoids are shown at the 30% probability level. | ||
| C(1)–O(1) | 1.270(7) | O(1)–V(1) | 1.956(4) |
| C(3)–O(3) | 1.257(7) | O(2)–V(1) | 1.960(4) |
| C(16)–O(2) | 1.296(7) | O(3)–V(1) | 1.969(4) |
| C(18)–O(4) | 1.297(7) | O(4)–V(1) | 1.961(4) |
| O(5)–V(1) | 1.579(4) | ||
| C(1)–O(1)–V(1) | 130.8(4) | O(1)–V(1)–O(2) | 83.72(16) |
| C(16)–O(2)–V(1) | 130.0(4) | O(5)–V(1)–O(4) | 107.8(2) |
| C(3)–O(3)–V(1) | 130.9(4) | O(1)–V(1)–O(4) | 144.59(18) |
| C(18)–O(4)–V(1) | 130.8(4) | O(2)–V(1)–O(4) | 86.66(16) |
| O(5)–V(1)–O(1) | 107.6(2) | O(5)–V(1)–O(3) | 105.9(2) |
| O(5)–V(1)–O(2) | 106.2(2) | O(1)–V(1)–O(3) | 86.78(16) |
| O(2)–V(1)–O(3) | 147.90(18) | O(4)–V(1)–O(3) | 83.54(17) |
Titration of DNA with the complex
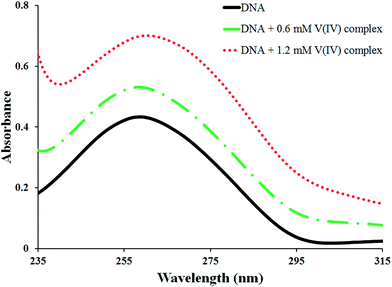
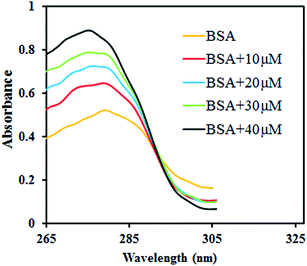
The UV spectra of DNA solution recorded upon addition varying concentrations of the complex are given in Fig. 2. A strong absorption band at 259 nm is observed in the spectrum of the DNA corresponding to purine and pyrimidine bases of DNA.35 It is clear that the intensity of the absorption band of DNA has increased (ca. 62%) with gradual addition of the complex up to [DNA]/[complex] = 0.5. This hyperchromisity is due to the fact that the purine and pyrimidine bases of DNA are exposed because of the binding of the complex to DNA. This observation exhibits that the interaction between the complex and the DNA may have caused a slight change in the conformation of the DNA.36 So, a DNA intercalating interaction of the complex through the stacking interaction of the aromatic rings of the ligand and the base pairs of DNA is proposed.37 However, no significant shift is observed in the λmax of the DNA peak which can be due to partial intercalation.Titration of the complex with DNA
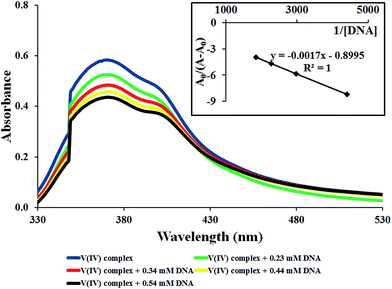
The ligand-based transition at 370 nm was used for the electronic absorption titration with the DNA. Any interaction between the complex and DNA can perturb the intraligand-centered spectral transitions. As seen in Fig. 3, the absorption band of the complex showed a hypochromism of 25.3% upon addition of DNA up to [complex]/[DNA] = 0.083 without any significant shift in λmax. Generally, significant hypochromism accompanied by a red shift (bathochromism) is known to be a characteristic of the strong π–π stacking interaction between the aromatic chromophore ligand of a metal complex and the aromatic rings of DNA bases which is called intercalation interaction. Coupling of π orbitals which are also partially filled by electrons reduces the transition probability and thus results in hypochromism.38,39 On the other hand, hypochromism that is manifested in terms of a small decline in absorbance and either no or only minor changes in λmax has been correlated to groove binding.40 Accordingly, it can be suggested that [VO(L)2] complex interacts with the DNA through the partial insertion of the aromatic rings of the ligand to the DNA duplex and it is also likely that the complex can bind to the DNA helix via a groove mode.40 It has been demonstrated that the structure of the complex is one of the most important factors contributing to the DNA binding affinity. However, some factors of ligand including size, geometry, hydrophobicity and hydrogen-bonding ability also influence the overall affinity.41 As can be seen from Fig. 1, the intercalation of the complex is very difficult because the ligands are not nearly so planar.Binding constant (Kb) is a useful parameter to evaluate the binding strength of the complex to the DNA and can be determined from the variation in the electronic spectra before and after the addition of DNA by applying Benesi–Hildebrand equation42,43 (eqn (1)) given below:
 | (1) |
Competitive binding experiments in the presence of ethidium bromide
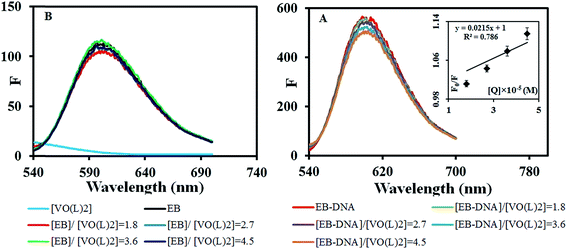
EB, a cationic conjugated planar molecule, is a well-known DNA intercalator. The fluorescence intensity of EB is usually weak. However, it increases upon the interaction with DNA. So, EB is employed as a probe for the spectroscopic study of the interaction between dsDNA and potent intercalating species because of 24-fold decrease in its fluorescence when displaced from an intercalation site.45 To examine whether the vanadium complex can displace EB from the DNA helix, we have investigated the fluorescence spectra of EB-DNA adduct in the presence of varying amounts of the complex (0–45 μM). The results obtained are shown in Fig. 4. As can be seen, the fluorescence intensity of DNA-EB adduct reduces upon addition of the complexes and this effect increases with increasing the concentration of the complex. This quenching indicates that the complex can drive out EB and take its place in the DNA double helix.Two control experiments were additionally performed; the emission spectrum of the complex alone, EB alone and EB mixed with the complex at the same ratios as the above experiment. The obtained results depicted in Fig. 4B, showed that the complex had no significant fluorescence contribution in the spectrum of EB. Also, no considerable quenching was observed from the interaction of the complex with non-intercalated EB. Accordingly, the quenching of the fluorescence of EB-DNA system by the complex was due to the interaction of the complex with DNA not EB.
The quenching of EB bound to DNA provoked by the compound is in good agreement (R2 = 0.786) with the linear Stern–Volmer equation (eqn (2)):
 | (2) |
Electrochemical characterization of the interaction between DNA and the complex
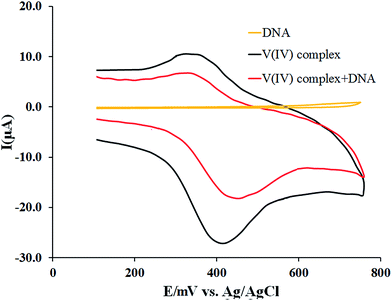
The interaction of the complex with DNA has been also investigated by monitoring the changes observed in the cyclic voltammogram of the complex in 0.02 M PBS upon addition of the DNA. The obtained results are depicted in Fig. 5. The cyclic voltammogram of the complex exhibits a quasi-reversible single electron redox process assignable to the V(VI)/V(V) couple. [VO(L)2] is oxidized to the mono cation [VO(L)2]+.46 The electron is removed from nonbonding orbitals and the V(V) complex is formed. Upon reversal of the scan direction, the V(V) complex is reduced to V(IV).47The cathodic and anodic peak potentials appear at Epc = +0.40 V and Epa = +0.32 V with Ipc = −7.8 μA and Ipa = 4.2 μA, respectively. Also, CV of 60 μM DNA in PBS was recorded at the same conditions. As seen, no peak was observed in the scanned potential range. In the presence of 60 μM DNA, Epc shifted to +0.45 V while Epa showed no considerable change. Also, both the cathodic and anodic peak currents decreased to −6.1 μA and +1.8 μA, respectively due to the reduced diffusion rate of the complex towards the electrode surface as a result of the interaction with the bulky, slowly diffusing DNA.
Peak separation (ΔEp) and half-wave potential (E01/2) are defined as the difference and the average of Epa and Epc, respectively. Using the changes made in the values of ΔEp and E01/2 after addition of DNA, one can explain the ability of the interaction. It was observed that addition of the DNA increased ΔEp from 0.08 to 0.13 V and E01/2 from 0.36 V to 0.385 V. It has been reported that an intercalative binding mode between molecules and DNA causes a positive shift in the half-wave potential while an electrostatic binding mode results in a negative shift.48
According to the results obtained, the increase of the formal potentials of the complexes accompanied by the decrease of the peak currents observed in the presence of the DNA suggests that the complex has interacted with the DNA in an intercalative mode.
BSA interaction
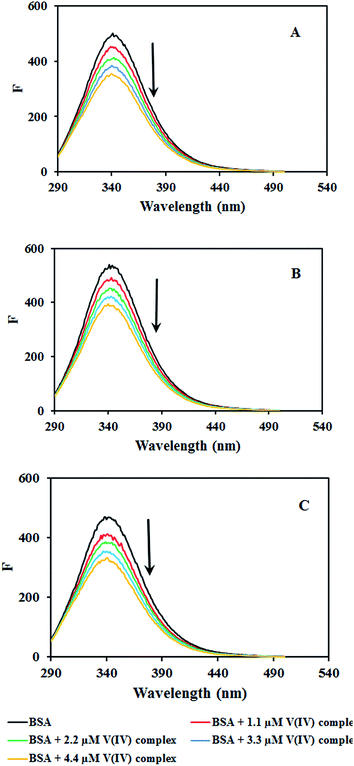 | ||
| Fig. 7 Fluorescence emission spectra of BSA in the absence and presence of increasing amounts of [VO(L)2] at (a) 291, (b) 298 and (c) 305 K. | ||
The possible quenching mechanism can be interpreted using eqn (2).54 Taking the fluorescence lifetime (τ0) of tryptophan at 10−8 s, the approximate quenching constant (Kq) of the complex is calculated. Fig. S5† reveals the plots of F0/F vs. the concentration of the complex, [Q] at different temperatures. The values of KSV and Kq obtained from the ratio of the slope to the intercept of the plot are given in Table 2. The values of KSV are of 4 magnitude order indicating a moderate quenching.
 | (3) |
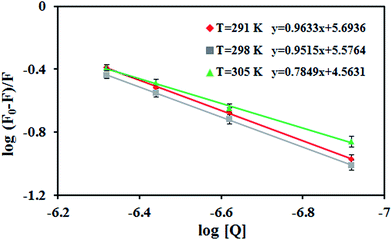
 versus log[Q] for the binding of V(IV) complex to BSA at different temperatures. From the intercept and slope of the plot, Kb and n values can be calculated. The values of Kb and n obtained for BSA–V(IV) complex adduct are given in Table 2. As seen, Kb value decreases with increasing temperature indicating the binding process is exothermic.53,56
In general, the binding constant of a compound to a protein such as albumin should be high enough to allow transfer by the protein and on the other hand, not too high so that it can be released upon arrival at its target(s). A strong interaction between protein and a typical complex has been reported to have a binding constant ranging from 106 to 108 M−1.57 Accordingly, the values of Kb obtained here for BSA-[VO(L)2] system are considered a moderate binding affinity. The value of n is nearly 1 at 298 and 291 K suggesting that the complex bond to BSA according to the molar ratio of 1![[thin space (1/6-em)]](https://www.rsc.org/images/entities/char_2009.gif) :
:![[thin space (1/6-em)]](https://www.rsc.org/images/entities/char_2009.gif) 1. But at 305 K, n value decreases which is consistent to the exothermic nature of the interaction.
1. But at 305 K, n value decreases which is consistent to the exothermic nature of the interaction.
The values of ΔH and ΔS can be obtained from the van't Hoff equation (eqn (4)):
 | (4) |
![[thin space (1/6-em)]](https://www.rsc.org/images/entities/char_2009.gif) Kb vs. 1/T.
Kb vs. 1/T.
Fig. S6† shows the van't Hoff plot for the V(IV) complex-BSA system which is a straight line. From the slope and intercept of this plot, ΔH and ΔS are calculated, respectively which are given in Table 3. In addition, the values of ΔG at different temperatures calculated according to eqn (5) are shown in Table 3.
| ΔG = ΔH − TΔS | (5) |
| T (K) | ΔG (kJ mol−1) | ΔH (kJ mol−1) | ΔS (J mol−1 K−1) | R2 |
|---|---|---|---|---|
| 291 | −31.6 | −132.4 | −345.4 | 0.9802 |
| 298 | −29.2 | |||
| 305 | −26.8 |
The negative values of ΔG reveal that the binding process is spontaneous and also the values of ΔH with negative signs are much greater than TΔS values indicating that BSA-V(IV) complex formation is mainly enthalpy-driven reaction. Moreover, both negative ΔH and ΔS values indicate that van der Waals force or hydrogen bond interaction plays major role in the interaction between BSA and the complex.
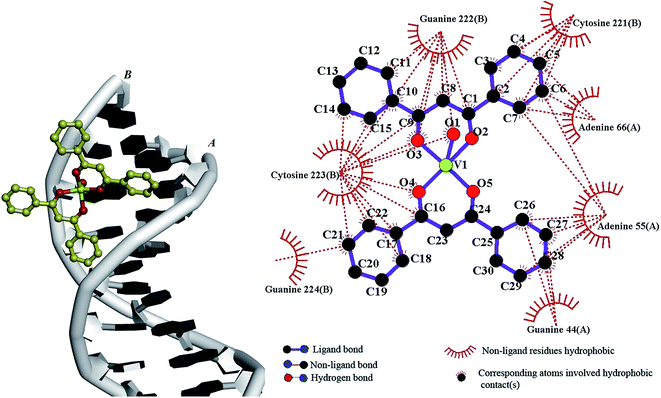
A: 5′(C11, G22, C33, G44, A55, A66, T77, T88, C99, G110, C11, G112)3′
B: 3′(G224, C223, G222, C221, T220, T119, A118, A117, G116, C115, G114, C113)5′
The grid map set to 50 × 54 × 116 Å3 along the x, y, and z axes with 0.375 Å grid spacing. The conformations obtained were ranked based on the lowest free binding energy. According to the most stable docking conformation (Fig. 9), the V(IV) complex inserted into the minor groove of the DNA duplex with a partial intercalation. As Fig. 9 indicates, several categories of hydrophobic contacts are observed between the complex atoms and the bases of DNA, including, guanine 224, cytosine 223, guanine 222 and cytosine 221 (chain B), adenine 66, adenine 55 and guanine 44 in chain A. The resulting relative binding energy for the complex docked with DNA was found to be −4.48 kcal mol−1.
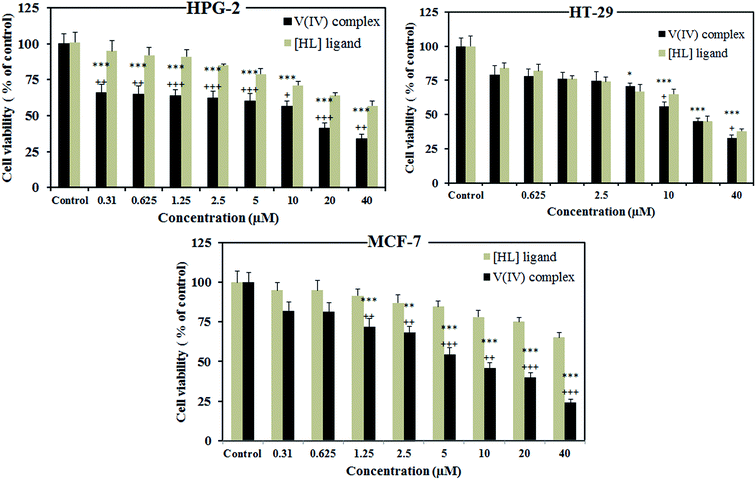
Similarly against HPG-2, the complex is much more toxic than the free ligand especially at lower concentrations. Surprisingly, no preference is observed between the activity of the ligand and the complex against HT-29. This indicates that the sensitivity of HT-29 cells to the ligand is similar to the complex. Moreover, at the concentrations of 0.31, 0.62, 1.25 and 2.5 μM the viability of HPG-2 cells is influenced by the complex more than two other cell lines. While, at higher concentrations of the complex this is MCF-7 which shows the lowest viability. It is worth mentioning that, the side effect of the compound at high concentrations should be also considered.
Furthermore, IC50 values for the complex against MCF-7, HPG-2 and HT-29 cell lines were calculated to be 7.8, 13.5 and 16.1 μM, respectively which are smaller than those reported for the well-known anticancer drug, cis-platin (22.8, 16.7 and 69.4 μM, respectively)59 and smaller than or comparable with other vanadium complexes (>50 μM against MCF-7 for [VO(sal-Gly)(bipy)], [VO(sal-Gly)(phen)], [VO(sal-L-Phe)(H2O)], [VO(sal-L-Phe)(bipy)] and [VO(sal-L-Phe)(phen)],60 >47 μM against HT-29 for [VO(sal-L-tryp)(acetylethTSC)]·C2H5OH, [VO(sal-L-tryp)(MeATSC)] and [VO(salL-tryp)(N-ethhymethohcarbthio)]·H2O59b and 1486 μg cm−3 against HPG-2 for V(2-[(4 morpholinophenyl imino)methyl]phenol)2.61 However, some more effective vanadium complexes have been previously synthesized. For example, bis(4,7-dimethyl-1,10-phenanthroline)sulfatooxovanadium(IV) with IC50 values smaller than 1 μM.62
Experimental
Materials and methods
Salmon sperm DNA was purchased from Sigma (St. Louis, USA). A 1.0 mg mL−1 stock solution of the DNA was prepared in TE buffer (pH 7.4) and kept frozen. The concentration of the solution was determined using the molar extinction coefficient of DNA bases at 260 nm (ε260) which was found to be 6600 L mol−1 cm−1 (per P or nucleotide unit). Ethidium bromide (EB = 3,8-diamino-5-ethyl-6-phenylphenanthridinium bromide) was purchased from CinnaGen (Iran). Bovine serum albumin (BSA) was obtained from Merck (Germany). 3-(4,5-Dimethyl-2-thiozolyl)-2,5-diphenyl-2H-tetrazolium bromide (MTT) was purchased from Sigma.Instrumentation
Elemental analyses were carried out using a Thermo Finnigan Flash Elemental Analyzer 1112EA. FT-IR spectra were recorded at a Bruker-Tensor 27 by embedding the material in KBr discs in the range of 400–4000 cm−1. Molar conductance measurements were made by means of a Metrohm 712 Conductometer in DMSO. Cyclic voltammograms were obtained using an Autolab PGSTAT 302 electrochemical system from Metrohm (Herisau, Switzerland) interfaced with a personal computer for data acquisition and potential control. Electronic spectra were recorded on a double beam UV-vis-NIR Varian Cary 500 spectrophotometer (Victoria, Australia). Fluorescence measurements were performed on a Cary Eclipse fluorescence spectrophotometer.Synthesis of bis(1,3-diphenyl-1,3-propanedionato)-oxido-vanadium(IV) [VO(L)2]
A mixture of dibenzoylmethane (0.045 g, 0.2 mmol) and VO(acac)2 (0.03 g, 0.1 mmol) was refluxed in 10 mL ethanol. After 1 h, the resulted deep green precipitate was filtered, washed with cold ethanol and dried in vacuum over anhydrous CaCl2. Suitable crystals for X-ray crystallography were obtained after slow evaporation of the mother liquor for 1 day at room temperature.Yield: 0.04 g, 78%. m.p.: 201 °C. Molar conductance (1 × 10⁻³ M, DMSO): 3.2 ohm−1 cm2 mol−1. Anal. calc. for C30H22O5V (513.43 g mol−1): C, 70.18; H, 4.32; N, 15.58. Found: C, 70.03; H, 4.25; N, 15.43% FT-IR (KBr), cm−1: ν(CHar) 2842–3057, ν(C![[double bond, length as m-dash]](https://www.rsc.org/images/entities/char_e001.gif) O) 1590, ν(C
O) 1590, ν(C![[double bond, length as m-dash]](https://www.rsc.org/images/entities/char_e001.gif) Cring) 1480, ν(C–O) 1318, ν(V
Cring) 1480, ν(C–O) 1318, ν(V![[double bond, length as m-dash]](https://www.rsc.org/images/entities/char_e001.gif) O) 994, ν(V–O) 583. UV/Vis (DMSO), λmax, nm (log(ε), L mol−1 cm−1): 269(4.49), 368(4.52), 659(3.12).
O) 994, ν(V–O) 583. UV/Vis (DMSO), λmax, nm (log(ε), L mol−1 cm−1): 269(4.49), 368(4.52), 659(3.12).
Crystal structure determination
X-ray diffraction data were collected using an XCalibur diffractometer, Oxford Diffraction Ltd., with sapphire CCD detector in ω-scan mode. Graphite monochromated Mo Kα radiation (λ = 0.71013 Å) has been used. The structure was solved using direct methods with SHELXS-97 and refined on F2 with full-matrix least squares using SHELXS-97.63 The H atoms were positioned with idealized geometry using a riding model with the aromatic C–H distance restrained to 0.93 Å and were refined with isotropic displacement parameters set at 1.2Ueq (C-aromatic) of the parent atom. The crystallographic data for X-ray analysis of title complex is gathered in Table 4.| Empirical formula | C30H22O5V |
| Formula weight | 513.42 |
| Temperature | 293(2) K |
| Wavelength | 0.71073 Å |
| Crystal system | Monoclinic |
| Space group | P21/n |
| Unit cell dimensions | a = 12.7159(9) Å |
| b = 15.199(1) Å | |
| c = 12.9016(9) Å | |
| α = γ = 90° | |
| β = 96.743(4) | |
| Volume | 2476.2(3) Å3 |
| Z | 4 |
| Density (calculated) | 1.377 Mg m−3 |
| Absorption coefficient | 0.440 mm−1 |
| F(000) | 1060 |
| Crystal size | 0.18 × 0.08 × 0.06 mm |
| Theta range for data collection | 3.12 to 25.19° |
| Index ranges | −14 ≤ h ≤ 15 |
| −17 ≤ k ≤ 18 | |
| −15 ≤ l ≤ 15 | |
| Reflections collected/unique | 9435/4443 [R(int) = 0.0591] |
| Data completeness | 0.997 |
| Absorption correction | Semi-empirical from equivalents |
| Max. and min. transmission | 0.9741 and 0.9251 |
| Refinement method | Full-matrix least-squares on F2 |
| Data/restraints/parameters | 4443/19/325 |
| Goodness-of-fit on F2 | 1.049 |
| Final R indices [I > 2σ(I)] | R1 = 0.0857 |
| wR2 = 0.1951 | |
| R indices (all data) | R1 = 0.1894 |
| wR2 = 0.2386 | |
| Largest diff. peak and hole | 0.547 and −0.247e Å−3 |
DNA binding studies
All experiments were carried out at room temperature. In all experiments, the incubation time for the DNA and the complexes to equilibrate was 5 min.
Competitive fluorescence study with DNA-EB adduct
Competitive studies of the [VO(L)2] compound with EB study was investigated by fluorescence emission spectroscopy in order to examine whether it is able to displace EB from DNA-EB adduct. In this study, a 0.02 M PBS solution (pH = 7.4) containing 1.0 × 10⁻⁵ M EB and 7.5 × 10⁻⁵ M DNA was titrated with the complex. During the fluorescence quenching experiment, emission spectra of DNA-EB adduct were recorded in the range of 535–700 nm upon excitation at 525 nm.Cyclic voltammetric measurements
Electrochemical techniques can be employed to study the interaction of electro-active complexes with DNA in order to confirm the binding mode suggested by the spectroscopic studies. Cyclic voltammograms of the V(IV) complex were recorded before and after the addition of DNA to a fixed concentration of the complex in 0.02 M PBS at the scan rate of 100 mV s−1.BSA binding studies
The cells were placed in 96-well micro-assay culture plates at a density of 5 × 10³ cells per well and grown at 37 °C in a humidified 5% CO2 incubator for 24 h. Then the cells were treated with varying concentrations (0.31, 0.62, 1.25, 2.5, 5, 10, 20 and 40 μM) of the complex and ligand for 24 h. After that, 20 μl of MTT solution was added to each plate and incubation was performed at 37 °C for 4 h. The metabolically active cells reduced MTT to blue formazan crystals. The crystals formed were then solubilized upon addition of DMSO and incubated at room temperature for 20 min. Finally, the absorbance (A) of the solution of each well was measured with ELISA reader at 545 nm. The absorbance was converted to percentage of cell growth inhibition according to the following formula:
| % cell cytotoxicity = [1 − (Adrug/Acontrol)] × 100 |
The values of IC50 defined as the concentrations of test compound required to reduce the survival of cells by 50%, were also calculated.
Conclusions
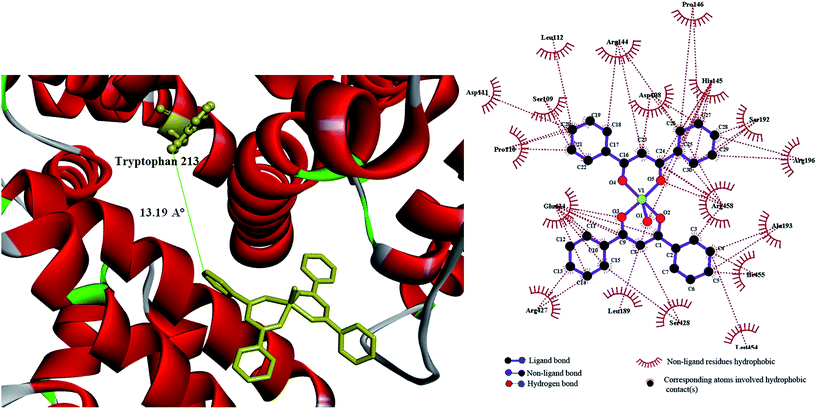
An oxido-vanadium(IV) complex [VO(L)2], containing dibenzoylmethane ligand has been synthesized and fully characterized using various physicochemical and spectroscopic methods including single crystal X-ray diffraction. The central vanadium(IV) ion is situated in a distorted square pyramidal environment (O5 chromophore). The square plane is made up of donor oxygen atoms of 1,3-diphenyl-1,3-propanedionato (L−). The oxido group occupies the axial position. DNA binding activities of this complex have been investigated with electronic absorption, competitive fluorescence titration and cyclic voltammetry techniques. The obtained results have suggested a groove binding mode of interaction accompanied with a partial intercalation into the DNA helix with the DNA-binding constant in order of 103 M−1. Study of the interaction between the title complex and BSA indicates a good binding propensity to BSA. So, this protein can be a suitable carrier for the complex. The results of molecular docking reveal that the complex fits into the minor groove of DNA along with partial intercalation and prefers the binding pocket in domain II of BSA which are in good agreement with those of experimental studies. Anticancer activities of [VO(L)2] against three carcinoma cell lines of MCF-7, HPG-2 and HT-29 have been investigated using MTT assay. The values of IC50 (7.8, 13.5 and 16.1 μM for MCF-7, HPG-2 and HT-29, respectively) indicate that [VO(L)2] synthesized here, can be proposed as an efficient metal-based anticancer drug. However, further considerations including in vivo studies should be performed to fully evaluate the cell toxicity of the synthesized complex.Acknowledgements
We are grateful to Shahid Bahonar University of Kerman for financial support and Prof. W. Haase for helping us to determine X-ray crystal structure of the synthesized complex.References
- H. Michibata, Vanadium: Biochemical and Molecular Biological Approaches, Springer, Netherlands, 2011 Search PubMed.
- J. Z. Byczkowski, B. Wan and A. P. Kulkarni, Bull. Environ. Contam. Toxicol., 1988, 41, 696–703 CrossRef CAS PubMed.
- O. J. D'Cruz, P. Ghosh and F. M. Uckun, Mol. Hum. Reprod., 1998, 4, 683–693 CrossRef.
- X. Shi, P. Wang, H. Jiang, Y. Mao, N. Ahmed and N. Dalal, Ann. Clin. Lab. Sci., 1996, 26, 39–49 CAS.
- O. J. D’Cruz, Y. Dong and F. M. Uckun, Biochem. Biophys. Res. Commun., 2003, 302, 253–264 CrossRef.
- S. Shigeta, S. Mori, E. Kodama, J. Kodama, K. Takahashi and T. Yamase, Antiviral Res., 2003, 58, 265–271 CrossRef CAS PubMed.
- D. Rehder, Dalton Trans., 2013, 42, 11749–11761 RSC.
- E. G. Ferrer, A. Bosch, O. Yantorno and E. J. Baran, Bioorg. Med. Chem., 2008, 16, 3878–3886 CrossRef CAS PubMed.
- D. C. Crans, J. J. Smee, E. Gaidamauskas and L. Yang, Chem. Rev., 2004, 104, 849–902 CrossRef CAS PubMed.
- C. Leblanc, H. Vilter, J.-B. Fournier, L. Delage, P. Potin, E. Rebuffet, G. Michel, P. Solari, M. Feiters and M. Czjzek, Coord. Chem. Rev., 2015, 301–302, 134–146 CrossRef CAS.
- Y. Hu and M. W. Ribbe, J. Biol. Inorg. Chem., 2015, 20, 435–445 CrossRef CAS PubMed.
- M. W. Makinen and M. J. Brady, J. Biol. Chem., 2002, 277, 12215–12220 CrossRef CAS PubMed.
- M. Nonaka, E. Li-Chan and S. Nakai, J. Agric. Food Chem., 1993, 41, 1176–1181 CrossRef CAS.
- M. M. Yamashita, L. Wesson, G. Eisenman and D. Eisenberg, Proc. Natl. Acad. Sci. U. S. A., 1990, 87, 5648–5652 CrossRef CAS.
- W. Bal, J. Christodoulou, P. J. Sadler and A. Tucker, J. Inorg. Biochem., 1998, 70, 33–39 CrossRef CAS PubMed.
- H. M. Rawel, S. Rohn, H.-P. Kruse and J. Kroll, Food Chem., 2002, 78, 443–455 CrossRef CAS.
- Y. Zhang and D. E. Wilcox, J. Biol. Inorg. Chem., 2002, 7, 327–337 CrossRef CAS PubMed.
- (a) A. M. Evangelou, Crit. Rev. Oncol. Hematol., 2002, 42, 249–265 CrossRef PubMed; (b) D. C. Crans, L. Yang, J. A. Alfano, L.-H. Chi, W. Jin, M. Mahroof-Tahir, K. Robbins, M. M. Toloue, L. K. Chan and A. J. Plante, Coord. Chem. Rev., 2003, 237, 13–22 CrossRef CAS.
- (a) P. Ghosh, O. J. D’Cruz, R. K. Narla and F. M. Uckun, Clin. Cancer Res., 2000, 6, 1536–1545 CAS; (b) O. J. D'Cruz, Y. Dong and F. M. Uckun, Anti-Cancer Drugs, 2000, 11, 849–858 CrossRef.
- M. M. Harding and G. Mokdsi, Curr. Med. Chem., 2000, 7, 1289–1303 CrossRef CAS PubMed.
- (a) L. R. Kelland, Drugs, 2000, 59, 1–8 CrossRef CAS PubMed; (b) G. Giaccone, Drugs, 2000, 59, 9–17 CrossRef CAS PubMed.
- E. Kioseoglou, S. Petanidis, C. Gabriel and A. Salifoglou, Coord. Chem. Rev., 2015, 301–302, 87–105 CrossRef CAS.
- (a) W. Urbaniak, K. Jurek, K. Witt and A. Goraczko, Chemik, 2011, 65(4), 273–282 CAS; (b) M. T. Huang, Y. R. Lou, J. G. Xie, W. Ma, Y. P. Lu, P. Yen, B. T. Zhu, H. Newmark and C. T. Ho, Carcinogenesis, 1998, 19(9), 1697–1700 CrossRef CAS PubMed; (c) J. R. Dimmock, S. K. Raghavan and G. E. Bigam, Eur. J. Med. Chem., 1988, 23(2), 111–117 CrossRef CAS; (d) J. Sheikha, A. Parvez, H. Juneja, V. Ingle, Z. Chohan, M. Youssoufi and T. B. Hadda, Eur. J. Med. Chem., 2011, 46(4), 1390–1399 CrossRef PubMed; (e) P. Anand, S. G. Thomas, A. B. Kunnumakkar, C. Sundaram, K. B. Harikumar, B. Sung, S. T. Tharakan, K. Misra, I. K. Priyadarsini, K. N. Rajasekharan and B. B. Aggarwal, Biochem. Pharmacol., 2008, 76, 1590–1611 CrossRef CAS PubMed.
- P. Anand, S. G. Thomas, A. B. Kunnumakkara, C. Sundaram, K. B. Harikumar, B. Sung, S. T. Tharakan, K. Misra, I. K. Priyadarsini, K. N. Rajasekharan and B. B. Aggarwal, Biochem. Pharmacol., 2008, 76(11), 1590–1611 CrossRef CAS PubMed.
- P. A. Vigato, V. Peruzzo and S. Tamburini, Coord. Chem. Rev., 2009, 253, 1099–1201 CrossRef CAS.
- W. P. Roos and B. Kaina, Trends Mol. Med., 2006, 12, 440–450 CrossRef CAS PubMed.
- J. B. Chaires, Curr. Opin. Struct. Biol., 1998, 8, 314–320 CrossRef CAS PubMed.
- (a) S. Y. Ebrahimipour, I. Sheikhshoaie, A. Crochet, M. Khaleghi and K. M. Fromm, J. Mol. Struct., 2014, 1072, 267–276 CrossRef; (b) S. Y. Ebrahimipour, I. Sheikhshoaie, M. Mohamadi, S. Suarez, R. Baggio, M. Khaleghi, M. Torkzadeh-Mahani and A. Mostafavi, Spectrochim. Acta, Part A, 2015, 142, 410–422 CrossRef CAS PubMed.
- S. Y. Ebrahimipour, I. Sheikhshoaie, J. Castro, W. Haase, M. Mohamadi, S. Foro, M. Sheikhshoaie and S. Esmaeili-Mahani, Inorg. Chim. Acta, 2015, 430, 245–252 CrossRef CAS.
- S. Y. Ebrahimipour, I. Sheikhshoaie, A. C. Kautz, M. Ameri, H. Pasban-Aliabadi, H. A. Rudbari, G. Bruno and C. Janiak, Polyhedron, 2015, 93, 99–105 CrossRef CAS.
- S. Y. Ebrahimipour, M. Abaszadeh, J. Castro and M. Seifi, Polyhedron, 2014, 79, 138–150 CrossRef CAS.
- I. Sheikhshoaie, S. Y. Ebrahimipour, A. Crochet and K. M. Fromm, Res. Chem. Intermed., 2015, 41(4), 1881–1891 CrossRef CAS.
- S. Y. Ebrahimipour, J. T. Mague, A. Akbari and R. Takjoo, J. Mol. Struct., 2012, 1028, 148–155 CrossRef.
- A. W. Addison, T. N. Rao, J. Reedijk, J. van Rijn and G. C. Verschoor, J. Chem. Soc., Dalton Trans., 1984, 1349–1356 RSC.
- K. C. Skyrianou, V. Psycharis, C. P. Raptopoulou, D. P. Kessissoglou and G. Psomas, J. Inorg. Biochem., 2011, 105, 63–74 CrossRef CAS PubMed.
- J.-Q. Sha, X. Li, H.-B. Qiu, Y.-H. Zhang and H. Yan, Inorg. Chim. Acta, 2012, 383, 178–184 CrossRef CAS.
- A. Silvestri, G. Barone, G. Ruisi, D. Anselmo, S. Riela and V. T. Liveri, J. Inorg. Biochem., 2007, 101, 841–848 CrossRef CAS PubMed.
- R. Fiel, J. Howard, E. Mark and N. D. Gupta, Nucleic Acids Res., 1979, 6, 3093–3118 CrossRef CAS PubMed.
- A. Terenzi, G. Barone, A. Silvestri, A. M. Giuliani, A. Ruggirello and V. T. Liveri, J. Inorg. Biochem., 2009, 103, 1–9 CrossRef CAS PubMed.
- (a) F. Darabi, H. Hadadzadeh, M. Ebrahimi, T. Khayamian and H. A. Rudbari, Inorg. Chim. Acta, 2014, 409, 379–389 CrossRef CAS; (b) P.-X. Xi, Z.-H. Xu, X.-H. Liu, F.-J. Cheng and Z.-Z. Zeng, Spectrochim. Acta, Part A, 2008, 71, 523–528 CrossRef PubMed.
- A. M. Pyle, J. P. Rehmann, R. Meshoyrer, C. V. Kumar, N. J. Turro and J. K. Barton, J. Am. Chem. Soc., 1989, 111, 3051–3058 CrossRef CAS.
- I. Kuntz Jr, F. Gasparro, M. Johnston Jr and R. Taylor, J. Am. Chem. Soc., 1968, 90, 4778–4781 CrossRef.
- R. L. Scott, Recl. Trav. Chim. Pays-Bas, 1956, 75, 787–789 CrossRef CAS.
- (a) M. Cory, D. D. McKee, J. Kagan, D. W. Henry and J. A. Miller, J. Am. Chem. Soc., 1985, 107, 2528–2536 CrossRef CAS; (b) M. J. Waring, J. Mol. Biol., 1965, 13, 269–282 CrossRef CAS PubMed; (c) V. G. Vaidyanathan and B. U. Nair, J. Inorg. Biochem., 2003, 94, 121–126 CrossRef CAS PubMed; (d) R. Vijayalakshmi, M. Kanthimathi, V. Subramanian and B. U. Nair, Biochim. Biophys. Acta, 2000, 1475, 157–162 CrossRef CAS PubMed.
- D. Suh and J. B. Chaires, Bioorg. Med. Chem., 1995, 3, 723–728 CrossRef CAS PubMed.
- A. H. Kianfar and S. Mohebbi, J. Iran. Chem. Soc., 2007, 4, 215–220 CrossRef CAS.
- A. H. Kianfar, M. Paliz, M. Roushani and M. Shamsipur, Spectrochim. Acta, Part A, 2011, 82(1), 44–48 CrossRef CAS PubMed.
- M. T. Carter, M. Rodriguez and A. J. Bard, J. Am. Chem. Soc., 1989, 111, 8901–8911 CrossRef CAS.
- P. Tsilikia, F. Perdihb, I. Turelb and G. Psomas, Polyhedron, 2013, 53, 215–222 CrossRef.
- Y. Wang, X. Wang, J. Wang, Y. Zhao, W. He and Z. Guo, Inorg. Chem., 2011, 50, 12661–12668 CrossRef CAS PubMed.
- G. Zhang, Y. Ma, L. Wang, Y. Zhang and J. Zhou, Food Chem., 2012, 133, 264–270 CrossRef CAS PubMed.
- X.-B. Fu, Z.-H. Lin, H.-F. Liu and X.-Y. Le, Spectrochim. Acta, Part A, 2014, 122, 22–33 CrossRef CAS PubMed.
- M. Anjomshoa, H. Hadadzadeh, M. Torkzadeh-Mahani, S. J. Fatemi, M. Adeli-Sardou, H. Amiri Rudbarid and V. M. Nardoe, Eur. J. Med. Chem., 2015, 96, 66–82 CrossRef CAS PubMed.
- A. Castiñeiras, N. Fernández-Hermida, I. García-Santos and L. Gómez-Rodríguez, Dalton Trans., 2012, 41, 13486–13495 RSC.
- (a) M. Jiang, M. X. Xie, D. Zheng, Y. Liu, X. Y. Li and X. Chen, J. Mol. Struct., 2004, 692, 71–80 CrossRef; (b) V. Anbazhagan and R. Renganathan, J. Lumin., 2008, 128, 1454–1458 CrossRef CAS.
- B. Ahmad, S. Parveen and R. H. Khan, Biomacromolecules, 2006, 7, 1350–1356 CrossRef CAS PubMed.
- (a) J. Zhang, X.-J. Wang, Y.-J. Yan and W.-S. Xiang, J. Agric. Food Chem., 2011, 59, 7506–7513 CrossRef CAS PubMed; (b) J. Xiao, M. Suzuki, X. Jiang, X. Chen, K. Yamamoto, F. Ren and M. Xu, J. Agric. Food Chem., 2008, 56, 2350–2356 CrossRef CAS PubMed; (c) J. Liu, J. Tian, Z. Hu and X. Chen, Biopolymers, 2004, 73, 443–450 CrossRef CAS PubMed; (d) N. A. Kratochwil, W. Huber, F. Müller, M. Kansy and P. R. Gerber, Biochem. Pharmacol., 2002, 64, 1355–1374 CrossRef CAS PubMed; (e) P. Bourassa, S. Dubeau, G. M. Maharvi, A. H. Fauq, T. Thomas and H. Tajmir-Riahi, Eur. J. Med. Chem., 2011, 46, 4344–4353 CrossRef CAS PubMed.
- P. D. Ross and S. Subramanian, Biochemistry, 1981, 20, 3096–3102 CrossRef CAS PubMed.
- (a) Y. Chen, M.-Y. Qin, J.-H. Wu, L. Wang, H. Chao, L.-N. Ji and A.-L. Xu, Eur. J. Med. Chem., 2013, 70, 120–129 CrossRef CAS PubMed; (b) N. A. Lewis, F. Liu, L. Seymour, A. Magnusen, T. R. Erves, J. F. Arca, F. A. Beckford, R. Venkatraman, A. G. Sarrías, F. R. Fronczek, D. G. VanDerveer, N. P. Seeram, A. Liu, W. L. Jarrett and A. A. Holder, Eur. J. Inorg. Chem., 2012, 2012(4), 664–677 CrossRef CAS PubMed.
- I. Correia, S. Roy, C. P. Matos, S. Borovic, N. Butenko, I. Cavaco, F. Marques, J. Lorenzo, A. Rodríguez, V. Moreno and J. C. Pessoa, J. Inorg. Biochem., 2015, 147, 134–146 CrossRef CAS PubMed.
- K. Dhahagani, S. Mathan Kumar, G. Chakkaravarthi, K. Anitha, J. Rajesh, A. Ramu and G. Rajagopal, Spectrochim. Acta, Part A, 2014, 117, 87–94 CrossRef CAS PubMed.
- O. J. D'Cruz and F. M. Uckun, Expert Opin. Invest. Drugs, 2001, 11(12), 1829–1836 CrossRef.
- G. Sheldrick, SHELXS, Program for the Solution of Crystal Structure, 1997 Search PubMed.
- (a) H. Hadadzadeh, M. Salimi, M. Weil, Z. Jannesari, F. Darabi, K. Abdi, A. Dehno Khalaji, S. Sardari and R. Ahangari, J. Mol. Struct., 2012, 1022, 172–180 CrossRef CAS; (b) V. C. da Silveira, H. Benezra, J. Silva Luz, R. Castro Georg, C. C. Oliveira and A. M. da Costa Ferreir, J. Inorg. Biochem., 2011, 105, 1692–1703 CrossRef PubMed.
- M. Ganeshpandian, R. Loganathan, S. Ramakrishnan, A. Riyasdeen, M. A. Akbarsha and M. Palaniandavar, Polyhedron, 2013, 52, 924–938 CrossRef CAS.
- J. Toneatto and G. A. Argüello, J. Inorg. Biochem., 2011, 105, 645–651 CrossRef CAS PubMed.
- G. M. Morris, R. Huey, W. Lindstrom, M. F. Sanner, R. K. Belew, D. S. Goodsell and A. J. Olson, J. Comput. Chem., 2009, 30, 2785–2791 CrossRef CAS PubMed.
- R. A. Laskowski and M. B. Swindells, J. Chem. Inf. Model., 2011, 51, 2778–2786 CrossRef CAS PubMed.
Footnote |
| † Electronic supplementary information (ESI) available: CCDC 1047297. For ESI and crystallographic data in CIF or other electronic format see DOI: 10.1039/c5ra13715b |
| This journal is © The Royal Society of Chemistry 2015 |

