An electrochemical facile fabrication of platinum nanoparticle decorated reduced graphene oxide; application for enhanced electrochemical sensing of H2O2†
Selvakumar Palanisamy,
Hsin Fang Lee,
Shen-Ming Chen* and
Balamurugan Thirumalraj
Electroanalysis and Bioelectrochemistry Lab, Department of Chemical Engineering and Biotechnology, National Taipei University of Technology, No. 1, Section 3, Chung-Hsiao East Road, Taipei 106, Taiwan, Republic of China. E-mail: smchen78@ms15.hinet.net; Fax: +886-2-27025238; Tel: +886-2-27017147
First published on 8th December 2015
Abstract
In the present work, we report a single step electrochemical fabrication of a platinum nanoparticle decorated reduced graphene oxide (RGO–PtNPs) composite for enhanced electrochemical sensing of hydrogen peroxide (H2O2). The RGO–PtNPs composite was fabricated by the reduction of graphene oxide modified electrode in an electrolyte solution containing a 0.5 mM K2PtCl6 solution with 1 mM KCl at a constant applied potential of −1.4 V for 300 s. The fabricated composite modified electrode was further characterized by scanning electron microscopy, elemental analysis and cyclic voltammetry. Compared with GO–PtNPs and PtNPs modified electrodes, the RGO–PtNPs composite modified electrode showed an enhanced electrocatalytic activity toward the reduction of H2O2. The amperometric response of the RGO–PtNPs composite modified electrode for the reduction of H2O2 was linear over the concentration ranging from 0.05 to 750.6 μM with the limit of detection of 16 nM. The sensor reached its steady state current response within 2 s. The sensitivity of the sensor was calculated as 0.686 + 0.072 μA μM−1 cm−2. The proposed sensor showed a satisfactory selectivity in the presence of biologically coactive compounds. In addition, the sensor also showed a good practicability toward the detection of H2O2 in commercial contact lens solutions and human urine samples.
1. Introduction
Hydrogen peroxide (H2O2) is widely used for different potential applications, including pulp and paper bleaching in industry, propellants in rockets, cleaning and disinfecting agents in domestic use, alternative medicine for emphysema, influenza and AIDS.1–5 In addition, H2O2 is a well-known by product of biological and enzyme catalysed reactions; while the accumulation of H2O2 leads to the inflammation of cells due to oxidative damage or modification of base pairs in DNA.6 Hence, the accurate and trace level detection of H2O2 has always received much attention in the research community. So far, different analytical methods have been used for sensitive detection of H2O2, including fluorescence, chemiluminescence, calorimetry, spectrometry, chromatography and electrochemical methods.7–12 The traditional chromatographic methods are highly sensitive for detection of H2O2, though electrochemical methods are widely used for accurate detection of H2O2 due to its high sensitivity, low cast and portability when compared with traditional chromatographic and spectroscopic methods.13On the other hand, the enzymes or proteins based biosensors are highly sensitive and selective towards H2O2, though the enzyme based biosensors are less interested due to their low stability and high cost.14,15 Hence, the carbon nanomaterials, metal and metal alloy nanoparticles and metal oxide are widely used for construction of sensitive and selective non-enzymatic H2O2 sensors.16–18 Reduced graphene oxide (RGO) or sometimes called as graphene is a well-known carbon nanomaterial and continually received much attention in the scientific community owing to its high surface area, chemically inertness, wide potential window, excellent thermal and electrical conductivity.19,20 Over the few years, RGO and its composites with metal nanoparticles and metal oxides have been widely used for the fabrication of sensitive non-enzymatic H2O2 sensors. For instance, RGO–Au/chitosan,21 For example, RGO/Pt,22 RGO/Ag,23 RGO–cuprous oxide,24 RGO/MnO2 (ref. 25) and RGO/ZnO26 modified electrodes have showed much enhanced electrocatalytic activity and lower overpotential for H2O2 than that of RGO. Compared with metal oxides and metal nanoparticles such as Au and Ag, platinum nanoparticles (PtNPs) has much catalytic ability and stability towards the detection of H2O2.21 Up to now, different methods have been adopted for the preparation of RGO–PtNPs composites and few of them have been used for the detection of H2O2, though all aforementioned methods for preparation of RGO–PtNPs composites are mostly based on chemical or microwave reduction.20,22,27,28 However, a single step electrochemical preparation of RGO/PtNPs composite and applications towards the detection of H2O2 are rarely reported in the literature.
In this article, we report a facile electrochemical fabrication of RGO–PtNPs composite by the reduction of graphene oxide modified electrode in the electrolyte solution containing 0.5 mM K2PtCl6 solution with 1 mM KCl at a constant applied potential of −1.4 V for 300 s. The fabricated RGO–PtNPs composite modified electrode was further used for an enhanced electrochemical sensing of H2O2. The developed non-enzymatic H2O2 sensor has also been used for determination of H2O2 in the commercial contact lens solutions and human urine samples.
2. Experimental
Materials and methods
Graphite powder (98.0% purity) was purchased from Sigma-Aldrich. Potassium hexachloroplatinate(IV) (≥99.9% trace metals basis) was obtained from Sigma Aldrich. Hydrogen peroxide was obtained from Wako pure chemical industries. Glucose, dopamine, ascorbic acid and uric acid were obtained from Sigma Aldrich. The commercial contact lens cleaning solutions containing 3% H2O2 were purchased from Watson store, Taipei, Taiwan. The urine samples were collected from healthy volunteers from Taipei Tech and used for the electrochemical experiments with their permission. The supporting electrolyte 0.05 M pH 7 solution (PBS) was prepared by using 0.05 M Na2HPO4 and NaH2PO4 solutions in double distilled water. All other chemicals used in this study were of analytical grade and prepared using double distilled water without any further purification.Cyclic voltammetry (CV) and amperometry i–t measurements were performed using the CHI 1205a electrochemical station. The surface morphology studies (SEM) were carried out Hitachi S-3000H scanning electron microscope. An energy-dispersive X-ray (EDX) spectrum and elemental mapping were performed using HORIBA EMAX X-ACT that was attached with Hitachi S-3000H scanning electron microscope. Raman spectrum was recorded using a Raman spectrometer (Dong Woo 500i, Korea) equipped with a 50× objective and a charge-coupled detector. Electrochemical impedance spectroscopy (EIS) studies were performed using IM6ex ZAHNER (Kronach, Germany). Ultrasonicator DC150H (Taiwan Delta New Instrument Co. Ltd.) with operating frequency of 40 kHz and ultrasonic power output of 150 W was used for sonication. A conventional three-electrode system consisting of glassy carbon electrode (GCE) as a working electrode, an external saturated Ag/AgCl as a reference electrode and a platinum wire as the auxiliary electrode was used for the electrochemical experiments. Amperometric i–t measurements were performed using a PRDE-3A (AS distributed by BAS Inc. Japan) rotating ring disc electrode (RDE) apparatus with an electrochemically working surface area of 0.033 cm2.
Preparation of RGO–PtNPs composite
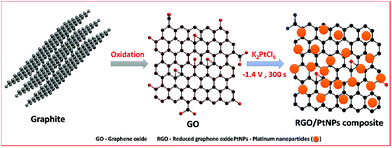
Graphite oxide was prepared from natural graphite by using the well-known Hummers' method as reported previously.32,33 In order to prepare the GO, the obtained graphite oxide was dispersed (2 mg mL−1) in water and sonicated for 30 min. In order to obtain K2PtCl6 solution, about 0.5 mM of K2PtCl6 was added into the 10 mL of distilled water containing 1 mM of KCl. About 8 μL of GO was drop coated on the pre-cleaned GCE and dried in an air oven. The GO modified GCE was transferred into the electrochemical cell containing N2 saturated 0.5 mM of K2PtCl6 with 1 mM KCl solution and applied a constant potential −1.4 V for 300 s. Finally, the PtNPs were electrochemically deposited and GO was simultaneously reduced to RGO. The similar phenomenon we have used earlier for the fabrication of RGO–metal oxide and metal nanoparticles composites.26,29–31 The electrochemically fabricated modified electrode was named as RGO–PtNPs composite modified electrode. Finally, the RGO–PtNPs composite modified electrode was gently rinsed in double distilled water to remove free PtNPs from the composite.The schematic representation for the electrochemical preparation of RGO–PtNPs composite modified electrode is shown in Scheme 1. For comparison, the RGO modified electrode was prepared by electrochemical reduction of GO without K2PtCl6 solution and PtNPs modified electrode was prepared without GO. All electrochemical experiments were performed in an inert atmosphere at ambient conditions.
3. Results and discussion
Characterization of RGO–PtNPs composite
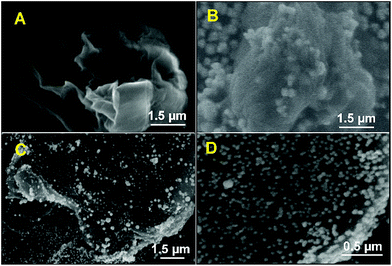
The morphology of the fabricated electrodes were characterized by SEM. Fig. 1 displays the SEM images of (A) RGO, GO–PtNPs (B) and RGO–PtNPs in lower (C) and higher magnification (D).A typical crumble morphology with an association of few nanosheets was observed in SEM for RGO. It can be seen from the Fig. 1B and C, the spherical PtNPs are clearly seen and uniformly distributed on the GO and RGO sheets. The average diameter of PtNPs on RGO was in the range of 65 ± 5 nm (Fig. 1D). The SEM results clearly demonstrated the formation of PtNPs on RGO surface.
In addition, the presence of PtNPs in RGO–PtNPs composite was further confirmed by EDX and EDX elemental mapping. As shown in Fig. 2A, the weight percentage of C, O and Pt were found to be 64.9, 33.2 1.9%, respectively. The EDX elemental mapping of RGO–PtNPs composite confirms the presence of C (Fig. 2B), O (Fig. 2C) and Pt (Fig. 2D). The EDX elemental mapping also showed the homogeneous distribution of PtNPs on RGO surface, which is good agreement with the SEM results of Fig. 1C and D.
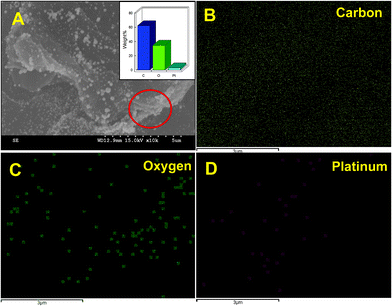 | ||
| Fig. 2 SEM image of (A) RGO–PtNPs composite and corresponding elemental analysis of RGO–PtNPs (inset). The EDX elemental mapping of carbon (B), oxygen (C) and platinum (D). | ||
Raman spectroscopy is widely used for confirm the transformation of GO to RGO and often gives a useful information for the electronic and structural properties of RGO.32 Fig. S1† displays the typical Raman spectra of GO and RGO–PtNPs composite. The D and G bands of GO are observed at 1343 and 1603 cm−1, which are related to the defects of A1g and E2g symmetry.32 While, the broadened G band (1614 cm−1) is observed at RGO–PtNPs composite, which is possibly due to the enhanced disorder of RGO–PtNPs composite when compared to GO. The intensity ratio of the D to G bands (ID/IG) of GO was calculated as 0.91 and 1.07, respectively. The increase of ID/IG clearly demonstrates the transformation of GO to RGO, which is more consistent with previously reported similar works.32 The findings confirmed the formation of RGO–PtNPs composite.
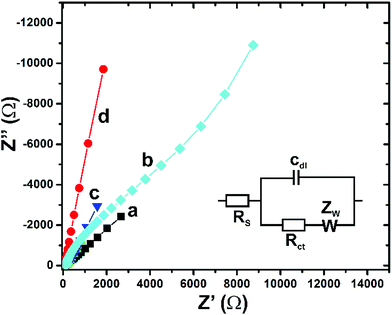
The electrochemical properties of the fabricated different modified electrodes were evaluated by EIS. Fig. 3 shows the typical EIS behaviour of PtNPs (a), GO–PtNPs (b), RGO (c) and RGO–PtNPs (d) modified electrodes in 0.05 M sodium phosphate buffer pH 7 solution containing 5 mM [Fe(CN)6]3−/4−. Randles equivalent circuit model (Fig. 3 inset) was used for EIS analysis, as reported previously.29 The GO–PtNPs modified electrode shows a larger electron transfer resistance (230 Ω) compared with PtNPs modified electrode, which is due to the semi-conducting nature of GO with PtNPs. However, the electron transfer resistance (25 Ω) was greatly deduced in RGO–PtNPs modified electrode when compared with Pt (48 Ω) and GO–PtNPs modified electrodes. The high conducting nature of RGO with PtNPs is the possible reason for high electron transfer and low electron transfer resistance. The result indicates that the electrochemical properties of PtNPs was greatly enhanced in the RGO–PtNPs composite.
Electrochemical behaviour of RGO–PtNPs modified electrode and sensing of H2O2
The electrochemical behaviour of Pt and RGO–PtNPs composite modified electrodes were investigated in N2 saturated 0.5 M H2SO4 solution by CV and the results are shown in Fig. 4. It can be seen that PtNPs and RGO–PtNPs modified electrodes displays a well-known hydrogen adsorption (Habs) and desorption (Hdes) peaks in the potential range between 0.1 to −0.2 V.30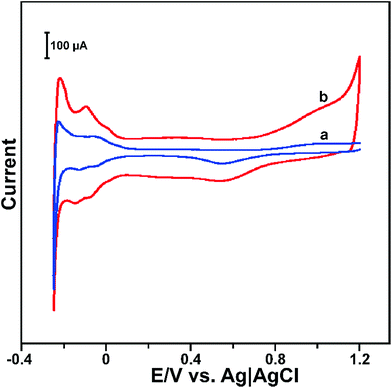 | ||
| Fig. 4 (A) CV response of PtNPs (a) and RGO–PtNPs (b) modified electrodes in N2 saturated 0.5 M H2SO4 solution at a scan rate of 50 mV s−1. | ||
The CV profile of PtNPs and RGO–PtNPs modified electrodes also reveal that the formation and reduction of PtO2, which were appeared in the same potential.32 However, RGO–PtNPs composite modified electrode shows a higher capacitance compared with PtNPs modified electrode, which clearly indicates that RGO–PtNPs modified electrode has high surface area than PtNPs electrode. The electrochemically active surface area (EASA) of the RGO–Pt and Pt modified electrodes were calculated by CV as reported previously.33 The EASA of RGO–Pt and PtNPs modified electrodes were calculated as 0.22 and 0.13 cm2, respectively. The electrocatalytic activity of different modified electrodes were investigated towards H2O2 by CV. Fig. S2† shows the CV response of bare (a), RGO (b), PtNPs (c), GO–PtNPs (d) and RGO–PtNPs (e) modified electrodes in N2 saturated 1 mM H2O2 containing PBS at a scan rate of 50 mV s−1. The electrocatalytic behaviour of different modified electrodes were tested in the potential range between 0.6 to −0.4 V. It can be seen that PtNPs modified electrode shows a good catalytic ability towards the reduction of H2O2 at the potential of 0.108 V. While the GO–PtNPs modified electrode shows enhanced activity towards the reduction of H2O2. The RGO–PtNPs composite modified electrode shows a sharp cathodic peak current response at 0.136 V. In addition, RGO–PtNPs composite modified electrode shows 2 folds enhanced reduction peak current response towards H2O2 than that of PtNPs and GO–PtNPs modified electrodes. The result indicates that the RGO–PtNPs composite modified electrode has high catalytic activity than that of other modified electrodes. The high electrocatalytic activity of RGO–PtNPs composite is due to the combined unique properties of RGO and PtNPs.
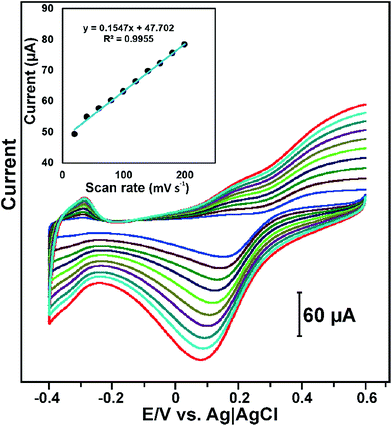
Fig. 5 displays the CV response of RGO–PtNPs composite modified electrode in PBS containing 1 mM H2O2 at different scan rates from 20 to 200 mV s−1. It can be seen that the reduction peak current of H2O2 increases with increasing the scan rates from lower to higher. In addition, the reduction peak potential of H2O2 is slightly shifted towards negative potential upon increasing the scan rates from 20 to 200 mV s−1. The reduction peak current of H2O2 had a linear dependence over the scan rates from 20 to 200 mV s−1 with the correlation coefficient of 0.9955. The result indicates that the electro-reduction of H2O2 is controlled by adsorption process.34 However, at slow scan rates (<100 mV s−1) the reduction peak current of H2O2 was linear with the square root of scan rates and correlation coefficient of 0.9944 (figure not shown), which indicates that the electrochemical reduction of H2O2 is diffusion controlled electrochemical process at slow scan rates.35 The result indicates that the electrochemical reduction of H2O2 is controlled by diffusion–adsorption controlled electrochemical process.
The pH is a crucial parameter to evaluate the optimum activity of RGO–PtNPs composite modified electrodes towards H2O2. Hence the CV was performed for RGO–PtNPs composite modified electrodes in N2 saturated 1 mM H2O2 containing different pH solutions (pH 3, 5, 7 and 9) at a scan rate of 50 mV s−1. An utmost response current for H2O2 was observed at pH 7 solution compared with the response observed in other pH solutions (figure not shown). Hence, pH 7 was selected as an optimum pH and used for further electrochemical studies.
Amperometric determination of H2O2
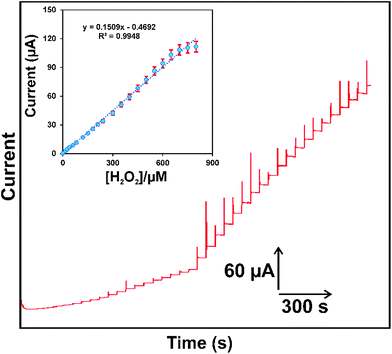
The RGO–PtNPs composite modified electrodes was further used for the determination of H2O2 and it was done by using amperometric i–t method. It is well-known that applied potential is a crucial factor in the amperometric method and could directly affect the response of the sensor. Hence the amperometric response of 5 μM H2O2 was studied at different applied potentials ranging from −0.1 to 0.2 V in N2 saturated PBS. The utmost reduction response current was observed for 5 μM H2O2 when the applied potential was 0.1 V. The other working applied potentials showed less response current for 5 μM H2O2 when compared with the response current observed for 0.1 V (figure not shown). Hence, 0.1 V was chosen as an optimum working potential for amperometric determination of H2O2.Fig. 6 displays the amperometric i–t response obtained at RGO–PtNPs composite modified RDE on the successive additions of different concentration of H2O2 (0.05–875 μM) into continuously stirred N2 saturated PBS. The applied potential was held on 0.1 V. It can be seen that a well-defined amperometric response was observed for each addition of 0.05 μM (a), 0.5 μM (b), 5 μM (c) and 25 μM (d, e) H2O2 into the PBS, which indicates the high electro-reduction ability of RGO–PtNPs composite modified RDE towards H2O2. The response time of the sensor was calculated as 2 s, which is quite less than previously reported non-enzymatic H2O2 sensors in literature (see Table 1).
| Electrode | Res. time (s) | Eapp (V) | LOD (μM) | Sensitivity (μA μM−1 cm−2) | Ref. | ||||||||||||||||||||||||||||||||||||||||||||||||||||||||||||||||||||||||||||||||||||||||||||||
|---|---|---|---|---|---|---|---|---|---|---|---|---|---|---|---|---|---|---|---|---|---|---|---|---|---|---|---|---|---|---|---|---|---|---|---|---|---|---|---|---|---|---|---|---|---|---|---|---|---|---|---|---|---|---|---|---|---|---|---|---|---|---|---|---|---|---|---|---|---|---|---|---|---|---|---|---|---|---|---|---|---|---|---|---|---|---|---|---|---|---|---|---|---|---|---|---|---|---|---|
| a Res. time – response time, Eapp – applied potential, LOD – limit of detection, MWCNT – multiwalled carbon nanotubes, ITO – indium tin oxide, GCE – glassy carbon electrode, GR – graphene, AuNPs – gold nanoparticles, Chi – chitosan, PtNPs* – PtNPs prepared by microwave reduction, PtNPs*a – PtNPs prepared by UV reduction, PtNPs*b – PtNPs prepared by chemical reduction, PtNPs*c – PtNPs prepared by microwave reduction, GNF – carbon nanofibers, CNT – carbon nanotubes, RGO – reduced graphene oxide. | |||||||||||||||||||||||||||||||||||||||||||||||||||||||||||||||||||||||||||||||||||||||||||||||||||
| MWCNT/PtNPs/GCE | 5.0 | 0.0 | 0.3 | 0.205 | 6 | ||||||||||||||||||||||||||||||||||||||||||||||||||||||||||||||||||||||||||||||||||||||||||||||
| GR/CNT/PtNPs*b/GCE | 3.0 | −0.05 | 0.01 | 1.41 | 17 | ||||||||||||||||||||||||||||||||||||||||||||||||||||||||||||||||||||||||||||||||||||||||||||||
| GR/PtNPs*c/GCE | 4.0 | 0.0 | 0.08 | — | 20 | ||||||||||||||||||||||||||||||||||||||||||||||||||||||||||||||||||||||||||||||||||||||||||||||
| GR/AuNPs/Chi/GCE | 5.0 | −0.4 | 1.6 | — | 21 | ||||||||||||||||||||||||||||||||||||||||||||||||||||||||||||||||||||||||||||||||||||||||||||||
| GR/PtNPs*a/GCE | — | 0.0 | 0.5 | — | 22 | ||||||||||||||||||||||||||||||||||||||||||||||||||||||||||||||||||||||||||||||||||||||||||||||
| GR/PtNPs*/GCE | 4.0 | −0.2 | 0.8 | — | 28 | ||||||||||||||||||||||||||||||||||||||||||||||||||||||||||||||||||||||||||||||||||||||||||||||
| MWCNT/Ag/ITO | — | — | 2.2 | — | 36 | ||||||||||||||||||||||||||||||||||||||||||||||||||||||||||||||||||||||||||||||||||||||||||||||
| GR/AuNPs/GCE | — | −0.4 | 6.0 | 3.0 | 37 | ||||||||||||||||||||||||||||||||||||||||||||||||||||||||||||||||||||||||||||||||||||||||||||||
| PtPd/MWCNT/GCE | 5.0 | 0.25 | 1.2 | 0.414 | 38 | ||||||||||||||||||||||||||||||||||||||||||||||||||||||||||||||||||||||||||||||||||||||||||||||
| GNF/PtNPs/GCE | — | 0.0 | 0.6 | — | 39 | ||||||||||||||||||||||||||||||||||||||||||||||||||||||||||||||||||||||||||||||||||||||||||||||
| RGO–PtNPs/GCE | 2.0 | 0.1 | 0.016 | 0.686 ± 0.072 | This work | ||||||||||||||||||||||||||||||||||||||||||||||||||||||||||||||||||||||||||||||||||||||||||||||
The RGO–PtNPs composite modified RDE showed the stable amperometric response for H2O2 in the linear response range from 0.05 to 750.6 μM (Fig. 6 inset). The LOD was calculated as 0.016 μM based on S/N = 3. The sensitivity was estimated from the slope as 0.686 + 0.072 μA μM−1 cm−2. In order to evaluate the analytical performance and novelty of the proposed non-enzymatic H2O2 sensor, the analytical performance of the sensor (LOD, sensitivity and response time) is compared with previously reported H2O2 sensors. The comparison of analytical performance of the proposed H2O2 sensor is shown in Table 1. It can be seen from Table 1 that the proposed RGO–PtNPs composite based non-enzymatic H2O2 sensor is more comparable and showed better performance compared with previously reported metal nanoparticles, carbon nanomaterials based H2O2 sensors.6,17,20–22,28,36–39 The comparison results clearly revealed that the proposed RGO–PtNPs composite can be used for the sensitive detection of H2O2.
The selectivity of the RGO–PtNPs composite is more important towards the detection of H2O2, since the applied working potential (0.1 V) is very close to the potential of dopamine (0.2 V), ascorbic acid (0.05 V) and uric acid (0.4 V). In addition, it is well-known that the aforementioned compounds are highly active on graphene modified electrode surfaces; hence the selectivity of the RGO–PtNPs composite modified electrode was investigated in the presence of high concentration of dopamine, ascorbic acid and uric acid by amperometry. Fig. S3† shows the amperometric i–t response of RGO–PtNPs composite modified RDE for the successive addition of 1 μM H2O2 (a), 500 μM dopamine (b), 500 μM ascorbic acid (c) and 500 μM uric acid (d) solutions into continuously stirred N2-saturated PBS. The applied potential was held at 0.1 V. It can be seen that a well-defined and enhanced current response was observed for the addition of 1 μM H2O2 when compared to the response of 500 folds addition of dopamine and uric acid. However, the ascorbic acid did not showed any obvious response on the modified electrode. The result confirmed that the RGO–PtNPs composite has appropriate selectivity towards the detection of H2O2 in the presence of high concentration of dopamine, ascorbic acid and uric acid.
In order to evaluate the practicability of the RGO–PtNPs composite, it was further used for the detection of H2O2 in real samples by amperometric method. Experimental and working conditions are similar as of in Fig. 6. The collected urine samples were diluted 10 times with PBS and used for electrochemical measurements without any further pretreatment. An appropriate concentration of H2O2 was diluted with 1 mL urine and used for the real sample analysis. The unknown amount of concentration of spiked commercial contact lens solution was first predetermined as 15.6 μM from the calibration plot. The known concentration (20.0 μM) of commercial contact lens solution was used for the real sample analysis. The recovery (%) of H2O2 was calculated by the standard addition method, as reported early.31 The recovery of H2O2 in commercial contact lens solution and human urine samples are summarized in Table 2. It can be seen from Table 2, the average recovery of H2O2 in commercial contact lens solution and human urine samples were 96.1 and 95.5%, respectively. The satisfactory recovery of H2O2 in commercial contact lens solution and human urine samples indicates the appropriate practicality of the RGO–PtNPs composite modified electrode towards the determination of H2O2.
| Sample | Added (μM) | Found (μM) | Recovery (%) | RSD (%) | |||||||||||||||||||||||||||||||||||||||||||||||||||||||||||||||||||||||||||||||||||||||||||||||
|---|---|---|---|---|---|---|---|---|---|---|---|---|---|---|---|---|---|---|---|---|---|---|---|---|---|---|---|---|---|---|---|---|---|---|---|---|---|---|---|---|---|---|---|---|---|---|---|---|---|---|---|---|---|---|---|---|---|---|---|---|---|---|---|---|---|---|---|---|---|---|---|---|---|---|---|---|---|---|---|---|---|---|---|---|---|---|---|---|---|---|---|---|---|---|---|---|---|---|---|
| a RSD is related to the 5 measurements. | |||||||||||||||||||||||||||||||||||||||||||||||||||||||||||||||||||||||||||||||||||||||||||||||||||
| Contact lens solution (3%) | — | 15.6 | — | — | |||||||||||||||||||||||||||||||||||||||||||||||||||||||||||||||||||||||||||||||||||||||||||||||
| 20.0 | 34.2 | 96.1 | 4.7 | ||||||||||||||||||||||||||||||||||||||||||||||||||||||||||||||||||||||||||||||||||||||||||||||||
| Human urine | — | — | — | — | |||||||||||||||||||||||||||||||||||||||||||||||||||||||||||||||||||||||||||||||||||||||||||||||
| 20.0 | 19.1 | 95.5 | 4.3 | ||||||||||||||||||||||||||||||||||||||||||||||||||||||||||||||||||||||||||||||||||||||||||||||||
The storage stability of the RGO–PtNPs composite modified electrode towards the detection of H2O2 was investigated by CV. The reduction peak current response of the RGO–PtNPs composite modified electrode towards 1 mM H2O2 containing N2 saturated PBS was measured periodically up to 56 hours and the results are shown in Fig. S4.† It can be seen that the RGO–PtNPs composite modified electrode retains 96.1, 91.1 and 86.8% of its initial current response for 1 mM H2O2 after stored in 20, 40 and 56 hours, which indicates the appropriate storage stability of the sensor. The RGO–PtNPs composite modified electrode was stored in PBS when not in use.
The repeatability and reproducibility of the proposed sensor was evaluated using CV for the detection of 1 mM H2O2. The experimental conditions are similar as of in Fig. S2.† Three RGO–PtNPs composite modified electrodes were prepared independently and used for the detection of 1 mM H2O2 in PBS by CV. The relative standard deviation (RSD) of 4.4% was observed for the detection of 1 mM H2O2 using three RGO–PtNPs composite modified electrodes, which indicates the appreciable reproducibility of the sensor. The repeatability of the RGO–PtNPs composite modified electrode was evaluated by the successive detection of H2O2 in ten different PBS. The RSD of 5.2% was observed for ten successive detection of 1 mM H2O2 in ten different PBS using a single RGO–PtNPs composite electrode. The obtained results indicate that the RGO–PtNPs composite modified electrode has appropriate repeatability for the detection of H2O2.
4. Conclusions
In conclusion, a simple electrochemical method has been used for the fabrication of RGO–PtNPs composite. The RGO–PtNPs composite modified electrode showed an enhanced electrocatalytic activity towards the reduction of H2O2 than that of other modified electrodes. In addition, the fabricated non-enzymatic sensor displayed good analytical features such as wide linear response range, high sensitivity and fast response. In addition, the RGO–PtNPs composite showed a good practicality for the detection H2O2 in commercial contact lens solution and human urine samples. As a future prospective, the RGO–PtNPs composite can be used for precise detection of H2O2 in commercial and biological samples.Acknowledgements
This project was supported by the National Science Council and the Ministry of Education of Taiwan (Republic of China).Notes and references
- O. S. Wolfbeis, A. Dürkop, M. Wu and Z. H. Lin, Angew. Chem., Int. Ed., 2002, 41, 4495–4498 CrossRef CAS.
- C. G. Tsiafoulis, P. N. Trikalitis and M. I. Prodromidis, Electrochem. Commun., 2005, 7, 1398–1404 CrossRef CAS.
- K. J. Chen, K. C. Pillai, J. Rick, C. J. Pan, S. H. Wang, C. C. Liu and B. J. Hwang, Biosens. Bioelectron., 2012, 33, 120–127 CrossRef CAS.
- I. B. Roninson, Cancer Res., 2003, 63, 2705–2715 CAS.
- E. W. Miller, A. E. Albers, A. Pralle, E. Y. Isacoff and C. J. Chang, J. Am. Chem. Soc., 2005, 127, 16652–16659 CrossRef CAS PubMed.
- Z. Miao, D. Zhang and Q. Chen, Materials, 2014, 7, 2945–2955 CrossRef CAS.
- D. P. Murale, H. Liew, Y.-H. Suh and D. G. Churchill, Anal. Methods, 2013, 5, 2650–2652 RSC.
- J. Wang, L. Li, W. Huang and J. Cheng, Anal. Chem., 2010, 82, 5380–5383 CrossRef CAS PubMed.
- H. Kojima, N. Nakatsubo, K. Kikuchi, S. Kawahara, Y. Kirino, H. Nagoshi, Y. Hirata and T. Nagano, Anal. Chem., 1998, 70, 2446–2453 CrossRef CAS PubMed.
- C. Matsubara, N. Kawamoto and K. Takamura, Analyst, 1992, 117, 1781–1784 RSC.
- T. Toyo'oka, T. Kashiwazaki and M. Kato, Talanta, 2003, 60, 467–475 CrossRef.
- W. Chen, S. Cai, Q. Q. Ren, W. Wen and Y. D. Zhao, Analyst, 2012, 137, 49–58 RSC.
- J. Wang, Biosens. Bioelectron., 2006, 21, 1887–1892 CrossRef CAS PubMed.
- S. He, Z. Chen, Y. Yu and L. Shi, RSC Adv., 2014, 4, 45185–45190 RSC.
- M. M. Liu, R. Liu and W. Chen, Biosens. Bioelectron., 2013, 45, 206–212 CrossRef CAS.
- S. Chen, R. Yuan, Y. Chai and F. Hu, Microchim. Acta, 2013, 180, 15–32 CrossRef CAS.
- Y. Sun, K. He, Z. Zhang, A. Zhou and H. Duan, Biosens. Bioelectron., 2015, 68(15), 358–364 CrossRef CAS PubMed.
- W. W. He, X. C. Wu, J. B. Liu, K. Zhang, W. G. Chu, L. L. Feng, X. N. Hu, W. Y. Zhou and S. S. Xie, Langmuir, 2010, 26, 4443–4448 CrossRef CAS.
- T. Gan and S. Hu, Microchim. Acta, 2011, 175, 1–19 CrossRef CAS.
- S. Guo, D. Wen, Y. Zhai, S. Dong and E. Wang, ACS Nano, 2010, 4, 3959–3968 CrossRef CAS PubMed.
- N. Jia, B. Huang, L. Chen, L. Tan and S. Yao, Sens. Actuators, 2014, 195, 165–170 CrossRef CAS.
- F. Xu, Y. Sun, Y. Zhang, Y. Shi and Z. W. Zhuang, Electrochem. Commun., 2011, 13, 1131–1134 CrossRef CAS.
- S. Liu, J. Q. Tian, L. Wang and X. P. Sun, J. Nanopart. Res., 2011, 13, 4539–4548 CrossRef CAS.
- F. Xu, M. Deng, G. Li, S. Chen and L. Wang, Electrochim. Acta, 2013, 88, 59–65 CrossRef CAS.
- S. He, B. Zhang, M. Liu and W. Chen, RSC Adv., 2014, 4, 49315–49323 RSC.
- S. Palanisamy, S. M. Chen and R. Sarawath, Sens. Actuators, B, 2012, 166–167, 372–377 CrossRef CAS.
- Y. Tang, G. P. Kotchey, H. Vedala and A. Star, Electroanalysis, 2011, 23, 870–877 CrossRef CAS.
- F. Zhang, Z. Wang, Y. Zhang, Z. Zheng, C. Wang, Y. Du and W. Ye, Int. J. Electrochem. Sci., 2012, 7, 1968–1977 CAS.
- S. Palanisamy, C. Karuppiah, S. M. Chen, C. Y. Yang and P. Periakaruppan, Anal. Methods, 2014, 6, 4271–4278 RSC.
- S. Palanisamy, C. Karuppiah and S. M. Chen, Colloids Surf., B, 2014, 114, 164–169 CrossRef CAS PubMed.
- S. Palanisamy, S. Ku and S. M. Chen, Microchim. Acta, 2013, 180, 1037–1042 CrossRef CAS.
- P. Wang, Z. G. Liu, X. Chen, F. L. Meng, J. H. Liu and X. J. Huang, J. Mater. Chem. A, 2013, 1, 9189–9195 CAS.
- P. Daubinger, J. Kieninger, T. Unmüssig and G. A. Urban, Phys. Chem. Chem. Phys., 2014, 16, 8392–8399 RSC.
- L. Shang, F. Zhao and B. Zeng, Int. J. Electrochem. Sci., 2015, 10, 786–794 CAS.
- S. He, Z. Chen, Y. Yu and L. Shi, RSC Adv., 2014, 4, 45185–45190 RSC.
- A. Yu, Q. Wang, J. Yong, P. J. Mahon, F. Malherbe, F. Wang, H. Zhang and J. Wang, Electrochim. Acta, 2014, 74, 111–116 CrossRef.
- J. Hu, F. Li, K. Wang, D. Han, Q. Zhang, J. Yuan and L. Niu, Talanta, 2012, 93, 345–349 CrossRef CAS PubMed.
- K. J. Chen, K. C. Pillai, J. Rick, C. J. Pan, S. H. Wang, C. C. Liu and B. J. Hwang, Biosens. Bioelectron., 2012, 33, 120–127 CrossRef CAS.
- Y. Liu, D. Wang, L. Xu, H. Hou and T. You, Biosens. Bioelectron., 2011, 26, 4585–4590 CrossRef CAS PubMed.
Footnote |
| † Electronic supplementary information (ESI) available. See DOI: 10.1039/c5ra20512c |
| This journal is © The Royal Society of Chemistry 2015 |

