 Open Access Article
A self optimizing synthetic organic reactor system using real-time in-line NMR spectroscopy†
Victor
Sans‡
,
Luzian
Porwol‡
,
Vincenza
Dragone‡
and
Leroy
Cronin‡
*
WestCHEM, School of Chemistry, The University of Glasgow, Glasgow G12 8QQ, UK. E-mail: Lee.Cronin@glasgow.ac.uk; Web: http://www.croninlab.com
First published on 14th November 2014
Abstract
A configurable platform for synthetic chemistry incorporating an in-line benchtop NMR that is capable of monitoring and controlling organic reactions in real-time is presented. The platform is controlled via a modular LabView software control system for the hardware, NMR, data analysis and feedback optimization. Using this platform we report the real-time advanced structural characterization of reaction mixtures, including 19F, 13C, DEPT, 2D NMR spectroscopy (COSY, HSQC and 19F-COSY) for the first time. Finally, the potential of this technique is demonstrated through the optimization of a catalytic organic reaction in real-time, showing its applicability to self-optimizing systems using criteria such as stereoselectivity, multi-nuclear measurements or 2D correlations.
Introduction
The use of continuous flow approaches in synthetic chemistry is an ever expanding field for both organic and inorganic synthesis.1,2 This is because the use of a flow-reactor manifold allows chemical transformations to be performed under conditions that are not available with traditional batch chemistry; for example at high pressure and temperatures above the boiling point of the solvent,2 exploiting supported reagents, and catalysts. This also provides enhanced safety against runaway reactions as the amount of material being transformed is smaller and the surface area to volume ratios mean that heat management is much easier.3 These developments have been supported in recent years by the integration of in-line analytical techniques, including UV-Vis,4 IR,5,6 and MS.7,8 This has represented a major step forward, enabling the characterization of the products and the optimization of the reaction conditions in real-time. Despite being one of the most powerful spectroscopic techniques, the use of NMR integrated into processing set-ups has mostly been reported using ‘by-pass’ configurations, flow cells in high field NMR machines, or micro coils for microfluidic applications.9–18We therefore hypothesized that the design and development of an integrated synthetic flow platform incorporating in-line NMR for synthetic chemistry, at the milli-fluidic scale, could be employed to characterize and monitor organic reactions ‘on-the-fly’. Herein we present such a platform and we also demonstrate its potential for a wide range of applications, such as kinetic and mechanistic studies, as well as the characterization of the reaction mixture under the relevant process conditions. Finally we also show how the system can be used to self-optimize a reaction in real-time, exploiting feedback from the spectroscopic measurements, leading to a self-optimizing continuous-flow process. This self-optimization is possible due to the real-time monitoring of the product distribution via NMR, thereby allowing direct control of the reactor, reagent inputs, and process conditions. This control is used to direct the reaction towards a desired product distribution in real-time, as a result of the feedback from the reactor system.
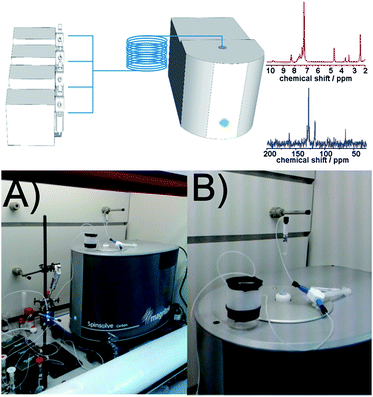
The benchtop NMR employed in this work (Spinsolve from Magritek) uses a compact permanent magnet (43 MHz) based on the Hallbach design.19,20 The magnet from Spinsolve is optimized to maximize sample volume, making it possible to work with standard 5 mm NMR tubes. The cavity is therefore the ideal to accommodate fluorinated polytetrafluoroethylene (PTFE) tubing allowing the reaction mixture to be flowed through the core of the device. Recently it was demonstrated that NMR spectra can be obtained employing this configuration, resulting in an ideal system for acquiring NMR data in an ordinary research laboratory.21 Despite the low field of the magnet, Spinsolve has remarkable sensitivity and stability, and permits acquiring spectra from several different nuclei including 1H, 13C and 19F (Scheme 1).
The reactor design employed in this work consists of a set of programmable syringe pumps (C3000, Tricontinent) controlled via LabView. They were connected with standard Omnifit 1/16′′ OD tubing and standard connectors to a passive micromixer. A tubular reactor was made of PTFE (1/16′′ OD, 0.8 mm ID and 1/8′′ OD, 1.5 mm ID) with variable lengths depending on the residence time required by the reaction. More detailed information about the experimental set-up can be found in the ESI.†
Results and discussion
Kinetic studies
As a proof of concept, and as a test configuration for the in-line NMR, the condensation reaction between benzaldehyde (1) and benzylamine (2) to produce the corresponding imine N-bezylidenbenzylamine (3) was employed, see Scheme 2; this also serves to demonstrate the suitability and simplicity of employing Spinsolve for monitoring organic reactions (see ESI, Scheme S1†).Imine formation is very important in synthetic chemistry22 and in self-assembly23–26 forming highly complex 3D molecules and materials. In a simple configuration, a 3-way mixer was located above the aperture for the sample in the NMR spectrometer and a length of PTFE tubing (1.5 mm ID) was connected in a down flow configuration and was used as a reactor (see ESI, Fig. S6† for more details). At the start of the reaction the flow rates were adjusted to ensure the full magnetization of the reaction mixture before it reached the detector and to ensure the correct residence time; so well-defined sections of the solution were in the detector during each acquisition pulse. A 1 M solution of each reagent in MeOH was pumped into the reactor at controlled flow rates to ensure a 1![[thin space (1/6-em)]](https://www.rsc.org/images/entities/char_2009.gif) :
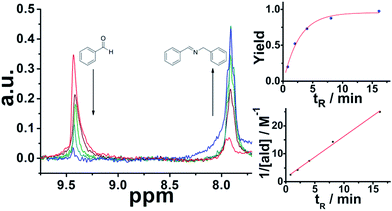
:![[thin space (1/6-em)]](https://www.rsc.org/images/entities/char_2009.gif) 1 mixture with controlled residence times before reaching the sensor. It is important to mention that Spinsolve can work with non-deuterated solvents. This reduces the cost of operation, eliminates undesired isotopic effects, and permits working under real processing conditions. The experiments were carried out at decreasing flow rates (increasing residence times). Under these conditions, the 1H signal of the aldehyde proton at 9.4 ppm progressively disappeared, while the corresponding imine proton at 7.9 ppm increased accordingly (Fig. 1). Although the acquisition time (10 s) could be limiting, we chose reactions that fell within the timescale of the NMR for this proof of concept study.
1 mixture with controlled residence times before reaching the sensor. It is important to mention that Spinsolve can work with non-deuterated solvents. This reduces the cost of operation, eliminates undesired isotopic effects, and permits working under real processing conditions. The experiments were carried out at decreasing flow rates (increasing residence times). Under these conditions, the 1H signal of the aldehyde proton at 9.4 ppm progressively disappeared, while the corresponding imine proton at 7.9 ppm increased accordingly (Fig. 1). Although the acquisition time (10 s) could be limiting, we chose reactions that fell within the timescale of the NMR for this proof of concept study.
The results are consistent with our previous report of the same reaction system under flow employing 3D-printed millifluidic devices.27 The data fits to second order kinetics, typically observed in imine synthesis. An advantage of NMR compared to the previous methods employed to monitor organic transformations in-line, like ATR-IR28 is that the signals observed are proportional to the concentration of the analytes. Hence, it is possible to calculate conversion and yields without the need of additional calibration or corrections.
Advanced in-line structural characterization
Employing a benchtop NMR as an in-line sensor allows us to obtain an unprecedented amount of chemical information during the reaction in real-time. To develop this further, we designed and built a glass flow-cell which was employed to maximize the sensitivity of the signal to be measured (see ESI, Fig. S2† for more details). Fig. 2 shows the 13C NMR spectrum of the reaction mixture corresponding to the imine synthesis between benzaldehyde (2 M in CH3CN) and benzylamine (2 M in CH3CN) mixed in a 1![[thin space (1/6-em)]](https://www.rsc.org/images/entities/char_2009.gif) :
:![[thin space (1/6-em)]](https://www.rsc.org/images/entities/char_2009.gif) 1 volumetric ratio with a residence time of 30 minutes to ensure full conversion was achieved. The total acquisition time was 17 minutes and the peaks corresponding to the imine, aliphatic and aromatic carbons were clearly identified. DEPT sequences were also acquired showing the difference between CH, CH2 and CH3 groups, see ESI, Fig. S7.†
1 volumetric ratio with a residence time of 30 minutes to ensure full conversion was achieved. The total acquisition time was 17 minutes and the peaks corresponding to the imine, aliphatic and aromatic carbons were clearly identified. DEPT sequences were also acquired showing the difference between CH, CH2 and CH3 groups, see ESI, Fig. S7.†
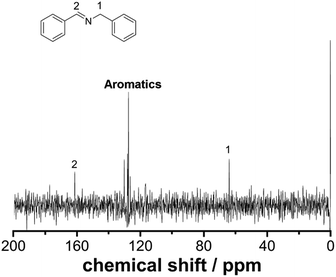 | ||
| Fig. 2 13C NMR under flow conditions of compound 3. The spectrum corresponds to 64 scans (17 minutes) at a flow rate of 0.125 mL min−1. | ||
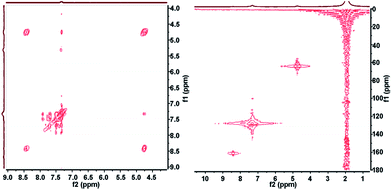
2D NMR correlation spectroscopy can be performed in a simple and straightforward manner employing our platform. A number of 2D sequences including HSQC, HMBC, HMQC, HETCOR, COSY, J-RES, 19F-COSY, 19F-JRES and 1H–19F COSY correlations are possible and can be easily acquired under flow conditions. Other sequences being targeted will enable interesting experiments like DOSY. Fig. 3 shows an example of an HSQC and a COSY spectra corresponding to the same studied synthesis. The spectra clearly reflect the correlation between protons and carbons from the product molecule.
Electrophilic fluorinations
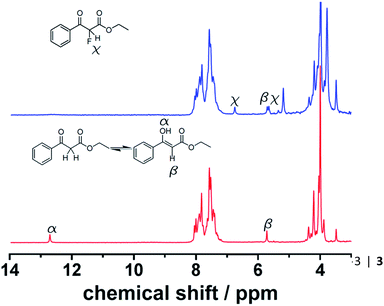
Fluorinations are very important synthetic reactions with applications in medicinal chemistry and positron electron tomography, requiring rapid handling of the radioactive reagents.29 In particular, electrophilic fluorinations employing Selectfluor have attracted a great deal of attention because of the mild and safe conditions employed when compared to traditional fluorinating agents such as F2.30 Recently, the efficient synthesis of fluorinated compounds employing Selectfluor under flow conditions has been demonstrated.31 Our approach offers the possibility not only of monitoring the reaction in real-time, but also of potentially observing intermediate steps, and hence the ability of obtaining valuable mechanistic insights. The test reaction selected was the α-fluorination with Selectfluor of ethyl-3-oxo-3-phenylpropanoate (4) to study the formation process of ethyl-2-fluoro-3-oxo-3-phenylpropanoate (5), see Scheme 3.Initially, a solution of 4 (0.5 M in CH3CN) was pumped through the flow system and the 1H NMR showed the tautomeric equilibrium (see Fig. 4, red spectrum). In the next step, this solution was mixed with a saturated solution of Selectfluor (ca. 0.15 M in CH3CN) and was pumped together in a 1![[thin space (1/6-em)]](https://www.rsc.org/images/entities/char_2009.gif) :
:![[thin space (1/6-em)]](https://www.rsc.org/images/entities/char_2009.gif) 1 volumetric ratio with a residence time of 20 minutes. Under these conditions the peaks corresponding to the tautomer were strongly reduced and two new peaks were observed in the 1H NMR spectrum (Fig. 4, blue spectrum).
1 volumetric ratio with a residence time of 20 minutes. Under these conditions the peaks corresponding to the tautomer were strongly reduced and two new peaks were observed in the 1H NMR spectrum (Fig. 4, blue spectrum).
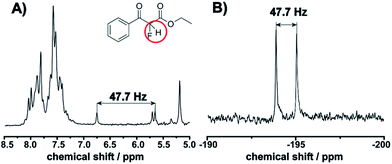
This observation is consistent with an electrophilic fluorination, as we assume that this shift is consistent with the fluoro-olefin structure 4, which is formed from the enol-tautomer through electrophilic addition of the F-cation. The shift of the fluorine in this position is consistent with similar structures reported.32 The monofluorinated product could also be assigned to the coupling constant of 47.7 Hz in the proton spectra, see Fig. 5. This shift is in agreement with the 19F NMR spectra collected in a high field 400 MHz NMR Bruker machine (see ESI, Fig. S8†).
On-the-fly monitoring of stereoselectivity
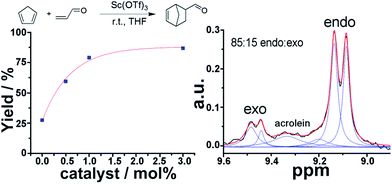
1H NMR is a very powerful spectroscopic technique, especially for the elucidation of the stereoselectivity of a reaction, and could be used to explore the optimization of the desired stereochemical configuration of a given reaction mixture in real-time. We therefore set out to explore this concept by using in-line NMR in a flow set-up, aiming for real-time feedback control of the reaction. As a proof of concept we simultaneously monitored the yield and selectivity of a Diels–Alder cycloaddition between cyclopentadiene and acrolein in real-time, distinguishing both adducts (endo and exo isomers) though in-line analytics is possible with NMR. The flow set-up was modified to mix a 2 M solution of cyclopentadiene in THF, acrolein (2 M in THF) and Sc(OTf)3 (0.02 M in THF) as a catalyst. The solutions were mixed in a PTFE 4-way connector employing three pumps. Increasing amounts of catalyst were added to a 1![[thin space (1/6-em)]](https://www.rsc.org/images/entities/char_2009.gif) :
:![[thin space (1/6-em)]](https://www.rsc.org/images/entities/char_2009.gif) 1 mixture (mol/mol) of both reagents and a total reactor volume of 2.47 mL was employed to allow enough residence time for the reaction to occur. The endo and exo peaks were observed in the NMR spectra with some degree of overlap with the acrolein peaks (Fig. 6).
1 mixture (mol/mol) of both reagents and a total reactor volume of 2.47 mL was employed to allow enough residence time for the reaction to occur. The endo and exo peaks were observed in the NMR spectra with some degree of overlap with the acrolein peaks (Fig. 6).
The band corresponding to the acrolein was expected to appear as a doublet. However, as a consequence of the low magnetic field, the coupling is of similar magnitude to the magnetic field, thus appearing as a multiplet due to the strong coupling, (see ESI, Fig. S10†). As can be observed in Table 1, both the yield and selectivity were strongly dependent on the amount of catalyst employed. An increase in catalyst led to a steady increase in yield. On the other hand the endo/exo ratio has a maximum at 0.5 mol% of catalyst, with higher amounts of catalyst leading to slightly lower ratios, (see ESI, Fig. S10†). The endo product corresponds to the thermodynamic product, while the exo corresponds to the kinetic.
| Entry | Cat./mol% | t R/min | Yield/% | endo/exo |
|---|---|---|---|---|
| 1 | 0 | 49 | 27.6 | 3.1 |
| 2 | 0.5 | 47 | 59.6 | 7.4 |
| 3 | 1 | 45 | 79.2 | 6.3 |
| 4 | 3 | 38 | 87 | 5.6 |
Self-optimization of flow conditions
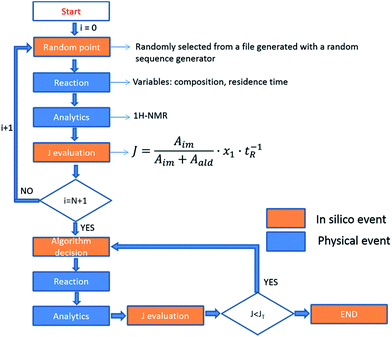
As eluded to before, a very powerful yet unreported application of flow-NMR is in the realization of a self-optimizing reactor system able to adjust reaction trajectories under flow in real-time.33–38 Indeed, the use of an NMR-based sensor to enable feedback control of the operation conditions opens up a wide new range of possibilities for self-optimization, like fluorination reactions, 13C signals, etc. As a proof of principle, we chose the catalytic synthesis of an imine derived from the 4-fluorobenzaldehyde (1 M in CH3CN) and aniline (2 M in CH3CN), employing diluted trifluoroacetic acid (TFA, 0.05 M in CH3CN) as a catalyst. Each reagent was pumped to a 1/8′′ mixer employing a tubular reactor with a total reactor volume of 3.75 mL before entering into the NMR cell (Fig. 7A), and the signal corresponding to the 1H NMR was collected at the end of each reaction cycle. After applying an autophase algorithm based on a entropy minimization of the zero and first-order phase corrections39 and a weighted least square baseline correction algorithm,40 the areas corresponding to the imine and the starting aldehyde were integrated to assess the yield of the reaction. | (1) |
| ∑xi = 1; 2 ≤ tR ≤ 10 | (2) |
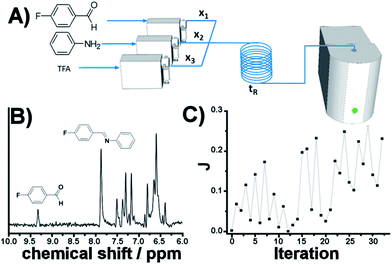 | ||
| Fig. 7 Self-optimization reaction of an imine synthesis under flow employing in-line NMR to feedback the signal. | ||
The fitness function employed was related to the space-time-yield of the reaction (eqn (1)), where Aim and Aald are the corresponding integrated areas of the imine and the aldehyde in the experimental spectra respectively; x1 corresponds to the volumetric fraction of aldehyde and tR is the residence time of the reaction mixture before reaching the detector. This fitness function aims to maximize the yield at the highest concentration of aldehyde and at the minimum possible residence time. The total reactor volume was 3.75 mL and each reaction cycle pumped a total of 5 mL of reaction mixture. The algorithm, shown graphically in Scheme 4, chooses the composition and residence time of each experiment. A volume of fluid larger than the reactor was pumped in each cycle to ensure that the steady state was achieved and the flow cell was filled with the reaction mixture. After each iteration the cell was flushed with 5 mL of CH3CN. The parameters are the composition (xi) and the residence time with boundaries between 2 and 10 minutes (eqn (2)). The reaction volume was fixed in each cycle.
A modified version of the Nelder–Mead algorithm was employed for the self-optimization.41 The simplex is allowed to expand and reduce to a minimum the number of steps required to achieve the optimum. There are 3 degrees of freedom in the system, which means that the simplex is formed by 4 randomly selected points. After evaluating these points, the system starts to optimize aiming to maximize the J value.
The imine synthesis selected is more challenging than the previous case studied. Indeed, without the addition of an acid catalyst, the reaction yield is below 15% after 10 minutes. Fig. 7B shows an example of the spectra collected, processed and employed for the self-optimization. The imine signal is stronger than the starting aldehyde, thus indicating a high degree of conversion. Throughout the iterations (Fig. 7C and Table 2) J values consistently increase, reaching a maximum value of 0.264 in iteration 29. This value is correlated with the space-time-yield (STY) and productivity.
| Entry | Iteration | x 1 | t R/min | Yield/% | J |
|---|---|---|---|---|---|
| 1 | 1 | 0.03 | 9.1 | 76.5 | 0.003 |
| 2 | 5 | 0.49 | 2 | 11.5 | 0.028 |
| 3 | 10 | 0.45 | 4.4 | 89 | 0.092 |
| 4 | 15 | 0.66 | 2 | 5.6 | 0.019 |
| 5 | 20 | 0.48 | 2 | 80.7 | 0.192 |
| 6 | 25 | 0.63 | 2 | 50.4 | 0.158 |
| 7 | 29 | 0.71 | 2 | 73.9 | 0.264 |
In fact, multiplying this J value by the concentration of the starting aldehyde solution and the molecular weight of the product a STY of 3152 kg h−1 L−1 is obtained. In the same way, multiplying this J value by the reactor volume (3.75 mL) the productivity observed is 11.82 kg h−1.
Conclusions
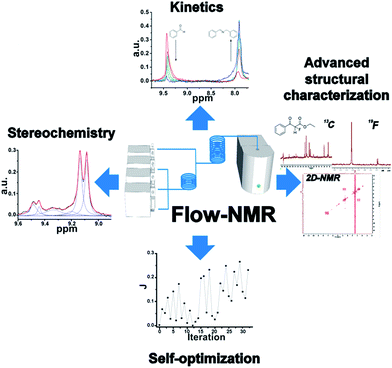
To sum up, a fully automated and novel platform incorporating flow in-line NMR has been presented. A range of applications have been demonstrated for the first time, including 13C, 19F and 2D NMR spectra of reaction mixtures under flow conditions. Furthermore, this technique allows a variety of kinetic and mechanistic studies. Finally the self-optimization of flow reactors has been demonstrated employing in-line 1H NMR. This study opens the door to the employment of benchtop NMR as an analytical tool in flow-chemistry set-ups for advanced characterization of chemical reactions in real-time and for the self-optimization of chemical processes based on single or multiple NMR signatures. Indeed, future processes allowing us to synthetically ‘dial-a-molecule’ will undoubtedly require continuous systems with feedback control.42,43 In future work we will explore the use of algorithmic control of organic synthesis not only for methodology development, but for the discovery of new compounds, as well as the optimization of time-critical processes such as the synthesis of radioactive fluorine-containing compounds under flow (Scheme 5).Conflict of interest
The authors declare no competing financial interests.Acknowledgements
This work was supported by the EPSRC (grants EP/H024107/1; EP/I033459/1; EP/J015156/1; EP/L0236521/1), University of Glasgow, and WestCHEM. LC thanks the Royal Society/Wolfson Foundation for a merit award. The authors thank Dr. Juan Perlo, and Magritek for support and fruitful discussions.Notes and references
- J. Wegner, S. Ceylan and A. Kirschning, Adv. Synth. Catal., 2012, 354, 17 CrossRef CAS.
- (a) R. L. Hartman, J. P. McMullen and K. F. Jensen, Angew. Chem., Int. Ed., 2011, 50, 7502 CrossRef CAS PubMed; (b) J. Wegner, S. Ceylan and A. Kirschning, Chem. Commun., 2011, 47, 4583 RSC.
- H. R. Sahoo, J. G. Kralj and K. F. Jensen, Angew. Chem., Int. Ed., 2007, 46, 5704 CrossRef CAS PubMed.
- V. Sans, S. Glatzel, F. J. Douglas, D. A. Maclaren, A. Lapkin and L. Cronin, Chem. Sci., 2014, 5, 1153 RSC.
- C. F. Carter, H. Lange, S. V. Ley, I. R. Baxendale, B. Wittkamp, J. G. Goode and N. L. Gaunt, Org. Process Res. Dev., 2010, 14, 393 CrossRef CAS.
- Z. Z. Qian, I. R. Baxendale and S. V. Ley, Chem.–Eur. J., 2010, 16, 12342 CrossRef CAS PubMed.
- B. V. Silva, F. A. Violante, A. C. Pinto and L. S. Santos, Rapid Commun. Mass Spectrom., 2011, 25, 423 CrossRef CAS PubMed.
- D. L. Browne, S. Wright, B. J. Deadman, S. Dunnage, I. R. Baxendale, R. M. Turner and S. V. Ley, Rapid Commun. Mass Spectrom., 2012, 26, 1999 CrossRef CAS PubMed.
- R. M. Fratila, M. V. Gomez, S. Sýkora and A. H. Velders, Nat. Commun., 2014, 5, 1 Search PubMed.
- (a) J. Yue, J. C. Schouten and T. A. Nijhuis, Ind. Eng. Chem. Res., 2012, 51, 14583 CrossRef CAS; (b) J. Bart, A. J. Kolkman, A. J. Oosthoek-de Vries, K. Koch, P. J. Nieuwland, J. W. G. Janssen, P. J. M. van Bentum, K. A. M. Ampt, F. P. J. T. Rutjes, S. S. Wijmenga, J. G. E. Gardeniers and A. P. M. Kentgens, J. Am. Chem. Soc., 2009, 131, 5014 CrossRef CAS PubMed.
- (a) A. Nordon, A. Diez-Lazaro, C. W. L. Wong, C. A. McGill, D. Littlejohn, M. Weerasinghe, D. A. Mamman, M. L. Hitchman and J. Wilkie, Analyst, 2008, 133, 339 RSC; (b) A. Nordon, C. A. McGill and D. Littlejohn, Analyst, 2001, 126, 260 RSC.
- (a) J. Y. Buser and A. D. McFarland, Chem. Commun., 2014, 50, 4234 RSC; (b) M. V. Gomez, H. H. J. Verputten, A. Díaz-Ortíz, A. Moreno, A. de la Hoz and A. H. Velders, Chem. Commun., 2010, 46, 4514 RSC.
- A. C. Barrios Sosa, R. T. Williamson, R. Conway, A. Shankar, R. Sumpter and T. Cleary, Org. Process Res. Dev., 2011, 15, 449 CrossRef CAS.
- C. Jones and C. Larive, Anal. Bioanal. Chem., 2012, 402, 61 CrossRef CAS PubMed.
- O. Gökay and K. Albert, Anal. Bioanal. Chem., 2012, 402, 647 CrossRef PubMed.
- (a) F. Dalitz, M. Cudaj, M. Maiwald and G. Guthausen, Prog. Nucl. Magn. Reson. Spectrosc., 2012, 60, 52 CrossRef CAS PubMed; (b) M. Maiwald, H. H. Fischer, Y.-K. Kim, K. Albert and H. Hasse, J. Magn. Reson., 2004, 166, 135 CrossRef CAS PubMed.
- M. A. Vargas, M. Cudaj, K. Hailu, K. Sachsenheimer and G. Guthausen, Macromolecules, 2010, 43, 5561 CrossRef CAS.
- E. Harel, Lab Chip, 2009, 9, 17 RSC.
- E. Danieli, J. Perlo, B. Blümich and F. Casanova, Angew. Chem., Int. Ed., 2010, 49, 4133 CrossRef CAS PubMed.
- E. Danieli, J. Perlo, B. Blumich and F. Casanova, Phys. Rev. Lett., 2013, 110, 180801 CrossRef CAS.
- (a) E. Danieli, J. Perlo, A. L. L. Duchateau, G. K. M. Verzijl, V. M. Litvinov, B. Blmich and F. Casanova, ChemPhysChem, 2014, 15, 3060 CrossRef CAS PubMed; (b) S. K. Kuster, E. Danieli, B. Blumich and F. Casanova, Phys. Chem. Chem. Phys., 2011, 13, 13172 RSC.
- R. W. Layer, Chem. Rev., 1963, 63, 489 CrossRef CAS.
- S. V. Luis and I. Alfonso, Acc. Chem. Res., 2014, 47, 112 CrossRef CAS PubMed.
- I. Marti, J. Rubio, M. Bolte, M. I. Burguete, C. Vicent, R. Quesada, I. Alfonso and S. V. Luis, Chem.–Eur. J., 2012, 18, 16728 CrossRef CAS PubMed.
- J. Boekhoven, J. M. Poolman, C. Maity, F. Li, L. van der Mee, C. B. Minkenberg, E. Mendes, J. H. van Esch and R. Eelkema, Nat. Chem., 2013, 5, 433 CrossRef CAS PubMed.
- J. Mosquera, S. Zarra and J. R. Nitschke, Angew. Chem., Int. Ed., 2014, 53, 1556 CrossRef CAS PubMed.
- P. J. Kitson, M. H. Rosnes, V. Sans, V. Dragone and L. Cronin, Lab Chip, 2012, 12, 3267 RSC.
- V. Dragone, V. Sans, M. H. Rosnes, P. J. Kitson and L. Cronin, Beilstein J. Org. Chem., 2013, 9, 951 CrossRef CAS PubMed.
- T. Liang, C. N. Neumann and T. Ritter, Angew. Chem., Int. Ed., 2013, 52, 8214 CrossRef CAS PubMed.
- P. T. Nyffeler, S. G. Durón, M. D. Burkart, S. P. Vincent and C.-H. Wong, Angew. Chem., Int. Ed., 2005, 44, 192 CrossRef CAS PubMed.
- C. H. Hornung, B. Hallmark, M. Baumann, I. R. Baxendale, S. V. Ley, P. Hester, P. Clayton and M. R. Mackley, Ind. Eng. Chem. Res., 2010, 49, 4576 CrossRef CAS.
- G. K. S. Prakash, Z. Zhang, F. Wang, M. Rahm, C. Ni, M. Iuliucci, R. Haiges and G. A. Olah, Chem.–Eur. J., 2014, 20, 831 CrossRef CAS PubMed.
- R. A. Skilton, A. J. Parrott, M. W. George, M. Poliakoff and R. A. Bourne, Appl. Spectrosc., 2013, 67, 1127 CrossRef CAS PubMed.
- D. N. Jumbam, R. A. Skilton, A. J. Parrott, R. A. Bourne and M. Poliakoff, J. Flow Chem., 2012, 2, 24 CrossRef CAS.
- A. J. Parrott, R. A. Bourne, G. R. Akien, D. J. Irvine and M. Poliakoff, Angew. Chem., Int. Ed., 2011, 50, 3788 CrossRef CAS PubMed.
- R. A. Bourne, R. A. Skilton, A. J. Parrott, D. J. Irvine and M. Poliakoff, Org. Process Res. Dev., 2011, 15, 932 CrossRef CAS.
- J. P. McMullen, M. T. Stone, S. L. Buchwald and K. F. Jensen, Angew. Chem., Int. Ed., 2010, 49, 7076 CrossRef CAS PubMed.
- J. P. McMullen and K. F. Jensen, Org. Process Res. Dev., 2010, 14, 1169 CrossRef CAS.
- L. Chen, Z. Weng, L. Goh and M. J. Garland, J. Magn. Reson., 2002, 158, 164 CrossRef CAS.
- P. H. C. Eilers and H. F. M. Boelens, http://www.science.uva.nl/%7Ehboelens/publications/draftpub/Eilers_2005.pdf, 2005.
- J. A. Nelder and R. Mead, Comp. J., 1965, 7, 308 CrossRef.
- D. C. Harrowven, M. Mohamed, T. P. Gonçalves, R. J. Whitby, D. Bolien and H. F. Sneddon, Angew. Chem., Int. Ed., 2012, 124, 4481 CrossRef.
- M. Peplow, Nature, 2014, 512, 20 CrossRef CAS PubMed.
Footnotes |
| † Electronic supplementary information (ESI) available: Details about the methodology, LabView scripts, experimental set-ups, additional spectra and self-optimization can be found in the SI. See DOI: 10.1039/c4sc03075c |
| ‡ The authors contributed equally. |
| This journal is © The Royal Society of Chemistry 2015 |

