 Open Access Article
Creative Commons Attribution 3.0 Unported Licence
Insights into the structure–photoreactivity relationships in well-defined perovskite ferroelectric KNbO3 nanowires†
Tingting
Zhang
ab,
Wanying
Lei
a,
Ping
Liu
c,
José A.
Rodriguez
c,
Jiaguo
Yu
d,
Yang
Qi
b,
Gang
Liu
*a and
Minghua
Liu
*a
aNational Center for Nanoscience and Technology, Beijing 100190, China. E-mail: liug@nanoctr.cn; liuminghua@nanoctr.cn
bInstitute of Materials Physics and Chemistry, School of Sciences, Northeastern University, Shenyang 110004, China
cChemistry Department, Brookhaven National Laboratory, Upton, New York 11973, USA
dState Key Laboratory of Advance Technology for Material Synthesis and Processing, Wuhan University of Technology, Wuhan 430070, China
First published on 23rd April 2015
Abstract
Structure–function correlations are a central theme in heterogeneous (photo)catalysis. In this study, the geometric and electronic structure of perovskite ferroelectric KNbO3 nanowires with respective orthorhombic and monoclinic polymorphs have been systematically addressed. By virtue of aberration-corrected scanning transmission electron microscopy, we directly visualize surface photocatalytic active sites, measure local atomic displacements at an accuracy of several picometers, and quantify ferroelectric polarization combined with first-principles calculations. The photoreactivity of the as-prepared KNbO3 nanowires is assessed toward aqueous rhodamine B degradation under UV light. A synergy between the ferroelectric polarization and electronic structure in photoreactivity enhancement is uncovered, which accounts for the prominent reactivity order: orthorhombic > monoclinic. Additionally, by identifying new photocatalytic products, rhodamine B degradation pathways involving N-deethylation and conjugated structure cleavage are proposed. Our findings not only provide new insights into the structure–photoreactivity relationships in perovskite ferroelectric photocatalysts, but also have broad implications in perovskite-based water splitting and photovoltaics, among others.
Introduction
Since Fujishima and Honda discovered photocatalytic water splitting on TiO2,1 the past decades have seen a significant rise in light-driven pollutant abatement,2–5 selective oxidation,6,7 and water splitting.8–14 Despite tremendous progress being made, the mechanisms of photocatalysis are not yet known in detail. In the conceptual framework of heterogeneous (photo)catalysis, the mechanistic understanding of structure–function relationships is a prerequisite to the rational design of efficient photocatalysts. On the other hand, semiconductor-based photocatalysis is inherently complex in that both the surface structure and bulk structure of a given photocatalyst synergistically dictate the photocatalytic efficiency:5,15 the bulk absorbs incident photons and generates e−–h+ pairs, while the surface harnesses available e−–h+ to catalyze target adsorbates at the photocatalytic active sites. To this end, a driving force (e.g., internal electronic field functional like a p–n junction) for facilitating the spatial separation of the e−–h+ pairs is desirable.16–21 Apparently, the complexity of photocatalysis hampers an atomistic understanding of structure–function relationships. For instance, most previous studies about internal electronic field-mediated photocatalysis are carried out on irregularly-shaped powders in which the active sites are unclear,22–24 making it difficult to explore structure–function relationships. Only a thorough understanding of structure–function relationships in well-defined model catalysts can add new dimensions to our fundamental view of “real world” catalysis as well as rationally design catalysts at an atomic-level.25–27 Recent advances in synthesizing nanocrystals allow for fine control of the size and shape of (photo)catalysts.28–31 To date, a great deal of studies on nanostructured photocatalysts are focused on facet-dependent photocatalysis.32–38 Nevertheless, the underlying synergetic effects involved in photocatalysis remain largely unexplored.In this study, we investigated the photocatalytic degradation of rhodamine B (RhB) in water (a model reaction in the removal of organic pollutants from waste water) by one-dimensional (1D) single-crystalline potassium niobate (KNbO3) nanowires (NWs) with respective orthorhombic and monoclinic polymorphs. KNbO3 is a typical ferroelectric perovskite (general formula ABO3, where A is a metal, B is a second metal, and O is oxygen) with diverse emerging technological applications, including photocatalysis, with the advantages of non-toxicity, cost-effectiveness and high stability under light illumination.39,40 In 1D nanostructures, it is possible to enhance the photoreactivity by tuning the transport of photogenerated charge carriers through quantum confinement.41,42 Currently, the understanding of ferroelectric materials is based primarily on theory, since few experimental techniques can be used to probe the local atomic displacements that give rise to polarization. Thanks to recent progress in aberration-corrected transmission electron microscopy (TEM),43,44 it is possible to measure local polarization displacements at an accuracy of several picometers and determine surface terminations by profile imaging. Herein, using advanced aberration-corrected scanning transmission electron microscopy (STEM), we directly visualize surface photocatalytic active sites, measure local atomic displacements at an accuracy of several picometers, and quantify ferroelectric polarization combined with spin-polarized density functional theory (DFT) calculations. We uncover a novel photocatalytic synergy between ferroelectric polarization and electronic structure, which accounts for the prominent reactivity order: orthorhombic > monoclinic. Additionally, RhB degradation pathways involving N-deethylation and conjugated structure cleavage are proposed.
Results and discussion
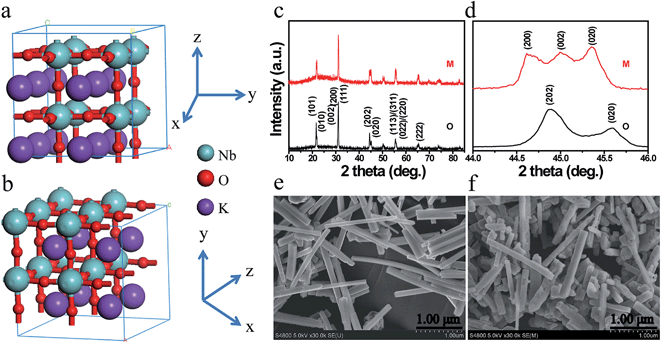
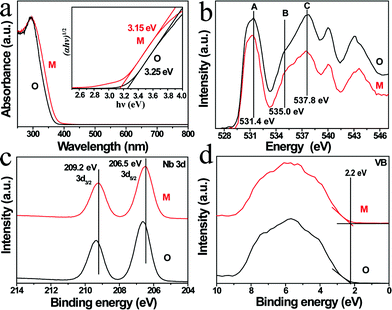
Fig. 1a and b illustrate the crystal structures of monoclinic and orthorhombic KNbO3 polymorphs, denoted as m-KNbO3 and o-KNbO3, respectively. X-ray diffraction (XRD) patterns as displayed in Fig. 1c confirm the as-prepared m-KNbO3 (space group P1m1) and o-KNbO3 (space group Bmm2, JCPDS card 71-2171) samples with comparable crystallinity, evidenced by the full-width at half-maximum (FWHM), e.g., about 0.23° for the peak at 31.5° for m-KNbO3 and o-KNbO3. High-resolution XRD in the range of 44°–46° (Fig. 1d) further indicates apparent structural differences between the above two structures. Scanning electron microscopy (SEM) images (Fig. 1e and f) show well-defined elongated m- and o-KNbO3 NWs. Combined SEM and atomic force microscopy (AFM) (Fig. S1†) measurements indicate that the average length, width, and height for the m-KNbO3 NWs are (1.3 ± 0.5) μm, (106 ± 47) nm, and (138 ± 36) nm, respectively, while for the o-KNbO3 NWs they are (1.2 ± 0.4) μm, (102 ± 27) nm, and (136 ± 17) nm, respectively. High-resolution transmission electron microscopy (HRTEM) images (Fig. S2†) prove that the m-KNbO3 NWs are enclosed by {100}, {010} and {001} facets,45 and the o-KNbO3 NWs are enclosed by {101} and {010} facets.46 The growth direction of the m- and o-KNbO3 NWs is [100] and [101], respectively. The BET specific surface area is measured to be 4.7 and 4.8 m2 g−1 for the respective m- and o-KNbO3 NWs.The photophysical property is revealed by diffuse-reflectance UV-vis (DRUV-vis) spectroscopy (Fig. 2a). The bandgap (Eg) of the KNbO3 NWs is determined using a Tauc plot (in the inset of Fig. 2a): the m- and o-KNbO3 NWs possess a bandgap of 3.15 and 3.25 eV, respectively. The bandgap of o-KNbO3 is similar to that reported in previous work (3.2 eV).47 Peak A centered at 531.4 eV is ascribed to the hybridization of O 2p with Nb 4d–t2g through π* interaction. Both peaks B and C, observed at 535.0 and 537.8 eV respectively, are attributed to the hybridization of O 2p with Nb 4d–eg (σ* interaction) and Nb 5p (π*, σ* interaction).48 The relative peak intensity ratio between A and C is dramatically decreased from m- to o-KNbO3 NWs, suggesting that the O chemical environment is different in the m- and o-KNbO3 NWs. High-resolution X-ray photoelectron spectroscopy (XPS) spectra (Fig. 2c) indicate that Nb 3d5/2 is ca. 206.5 and 206.6 eV for m- and o-KNbO3 NWs, respectively. Fig. 2d reveals that the m- and o-KNbO3 NWs present similar valence band (VB) maxima (ca. 2.2 eV) and line shape, and no detectable oxygen vacancy defects exist. Since the o-KNbO3 NWs have a greater bandgap than m-KNbO3 NWs, the conduction band (CB) minimum of the o-KNbO3 NWs should be raised with respect to that of m-KNbO3 NWs. The above results demonstrate the intrinsic differences of the geometric structure and electronic structure between the m- and o-KNbO3 NWs, albeit that they share similar size, crystallinity and specific surface area.
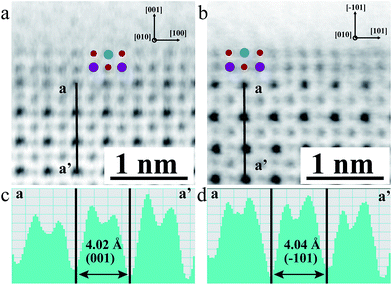
To examine the geometric structure of the m- and o-KNbO3 NWs at an atomic level, we utilized annular-bright-field (ABF)-STEM.49 In general, the contrast of ABF imaging depends on Z1/3 (Z is the atomic number) and light elements like O can be directly visualized at a subangstrom resolution.50 Therefore, the understanding of ABF imaging contrast in metal oxides is straightforward. Herein, the spots of black, dark grey and light grey correspond to NbO (ZNb = 41), K (ZK = 19) and O (ZO = 8) columns seen end-on, respectively. The representative surface structure of the m- and o-KNbO3 NWs is revealed by profile-view imaging (Fig. 3a and b) taken along the [010] direction. Cyan, red and purple symbols denote NbO, K and O columns, respectively. According to the corresponding line profiles (Fig. 3c and d), the spacing between NbO columns (4.02 Å and 4.04 Å) fits well to m-KNbO3 (001) and o-KNbO3 (![[1 with combining macron]](https://www.rsc.org/images/entities/char_0031_0304.gif) 01), respectively. The outmost surface layer of m-KNbO3 (001) and o-KNbO3 (
01), respectively. The outmost surface layer of m-KNbO3 (001) and o-KNbO3 (![[1 with combining macron]](https://www.rsc.org/images/entities/char_0031_0304.gif) 01) is NbO2 terminated, where the exposed Nb cation (denoted as Nb5c) is bonded to five oxygen anions. In general, the coordinatively unsaturated surface cations often act as active sites in heterogeneous photocatalysis.32 Additionally, neither surface relaxations nor reconstructions are observed. Other facets like {100} and {010} of m-KNbO3, and {010} of o-KNbO3, are also predominantly NbO2 terminated (data not shown).
01) is NbO2 terminated, where the exposed Nb cation (denoted as Nb5c) is bonded to five oxygen anions. In general, the coordinatively unsaturated surface cations often act as active sites in heterogeneous photocatalysis.32 Additionally, neither surface relaxations nor reconstructions are observed. Other facets like {100} and {010} of m-KNbO3, and {010} of o-KNbO3, are also predominantly NbO2 terminated (data not shown).
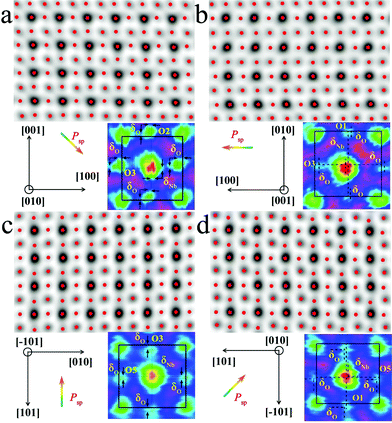
The local bulk structure of the KNbO3 NWs is directly visualized as well. To identify the precise atomic positions from ABF images at an accuracy of several picometers and then quantitatively determine the delicate structural difference, we employed Bragg filtering and the “Find Peaks” option based on Peak Pairs Analysis.51,52 The atomic column locations are obtained as coordinates (x, y) by fitting a two-dimensional (2D) quadratic function and calculating the maxima of the atomic column positions. The ABF imaging of the m- and o-KNbO3 NWs viewed along different crystallographic directions with overlaid red dots obtained by Peak Pairs Analysis in Fig. 4 clearly shows the precise atomic column positions. As schematically illustrated by representative zoom-in colour-enhanced ABF images (Fig. 4), clear atomic displacements with respect to the KNbO3 cubic structure are observed.44 For example, the zoom-in colour-enhanced ABF images in Fig. 4a show that the NbO columns shift to the lower-right and the O columns shift to the upper-left within the rectangles formed by four K columns. Table S1† displays the displacements of the Nb atoms and O atoms along different directions, denoted as δNb and δO, respectively. Herein, different O atoms are numbered according to the coordinates. The atomic displacements in the m-KNbO3 NWs of O1, O2, O3 and Nb1 are −0.12 ± 0.05, −0.11 ± 0.03, −0.10 ± 0.04 and 0.05 ± 0.03 Å along the [100] direction, and 0.11 ± 0.06, 0.10 ± 0.04, 0.11 ± 0.03 and −0.05 ± 0.04 Å along the [001] direction. No detectable displacements are probed for the Nb and O atoms along the [010] direction. As for the o-KNbO3 NWs, the atomic displacements of O1, O3, O5 and Nb1 are 0.22 ± 0.03, 0.21 ± 0.05, 0.21 ± 0.04 and −0.15 ± 0.05 Å along the [![[1 with combining macron]](https://www.rsc.org/images/entities/char_0031_0304.gif) 01] direction, and 0.21 ± 0.06, 0.20 ± 0.03, 0.21 ± 0.05 and −0.14 ± 0.04 Å along the [101] direction. Additionally, no detectable displacements are observed along the [010] direction for the Nb and O atoms. The observed difference in atomic displacements for m- and o-KNbO3 is due to the intrinsic structural discrepancy. The atomic displacements are corroborated by spin-polarized DFT calculations as shown in Tables S2 and S3,† which are in good agreement with the STEM measurements.
01] direction, and 0.21 ± 0.06, 0.20 ± 0.03, 0.21 ± 0.05 and −0.14 ± 0.04 Å along the [101] direction. Additionally, no detectable displacements are observed along the [010] direction for the Nb and O atoms. The observed difference in atomic displacements for m- and o-KNbO3 is due to the intrinsic structural discrepancy. The atomic displacements are corroborated by spin-polarized DFT calculations as shown in Tables S2 and S3,† which are in good agreement with the STEM measurements.
In the KNbO3 unit cell, spontaneous ferroelectric polarization (denoted as Psp) arises from the displacement of the positive charge center and negative charge center. K contribution to the total polarization is negligible due to the essential ionic interaction between K and O.53Psp is calculated on the basis of lattice parameters, atomic displacements and Born effective charges of the ions, while the Born effective charges are determined using spin-polarized DFT calculations.44,54 The results are shown in Tables S2 and S3.† The vector of Psp is pointed from the net negative to the net positive charge. As for m-KNbO3, the local polarization is 20 μC cm−2 along the 〈10![[1 with combining macron]](https://www.rsc.org/images/entities/char_0031_0304.gif) 〉 direction. In the case of o-KNbO3, the local polarization is 42 μC cm−2 along the 〈001〉 direction. Due to the crystal size limitations, mapping polarization domains in KNbO3 NWs by STEM imaging is difficult. Nevertheless, the delicate structural variation-derived local polarization is distinct between m- and o-KNbO3 NWs and expected to cause different photocatalysis.
〉 direction. In the case of o-KNbO3, the local polarization is 42 μC cm−2 along the 〈001〉 direction. Due to the crystal size limitations, mapping polarization domains in KNbO3 NWs by STEM imaging is difficult. Nevertheless, the delicate structural variation-derived local polarization is distinct between m- and o-KNbO3 NWs and expected to cause different photocatalysis.
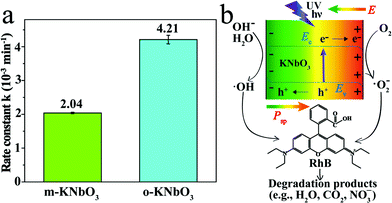
The photoreactivity of the KNbO3 NWs was assessed towards RhB degradation in water under UV light. The reaction rate constants were calculated and the results are displayed in Fig. 5a. In the absence of KNbO3, RhB degradation is negligible (data not shown). Under identical experimental conditions, the o-KNbO3 NWs displayed photoreactivity (k = 4.21 × 10⁻³ min−1) that is about two-fold as large as that of the m-KNbO3 NWs (k = 2.04 × 10⁻³ min−1). The physicochemical properties of the as-prepared KNbO3 NWs are summarized in Table 1. Furthermore, the photostability was examined and the results are shown in the ESI (Fig. S3–S5†). With regard to the reaction products concerning RhB degradation, such as total organic carbon (TOC), intermediate products, and inorganic mineralization species, detailed analyses along with proposed reaction pathways are given in the ESI (Tables S4, S5 and Fig. S6–S8).†
| Samples | Surface area [m2 g−1] | Bandgap [eV] | Exposed facets | Polarization [μC cm−2] | Density of Nb5c [atoms nm−2] | Reaction rate [ ×10−3 min−1] |
|---|---|---|---|---|---|---|
| m-KNbO3 | 4.7 | 3.15 | {010} | 20 | 5.90 | 2.04 |
| {001} | 5.92 | |||||
| {100} | 5.93 | |||||
| o-KNbO3 | 4.8 | 3.25 | {010} | 42 | 5.90 | 4.21 |
| {101} | 6.14 |
To explore the photoreactivity difference between the m- and o-KNbO3 NWs, a brief overview of photocatalytic process follows. In general, semiconductor-based photocatalysis involves three steps: the photogeneration of e−–h+ pairs, the separation and transport of e−–h+, and their reaching the surface and reaction with the adsorbates. In the first step, the electronic structure, like the bandgap of a given photocatalyst, determines the light absorption and redox potentials of photo-induced charge carriers.31 Because the o-KNbO3 NWs have a greater bandgap than the m-KNbO3 NWs, the o-KNbO3 NWs possess a higher CB minimum than the m-KNbO3 NWs and thus generate more strongly reductive electrons in photocatalysis.34 The discrepancy of electronic structure is in good agreement with structural variations between m- and o-KNbO3. The key issue in the second step is the charge pair recombination. Utilizing an internal electric field as a driving force is an emerging approach to suppress e−–h+ recombination.18,19 Recent photocatalytic studies on the effects of an internal electric field in BaTiO3,55 ZnS,56 AgI4 and BiVO4![[thin space (1/6-em)]](https://www.rsc.org/images/entities/char_2009.gif) 57 were only qualitatively discussed. In the present study, the magnitude of local polarization for m- and o-KNbO3 is determined. The o-KNbO3 NWs present polarization of 42 μC cm−2 along the 〈001〉 direction. As for m-KNbO3, the polarization is 20 μC cm−2 along the 〈10
57 were only qualitatively discussed. In the present study, the magnitude of local polarization for m- and o-KNbO3 is determined. The o-KNbO3 NWs present polarization of 42 μC cm−2 along the 〈001〉 direction. As for m-KNbO3, the polarization is 20 μC cm−2 along the 〈10![[1 with combining macron]](https://www.rsc.org/images/entities/char_0031_0304.gif) 〉 direction. As such, a positive charge on the surface is produced when polarization points from the bulk to the surface and vice versa. To compensate this bound charge, both internal screening and external screening occur.55 For internal screening, the free charge carriers in the bulk move to the opposite charged surfaces, resulting in respective downward and upward band bending on positive and negative charged surfaces as shown in Fig. 5b. The resulting band bending further provides a driving force for the spatial separation of photo-excited electrons and holes.19 External screening refers to the adsorption of molecules like RhB. Based on the above analysis, the o-KNbO3 NWs exhibit more enhanced photoreactivity than the m-KNbO3 NWs, illustrating that the greater the local polarization, the more enhanced the photoreactivity. The third step is relevant to the photocatalyst surface structure. Herein, the respective density of Nb5c for m-KNbO3 NWs {010}, {001} and {100} is 5.90, 5.92 and 5.93 atoms nm−2, very similar to 5.90 and 6.14 atoms nm−2 for {010} and {101} of the o-KNbO3 NWs. Therefore, in this work the surface structure is most likely not a leading factor in causing the distinct photocatalytic performance. Considering that the o-KNbO3 NWs are able to generate more strongly reductive electrons than their m-KNbO3 counterparts under UV light, we can conclude that both ferroelectric polarization and electronic structure synergistically dictate the photocatalytic performance. Unlike previous studies that emphasized the effects of exposed facets34–38 in photocatalysis, our results indicate that ferroelectric polarization dictates the photoreactivity by driving e− and h+ to the photocatalyst surface to trigger the photocatalytic reaction, albeit the facets of the m- and o-KNbO3 NWs expose comparable surface low-coordinate Nb density. This is, therefore, a unique route for directing the transport of photo-excited charge carriers and enhancing the photoreactivity.
〉 direction. As such, a positive charge on the surface is produced when polarization points from the bulk to the surface and vice versa. To compensate this bound charge, both internal screening and external screening occur.55 For internal screening, the free charge carriers in the bulk move to the opposite charged surfaces, resulting in respective downward and upward band bending on positive and negative charged surfaces as shown in Fig. 5b. The resulting band bending further provides a driving force for the spatial separation of photo-excited electrons and holes.19 External screening refers to the adsorption of molecules like RhB. Based on the above analysis, the o-KNbO3 NWs exhibit more enhanced photoreactivity than the m-KNbO3 NWs, illustrating that the greater the local polarization, the more enhanced the photoreactivity. The third step is relevant to the photocatalyst surface structure. Herein, the respective density of Nb5c for m-KNbO3 NWs {010}, {001} and {100} is 5.90, 5.92 and 5.93 atoms nm−2, very similar to 5.90 and 6.14 atoms nm−2 for {010} and {101} of the o-KNbO3 NWs. Therefore, in this work the surface structure is most likely not a leading factor in causing the distinct photocatalytic performance. Considering that the o-KNbO3 NWs are able to generate more strongly reductive electrons than their m-KNbO3 counterparts under UV light, we can conclude that both ferroelectric polarization and electronic structure synergistically dictate the photocatalytic performance. Unlike previous studies that emphasized the effects of exposed facets34–38 in photocatalysis, our results indicate that ferroelectric polarization dictates the photoreactivity by driving e− and h+ to the photocatalyst surface to trigger the photocatalytic reaction, albeit the facets of the m- and o-KNbO3 NWs expose comparable surface low-coordinate Nb density. This is, therefore, a unique route for directing the transport of photo-excited charge carriers and enhancing the photoreactivity.
Conclusions
In summary, with a combination of advanced ABF-STEM imaging and DFT calculations, we directly probed the atomic surface structure, measured delicate atomic displacements at an accuracy of several picometers, and quantified associated local polarization in single-crystalline m- and o-KNbO3 NWs with comparable size, crystallinity and specific surface area. Orthorhombic KNbO3 nanowires displayed RhB photodegradation about two-fold as large as their monoclinic counterparts and the underlying mechanism can be rationalized as a novel synergy of delicate atomic structural variation-derived ferroelectric polarization and electronic structure. Additionally, RhB degradation pathways are proposed, with an emphasis on N-deethylation and conjugated structure cleavage. Our results are potentially applicable to a range of perovskite ferroelectric materials functional in light-mediated environment remediation and energy production.Acknowledgements
We thank Prof. Jincai Zhao (Institute of Chemistry, CAS) and Prof. Lin Gu (Institute of Physics, CAS) for fruitful discussions. We also thank Prof. Jiaou Wang and Tao Lei for their help in the acquisition of XANES data at Beijing Synchrotron Radiation Facility of Institute of High Energy Physics, CAS. This work was supported by the National Natural Science Foundation of China (51272048, 51172040) and the Ministry of Science and Technology of China (973 Program, 2013CB632402).Notes and references
- A. Fujishima and K. Honda, Nature, 1972, 238, 37–38 CrossRef CAS PubMed.
- C. C. Chen, W. H. Ma and J. C. Zhao, Chem. Soc. Rev., 2010, 39, 4206–4219 RSC.
- R. Asahi, T. Morikawa, T. Ohwaki, K. Aoki and Y. Taga, Science, 2001, 293, 269–271 CrossRef CAS PubMed.
- Q. Kuang, X. L. Zheng and S. H. Yang, Chem.–Eur. J., 2014, 20, 2637–2645 CrossRef CAS PubMed.
- M. R. Hoffmann, S. T. Martin, W. Y. Choi and D. W. Bahnemann, Chem. Rev., 1995, 95, 69–96 CrossRef CAS.
- X. J. Lang, W. H. Ma, C. C. Chen, H. W. Ji and J. C. Zhao, Acc. Chem. Res., 2014, 47, 355–363 CrossRef CAS PubMed.
- X. M. Zhou, G. Liu, J. G. Yu and W. H. Fan, J. Mater. Chem., 2012, 22, 21337–21354 RSC.
- A. Tanaka, K. Hashimoto and H. Kominami, J. Am. Chem. Soc., 2014, 136, 586–589 CrossRef CAS PubMed.
- A. Kudo and Y. Miseki, Chem. Soc. Rev., 2009, 38, 253–278 RSC.
- K. Maeda, K. Teramura, D. L. Lu, T. Takata, N. Saito, Y. Inoue and K. Domen, Nature, 2006, 440, 295 CrossRef CAS PubMed.
- X. B. Chen, S. H. Shen, L. J. Guo and S. S. Mao, Chem. Rev., 2010, 110, 6503–6570 CrossRef CAS PubMed.
- F. E. Osterloh, Chem. Soc. Rev., 2013, 42, 2294–2320 RSC.
- T. Hisatomi, J. Kubota and K. Domen, Chem. Soc. Rev., 2014, 43, 7520–7535 RSC.
- S. Li, J. M. Zhang, M. G. Kibria, Z. T. Mi, M. Chaker, D. L. Ma, R. Nechache and F. Rosei, Chem. Commun., 2013, 49, 5856–5858 RSC.
- A. Hagfeldt and M. Grätzel, Chem. Rev., 1995, 95, 49–68 CrossRef CAS.
- Y. Q. Qu and X. F. Duan, Chem. Soc. Rev., 2013, 42, 2568–2580 RSC.
- R. G. Li, F. X. Zhang, D. G. Wang, J. X. Yang, M. R. Li, J. Zhu, X. Zhou, H. X. Han and C. Li, Nat. Commun., 2013, 4, 1432 CrossRef PubMed.
- C. R. Bowen, H. A. Kim, P. M. Weaver and S. Dunn, Energy Environ. Sci., 2014, 7, 25–44 CAS.
- L. Li, P. A. Salvador and G. S. Rohrer, Nanoscale, 2014, 6, 24–42 RSC.
- C. Hengky, X. Moya, N. D. Mathur and S. Dunn, RSC Adv., 2012, 2, 11843–11849 RSC.
- M. Stock and S. Dunn, J. Phys. Chem. C, 2012, 116, 20854–20859 CAS.
- S. Park, C. W. Lee, M. G. Kang, S. Kim, H. J. Kim, J. E. Kwon, S. Y. Park, C. Y. Kang, K. S. Hong and K. T. Nam, Phys. Chem. Chem. Phys., 2014, 16, 10408–10413 RSC.
- Z. Z. Lou, B. B. Huang, Z. Y. Wang, X. C. Ma, R. Zhang, X. Y. Zhang, X. Y. Qin, Y. Dai and M. H. Whangbo, Chem. Mater., 2014, 26, 3873–3875 CrossRef CAS.
- X. Y. Fan, L. Zang, M. Zhang, H. S. Qiu, Z. Wang, J. Yin, H. Z. Jia, S. L. Pan and C. Y. Wang, Chem. Mater., 2014, 26, 3169–3174 CrossRef CAS.
- C. T. Campbell, Top. Catal., 2013, 56, 1273–1276 CrossRef CAS PubMed.
- V. Subramanian, E. E. Wolf and P. V. Kamat, J. Am. Chem. Soc., 2004, 126, 4943–4950 CrossRef CAS PubMed.
- S. Chen, J. J. Duan, M. Jaroniec and S. Z. Qiao, Adv. Mater., 2014, 26, 2925–2930 CrossRef CAS PubMed.
- Y. M. Li and G. A. Somorjai, Nano Lett., 2010, 10, 2289–2295 CrossRef CAS PubMed.
- H. G. Yang, C. H. Sun, S. Z. Qiao, J. Zou, G. Liu, S. C. Smith, H. M. Cheng and G. Q. Lu, Nature, 2008, 453, 638–641 CrossRef CAS PubMed.
- Y. D. Yin and D. Talapin, Chem. Soc. Rev., 2013, 42, 2484–2487 RSC.
- H. Tong, S. X. Ouyang, Y. P. Bi, N. Umezawa, M. Oshikiri and J. H. Ye, Adv. Mater., 2012, 24, 229–251 CrossRef CAS PubMed.
- X. M. Zhou, J. Y. Lan, G. Liu, K. Deng, Y. L. Yang, G. J. Nie, J. G. Yu and L. J. Zhi, Angew. Chem., Int. Ed., 2012, 51, 178–182 CrossRef CAS PubMed.
- X. M. Zhou, Q. L. Xu, W. Y. Lei, T. T. Zhang, X. Y. Qi, G. Liu, K. Deng and J. G. Yu, Small, 2014, 10, 674–679 CrossRef CAS PubMed.
- J. Pan, G. Liu, G. Q. Lu and H. M. Cheng, Angew. Chem., Int. Ed., 2011, 50, 2133–2137 CrossRef CAS PubMed.
- A. Selloni, Nat. Mater., 2008, 7, 613–615 CrossRef CAS PubMed.
- Y. P. Bi, S. X. Ouyang, N. Umezawa, J. Y. Cao and J. H. Ye, J. Am. Chem. Soc., 2011, 133, 6490–6492 CrossRef CAS PubMed.
- Z. B. Jiao, Y. Zhang, H. C. Yu, G. X. Lu, J. H. Ye and Y. P. Bi, Chem. Commun., 2013, 49, 636–638 RSC.
- D. J. Martin, N. Umezawa, X. W. Chen, J. H. Ye and J. W. Tang, Energy Environ. Sci., 2013, 6, 3380–3386 CAS.
- T. T. Zhang, K. Zhao, J. G. Yu, J. Jin, Y. Qi, H. Q. Li, X. J. Hou and G. Liu, Nanoscale, 2013, 5, 8375–8383 RSC.
- M. A. Peña and J. L. G. Fierro, Chem. Rev., 2001, 101, 1981–2017 CrossRef PubMed.
- L. Vayssieres, C. Sathe, S. M. Butorin, D. K. Shuh, J. Nordgren and J. H. Guo, Adv. Mater., 2007, 17, 2320–2323 CrossRef PubMed.
- S. K. Mohapatra, S. E. John, S. Banerjee and M. Misra, Chem. Mater., 2009, 21, 3048–3055 CrossRef CAS.
- K. W. Urban, Science, 2008, 321, 506–510 CrossRef CAS PubMed.
- C. L. Jia, S. B. Mi, K. Urban, I. Vrejoiu, M. Alexe and D. Hesse, Nat. Mater., 2008, 7, 57–61 CrossRef CAS PubMed.
- S. Kim, J. H. Lee, J. Lee, S. W. Kim, M. H. Kim, S. Park, H. Chung, Y. I. Kim and W. Kim, J. Am. Chem. Soc., 2013, 135, 6–9 CrossRef CAS PubMed.
- J. Y. Lan, X. M. Zhou, G. Liu, J. G. Yu, J. C. Zhang, L. J. Zhi and G. J. Nie, Nanoscale, 2011, 3, 5161–5167 RSC.
- Q. P. Ding, Y. P. Yuan, X. Xiong, R. P. Li, H. B. Huang, Z. S. Li, T. Yu, Z. G. Zou and S. G. Yang, J. Phys. Chem. C, 2008, 112, 18846–18848 CAS.
- L. Douillard, F. Jollet, C. Bellin, M. Gautier and J. P. Duraud, J. Phys.: Condens. Matter, 1994, 6, 5039–5052 CrossRef CAS.
- S. J. Pennycook and D. E. Jesson, Phys. Rev. Lett., 1990, 64, 938–941 CrossRef CAS.
- Y. Sun, L. Zhao, H. L. Pan, X. Lu, L. Gu, Y. S. Hu, H. Li, M. Armand, Y. Ikuhara, L. Q. Chen and X. J. Huang, Nat. Commun., 2013, 4, 1870 CrossRef PubMed.
- P. L. Galindo, S. Kret, A. M. Sanchez, J. Y. Laval, A. Yáñez, J. Pizarro, E. Guerrero, T. Ben and S. I. Molina, Ultramicroscopy, 2007, 107, 1186–1193 CrossRef CAS PubMed.
- P. Galindo, J. Pizarro, S. Molina and K. Ishizuka, Microsc. Anal., 2009, 23, 23–25 Search PubMed.
- J. Shi, I. Grinberg, X. L. Wang and A. M. Rappe, Phys. Rev. B: Condens. Matter Mater. Phys., 2014, 89, 094105 CrossRef.
- L. Y. Li, Z. F. Gan, M. R. McCartney, H. S. Liang, H. B. Yu, W. J. Yin, Y. F. Yan, Y. H. Gao, J. B. Wang and D. J. Smith, Adv. Mater., 2014, 26, 1052–1057 CrossRef CAS PubMed.
- Y. F. Cui, J. Briscoe and S. Dunn, Chem. Mater., 2013, 25, 4215–4223 CrossRef CAS.
- Y. P. Hong, J. Zhang, X. Wang, Y. J. Wang, Z. Lin, J. G. Yu and F. Huang, Nanoscale, 2012, 4, 2859–2862 RSC.
- R. Munprom, P. A. Salvador and G. S. Rohrer, Chem. Mater., 2014, 26, 2774–2776 CrossRef CAS.
Footnote |
| † Electronic supplementary information (ESI) available: Additional figures and tables, synthetic procedures, theoretical calculation methods, experimental details for XRD, spectroscopy (XPS, XANES and UV-vis), microscopy (AFM, SEM, HRTEM and STEM) and photocatalytic experiments. See DOI: 10.1039/c5sc00766f |
| This journal is © The Royal Society of Chemistry 2015 |

