 Open Access Article
Creative Commons Attribution 3.0 Unported Licence
Solar-microbial hybrid device based on oxygen-deficient niobium pentoxide anodes for sustainable hydrogen production†
Mingyang
Li
a,
Xinjun
He
a,
Yinxiang
Zeng
a,
Meiqiong
Chen
ab,
Ziyang
Zhang
a,
Hao
Yang
a,
Pingping
Fang
*a,
Xihong
Lu
*a and
Yexiang
Tong
*a
aKLGHEI of Environment and Energy Chemistry, MOE of the Key Laboratory of Bioinorganic and Synthetic Chemistry, School of Chemistry and Chemical Engineering, Sun Yat-Sen University, Guangzhou 510275, China. E-mail: fangpp3@mail.sysu.edu.cn; luxh6@mail.sysu.edu.cn; chedhx@mail.sysu.edu.cn
bDongguan Key Laboratory of Green Energy, City College of Dongguan University of Technology, Wenchang Road, Dongguan, 523419 China
First published on 18th September 2015
Abstract
Hydrogen gas is emerging as an attractive fuel with high energy density for the direction of energy resources in the future. Designing integrated devices based on a photoelectrochemical (PEC) cell and a microbial fuel cell (MFC) represents a promising strategy to produce hydrogen fuel at a low price. In this work, we demonstrate a new solar-microbial (PEC–MFC) hybrid device based on the oxygen-deficient Nb2O5 nanoporous (Nb2O5−x NPs) anodes for sustainable hydrogen generation without external bias for the first time. Owing to the improved conductivity and porous structure, the as-prepared Nb2O5−x NPs film yields a remarkable photocurrent density of 0.9 mA cm−2 at 0.6 V (vs. SCE) in 1 M KOH aqueous solution under light irradiation, and can achieve a maximum power density of 1196 mW m−2 when used as an anode in a MFC device. More importantly, a solar-microbial hybrid system by combining a PEC cell with a MFC is designed, in which the Nb2O5−x NPs electrodes function as both anodes. The as-fabricated PEC–MFC hybrid device can simultaneously realize electricity and hydrogen using organic matter and solar light at zero external bias. This novel design and attempt might provide guidance for other materials to convert and store energy.
1. Introduction
The rational utilization of renewable and clean energy has drawn more and more attention due to the increasing energy demands and ever-growing environmental concerns. Producing hydrogen by photoelectrochemical (PEC) water splitting over a semiconductor photoelectrode is emerging as the most promising way that can directly convert solar energy into clean hydrogen.1–3 Hydrogen from water splitting is known to be a thermodynamically uphill or endothermic process and can be described as the following equation:| H2O(l) → H2(g) + 1/2O2(g), E0 = 1.23 V vs. NHE | (1) |
To drive this reaction, a minimal energy of 237.2 kJ mol−1 that is equal to a potential of 1.23 V vs. NHE is required.2,3 In this respect, it requires the conduction band (CB) and valence band (VB) edges of the photoelectrode to straddle the reduction and oxidation potentials of water. Specifically, ECB should be above Ered (H2/H+) and EVB should be below Eox (OH−/O2). Besides having suitable band edge positions, an ideal photoelectrode material for efficient solar water splitting should also possess strong light-harvesting ability, good chemical stability, fast charge transport and low cost.4–6 However, most of the developed photoelectrodes cannot satisfy these requirements simultaneously. On the other hand, an external bias is always needed for practical applications to improve their charge separation and/or overcome an overpotential for the low lying CB edge, which leads to increased cost of hydrogen production.7–10 In order to address the above-mentioned energy loss, numerous efforts have been devoted to designing nanostructured photoelectrodes and catalysts as well as optimizing the PEC configuration.11–13 Nevertheless, the current efficiency of PEC water splitting is still not satisfactory for its high energy demand.14,15 Alternatively, the energy required for water splitting obtained from a renewable energy source is a more cost-effective approach to generate hydrogen.
Microbial fuel cells (MFCs) are of great interest since they can directly produce electricity from organic waste and biomass at a low cost. MFCs are bioelectrochemical devices that can convert chemical energy stored in organic matter into electricity with the help of microorganisms.16–23 This feature makes them very attractive as a green energy supply to overcome the thermodynamic constraints and compensate for the energy loss of PEC water splitting. Recently, Wang et al. demonstrated that the hydrogen gas could be continuously produced based on solar light and biomass recycling through coupling PEC water splitting with a TiO2 nanowire-arrayed photoanode and microbial electrohydrogenesis with Shewanella oneidensis MR-1 in a PEC–MFC hybrid device.16 Despite these achievements, the unsatisfactory performances of the current MFCs and PEC cells are the main obstacles for their practical applications. The electrode material is the most key factor that determines the performances of both the MFCs and PEC cells.16–19,24–27 Therefore, the exploration and development of an advanced electrode material for improving the efficiency of PEC cells and the output power density of the MFCs are highly desirable.
In this work, we demonstrate the feasibility of oxygen-deficient Nb2O5 nanoporous (Nb2O5−x NPs) films as a high-performance anode material for both the PEC cells and MFCs. Nb2O5 is one of the most important n-type semiconductor materials for dye-sensitized solar cells and photocatalysts in terms of its excellent photoactivity, non-toxicity and environmental friendliness.28–33 It has a similar bandgap to TiO2 and ZnO, and favourable band-edge positions that can straddle the redox potential of water photoelectrolysis. Moreover, recent reports have shown that Nb2O5 possesses better biocompatibility than TiO2 and higher stability than ZnO (amphoteric oxide).34,35 All of these characteristic features make it a very promising photoanode and anode for PEC cells and MFCs, respectively. However, Nb2O5 suffers from poor electrical conductivity, which seriously limits its wide applications. Herein, we developed a facile approach to significantly boost the conductivity of Nb2O5 by creating oxygen vacancies. Nb2O5−x NPs films were readily obtained by anodic oxidation of Nb foil and hydrogenation treatment. Benefiting from the appropriate bandgap, suitable band levels, improved conductivity and good biocompatibility, the Nb2O5−x NPs films exhibited superior performances in both the PEC cells and MFCs. The Nb2O5−x photoanode achieved a remarkable photocurrent density of 0.9 mA cm−2 at 0.6 V (vs. SCE) in 1 M KOH aqueous solution, and the MFCs with the Nb2O5−x NPs anodes (denoted as Nb2O5−x-MFCs) exhibited a maximum power density of 1196 mW m−2. More interestingly, a PEC–MFC hybrid device, by interfacing a Nb2O5−x-based PEC device and a Nb2O5−x-based MFC device, was designed and continuous hydrogen gas could be produced at zero external bias by biodegradable organic matter and solar light.
2. Experimental section
2.1 Fabrication of Nb2O5 and Nb2O5−x NPs films
Nb2O5 NPs films were synthesized by the simple electrochemical anodization of Nb films. Before the anodization, the Nb film was washed by ultrasonication in acetone, ethanol and then deionized water successively. The Nb film was anodized at an applied potential of 20 V for 30 min at room temperature, with the Nb film as the working electrode and a graphite rod of about 4.0 cm2 as the cathode in a glycerol aqueous solution (90 vol% glycerol![[thin space (1/6-em)]](https://www.rsc.org/images/entities/char_2009.gif) :
:![[thin space (1/6-em)]](https://www.rsc.org/images/entities/char_2009.gif) 10 vol% H2O) containing 1.5% NH4F. The as-prepared Nb2O5 NPs films were cleaned with ethanol and DI water, and then were annealed at 450 °C for 60 min in air to enhance the mechanical stability and crystallinity. Finally, the Nb2O5−x NPs films were obtained by annealing the Nb2O5 NPs films in a hydrogen atmosphere at various temperatures ranging from 450–550 °C for 60 min. Thermal treatment was performed in a home-built tube furnace filled with ultrahigh purity hydrogen gas.
10 vol% H2O) containing 1.5% NH4F. The as-prepared Nb2O5 NPs films were cleaned with ethanol and DI water, and then were annealed at 450 °C for 60 min in air to enhance the mechanical stability and crystallinity. Finally, the Nb2O5−x NPs films were obtained by annealing the Nb2O5 NPs films in a hydrogen atmosphere at various temperatures ranging from 450–550 °C for 60 min. Thermal treatment was performed in a home-built tube furnace filled with ultrahigh purity hydrogen gas.
2.2 Fabrication of MFC
At first, E. coli K-12 (ATCC 25922) was cultured at 37 °C in a fertile medium (a mixture of 10.0 peptone, 5.0 g NaCl and 3.0 g beef powder per liter) in an anaerobic test tube, which was sterilized at 121 °C in an autoclave for 20 min in advance. Secondly, 10 mL of the E. coli K-12 culture medium was inoculated into the nitrogen saturated anolyte, after growing for 18 h in the incubator. A cubic MFC with a single chamber (4 cm × 5 cm × 5 cm) was used in this work, which consists of a polymethyl methacrylate chamber and a membrane cathode assembly on one side (4 cm × 4 cm). The sample electrodes (4 cm × 4 cm) were directly used as the anodes. The cathode was prepared by hot-pressing carbon paper on one side of a cation exchange membrane (CEM). The carbon paper cathode was pasted with 12.5 mg cm−3 commercial Pt-catalyst (40 wt% Pt/C) in a mixture of Nafion (5%). Phosphate-buffered basal medium (PBBM) with 5 mM HNQ, 10.0 g glucose and 5.0 g yeast extract per liter was used as the anolyte. The PBBM consisted of 8 g NaCl, 0.2 g KCl, 3.63 g Na2HPO4·12H2O, and 0.24 g KH2PO4 per litre. To remove the possible metal and biomass contamination, the cell was washed with 1 mol L−1 HCl and 1 mol L−1 NaOH and rinsed with sterile water before the inoculation.2.3 Material characterization
The surface structure, morphology and composition of the samples were characterized by scanning electron microscopy (SEM, Quanta 400), X-ray diffraction (XRD, Bruker, D8 ADVANCE) with Cu Kα radiation (λ = 1.5418 Å), and transmission electron microscopy (TEM, JEM2010-HR). X-Ray Photoelectron Spectroscopy (XPS, ESCALab250) with 200 W Al Kα radiation was used to measure the chemical bonding state and chemical state of the samples. The C 1s peak at 284.8 eV from adventitious carbon was regarded as the energy reference. Raman spectroscopy was conducted on a Laser Micro-Raman Spectrometer (Renishaw inVia) using a visible laser (λ = 514.5 nm) with an output laser power of 50 mW as the excitation wavelength at room temperature. The optical properties of the products were measured with a UV-Vis-NIR spectrophotometer (UV, Shimadzu UV-3150). EPR spectra were studied on powdered products by a conventional Bruker spectrometer (Bruker, A300-10-12) operating at an X-band frequency and magnetic field modulation of 100 kHz, with a microwave power of 2.23 mW and a modulation amplitude of 8 G at 88 K. The resonance lines were simulated by the Bruker WINEPR SimFonia program.2.4 Photoelectrochemical and electrochemical measurements
PEC measurements were carried out in a three-electrode cell with a flat quartz window to facilitate illumination of the photoelectrode surface. The Pt foil electrode and a saturated calomel electrode were used as the counter and reference electrode, respectively. A 1.0 M NaOH aqueous solution was used as the electrolyte, and the illumination source was a 150 W xenon lamp coupled with an AM 1.5G filter. Additionally, a 1.0 M NaOH aqueous solution with 10.0 g glucose per liter was used in the control experiment. Incident photon to current conversion efficiencies (IPCE) were collected by a CHI 760D electrochemical station with a solar simulator (Newport 69920, 1000 W xenon lamp), coupled with an infrared water filter (Oriel 6127) and aligned monochromator (Oriel Cornerstone 130 1/8 m). To quantitatively reveal the interplay between the photoactivity and light absorption, incident photon to current conversion efficiencies (IPCE) were measured on the Nb2O5 and Nb2O5−x NPs photoanodes at 0.2 V vs. SCE. IPCE can be expressed by the equation:| IPCE = (1240I)/(λJlight) | (2) |
3. Results and discussion
3.1 Synthesis and characterization of Nb2O5−x NPs films
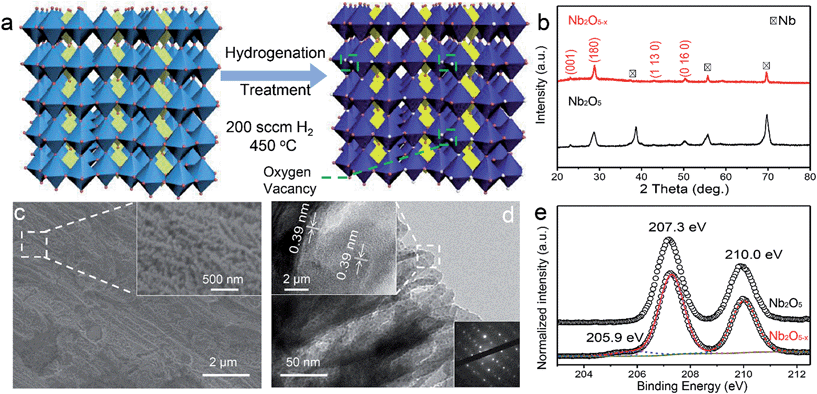
Nb2O5−x NPs films were obtained through a two-step procedure, which involves the anodic oxidation of Nb foil and heat treatment in a hydrogen atmosphere. Firstly, the Nb2O5 NPs films were synthesized on a niobium film substrate by a simple anodic oxidation method and annealed in air at 450 °C (Experimental section). The SEM images show that the white homogeneous film obtained on the metal substrate is composed of dense nanoporous arrays with ∼50 nm diameter (Fig. S1, ESI†). To introduce oxygen vacancies into the Nb2O5 NPs films, the as-prepared Nb2O5 NPs films were then annealed in a hydrogen atmosphere for an additional 60 min at 500 °C. The synthetic process of the hydrogen treatment is illustrated in Fig. 1a. After the treatment, the film colour changed from white to blue (Fig. S2, ESI†), suggesting a possible modification in the crystal structure. To identify the possible phase transformation, XRD patterns of the Nb2O5 and Nb2O5−x NPs films are shown in Fig. 1b. Sharp diffraction peaks centered at 2θ angles of 22.6°, 28.4° and 50.8°, corresponding to the (001), (180) and (0 16 0) planes of Nb2O5 (JCPDS #30-0873), are observed for both samples, indicating that the NPs films are well crystalline with a similar phase. SEM studies also reveal there are no obvious morphological changes for the Nb2O5−x NPs film after the hydrogenation (Fig. 1c). Fig. 1d displays the TEM image and the selected-area electron diffraction (SAED) of the Nb2O5−x NPs film. The TEM image obviously shows that the porous Nb2O5−x sample consists of the nanoporous arrays. The clear lattice fringes with a spacing of 0.39 nm are indexed to the (001) plane of the orthorhombic Nb2O5 samples. Meanwhile, the bright and well-arranged diffraction spots further confirm the highly crystalline nature of the Nb2O5−x NPs film.The UV-visible absorption spectra of Nb2O5 and Nb2O5−x NPs films were collected to investigate the influence of hydrogenation on the optical absorption (Fig. S2, ESI†). Both of the samples exhibit similar light absorption in the UV region and the Nb2O5−x NPs film shows substantially higher absorption when compared to pristine Nb2O5 in the region of 400–800 nm, which suggests Nb2O5−x may absorb more visible light. The band gap of the Nb2O5−x NPs film is calculated to be 3.26 eV, while it is 3.35 eV for the pristine Nb2O5 NPs film, indicating the hydrogenation has a negligible effect on its band gap. To further investigate the effect of the hydrogen treatment on the chemical state of Nb2O5, XPS analysis was performed. The XPS survey of the Nb2O5−x NPs film was collected to prove that no other impurities were introduced after the hydrogen treatment (Fig. S3, ESI†). Fig. 1e displays the normalized high resolution Nb 3d core level XPS spectra. Both of the samples have two peaks located at 207.3 and 210 eV, which are ascribed to the regular Nb 3d signals for Nb5+.36,37 Remarkably, the Nb2O5−x NPs film displays an additional peak which emerged at the lower binding energy of 205.9 eV, which is the typical peak position for the low charge Nb4+.38–40 The presence of Nb4+ in the Nb2O5−x NPs film also had been regarded as the reason why the film’s colour changed from white to blue after the hydrogenation (Fig. S2, ESI†).41–43Fig. 2a compares the normalized O 1s core level XPS spectra of the Nb2O5 and Nb2O5−x NPs samples. Significantly, the Nb2O5−x NPs film shows a broader peak at around 531.68 eV than that of the Nb2O5 NPs film, indicating it has more oxygen vacancies than the Nb2O5 NPs film.40,44–48 This is also confirmed by the electron paramagnetic resonance (EPR) analysis. The broader peaks at g = 2.15 and 2.02 in Fig. 2b clearly reveal the density of oxygen vacancies in the Nb2O5−x NPs film is much higher than that in the Nb2O5 NPs film.49,50
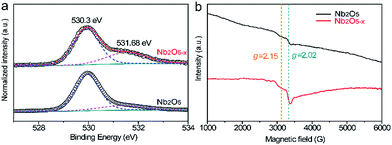 | ||
| Fig. 2 (a) Normalized O 1s core-level XPS and (b) EPR spectra collected for Nb2O5 and Nb2O5−x NPs films. | ||
Electrochemical impedance measurements were carried out to verify our hypothesis that the induced oxygen vacancy can serve as a shallow donor to increase the carrier density of Nb2O5. Fig. 3a displays the Mott–Schottky plots of the electrodes at a frequency of 1 kHz in the dark, which are generated based on capacitances that derived from the electrochemical impedance. Both the Nb2O5 and Nb2O5−x NPs films show positive slopes, in line with the characteristic of a n-type semiconductor. Notably, the Nb2O5−x NPs film shows a substantially smaller slope for the Mott–Schottky plot than the Nb2O5 NPs film, suggesting a significantly increased donor density, based on the following equation:
| Nd = (2/e0εε0)[d(1/C2)/dV]−1 | (3) |
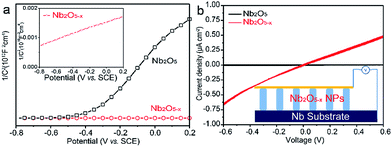 | ||
| Fig. 3 (a) Mott–Schottky plots of Nb2O5 and Nb2O5−x NPs films at a frequency of 1 kHz in the dark; (b) comparison of I–V curves of the samples; the inset is the schematic of the measurement. | ||
3.2 Performances of PEC devices based on Nb2O5−x photoanodes
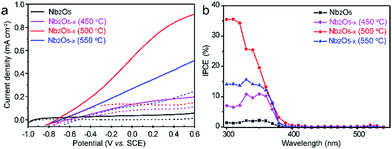
The PEC performances of the Nb2O5 samples were measured in a three electrode electrochemical cell with a 1.0 M NaOH solution as the electrolyte. For optimizing the PEC performance of the Nb2O5−x NPs film, the effect of the hydrogenation temperature was studied. Fig. 4a shows the linear sweep curves (LSV) of the pristine Nb2O5 and Nb2O5−x NPs films obtained at different hydrogenation temperatures. The photocurrent density of the Nb2O5 NPs film is 0.05 mA cm−2 at 0.6 V vs. SCE, which is close to the value reported previously.36 The photocurrent densities of the Nb2O5−x NPs films increase gradually with the increase of the hydrogen treatment temperature from 450 to 500 °C. The Nb2O5−x (500 °C) NPs film achieves a maximum value of 0.9 mA cm−2 at 0.6 V vs. SCE, which is about a 20-fold enhancement compared to the Nb2O5 NPs film at the same potential. This photocurrent density is also dramatically higher than the values recently reported for the reported values of Nb2O5 photoanodes, such as N-doped Nb2O5 nanostructures (Table S1†).36,51–53 Photocurrent densities decrease gradually with the rising temperature when the annealing temperature is above 500 °C. According to the increasing donor density and conductivity of the Nb2O5−x with the rising hydrogenation temperature (Fig. S4, ESI†), it can be concluded that excessive oxygen vacancies will serve as recombination centres for electrons and holes, resulting in a poor PEC performance, in agreement with other work.54 To quantitate the interplay between the photoactivity and light absorption, incident photon to current conversion efficiencies (IPCE) were measured for the Nb2O5 and Nb2O5−x NPs photoanodes at 0.2 V vs. SCE (Fig. 4b). All of the Nb2O5−x NPs films show significantly enhanced photoactivity over the entire UV region, and the Nb2O5−x NPs film hydrogenated at 500 °C exhibits the best IPCE efficiency in the wavelength range from 300 to 380 nm. Additionally, the IPCE values decrease from 35% at 300 nm to 1% at 400 nm, and we did not observe any photoactivity in the visible light region beyond 400 nm, indicating that the observed colour change is not because of the band gap modification of Nb2O5 or the transition between the impurity states and conduction/valence band edges.47 Thus, we believe that the photoactivity enhancement of the Nb2O5−x NPs film is because of the increased donor density and conductivity originating from the induced oxygen vacancies generated during the hydrogenation.3.3 Performances of the MFC devices based on the Nb2O5−x anodes
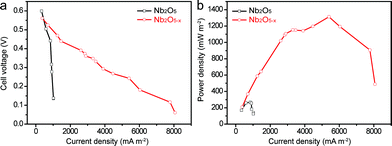
To demonstrate that the as-prepared Nb2O5−x NPs film is also a promising candidate as a high-performance anode material for a MFC device, a simple MFC device was assembled using the Nb2O5−x NPs film hydrogenated at 500 °C as the anode and a 40 wt% Pt/C loaded carbon paper as the air cathode in the E. coli MFCs (denoted as Nb2O5−x-MFC, Experimental section). For a better comparison, the performance of the pristine Nb2O5 NPs film in the MFC device was also measured (denoted as Nb2O5-MFC). Fig. 5a and b depict the comparison of the polarization curves and power outputs tested by loading various external resistances. In comparison to the Nb2O5-MFC, the cell voltage of the Nb2O5−x-MFC decreased more slowly with the decreased loaded resistance and gently, indicating the superior performance of the Nb2O5−x NPs anode. Furthermore, the Nb2O5−x-MFC achieved a remarkable maximum power density of 1196 mW m−2 at a current density of 4465 mA m−2, which is substantially higher than that of the Nb2O5-MFC (140 mW m−2). The distinct enhancement between the Nb2O5 and Nb2O5−x MFC devices can be ascribed to the superior conductivity of the Nb2O5−x NPs anode. Additionally, without E. coli, the Nb2O5−x-MFC device shows negligible cell voltage and output power density when loading the external resistances (Fig. S5†), indicating E. coli is very important for power production.3.4 Performances of PEC–MFC hybrid devices based on Nb2O5−x anodes
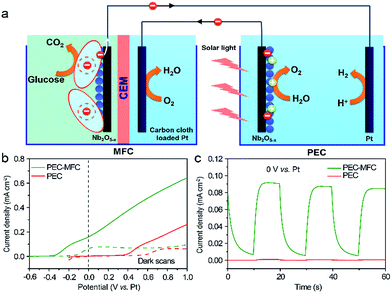
For taking full advantage of the oxygen-deficient electrodes, we assembled a PEC–MFC hybrid device to convert and store energy using the Nb2O5−x NPs film as the anode in both the MFC and the PEC cell (Experimental section). The PEC properties of Nb2O5−x NPs film were measured in a two-electrode electrochemical cell with/without the MFC devices in the dark and under 1 sun illumination. Fig. 6a shows the schematic configuration of the integrated PEC–MFC hybrid device. By coupling the PEC and MFC devices in series, the Nb2O5−x anode in the MFC provides a biovoltage that shifted the potential of the illuminated Nb2O5−x photoanode near to −0.6 V, thus, enabling water splitting to occur at zero external bias (Fig. 6b). The PEC–MFC device displays a novel photocurrent density of 0.18 mA cm−2 at zero bias (0 V vs. Pt), which is substantially larger than the one obtained from the PEC cell alone at the same potential (Fig. 6b). More importantly, gas bubbles were clearly observed to be continuously evolving on the Pt electrode under light illumination (Fig. S6 and Video S1, ESI†), indicating the generation of hydrogen. Meanwhile, the PEC device in the presence of glucose, possessing a lower performance than the hybrid device, was also conducted to emphasize the excellent energy efficiency via this PEC–MFC hybrid device (Fig. S7†). There is no doubt that the Nb2O5−x NPs film is an outstanding material and its merits can be integrated into both a PEC cell, MFC and a hybrid device and this hybrid device is an efficient strategy to convert and store energy. The PEC–MFC device also exhibits reproducible photocurrent generation in response to light illumination (Fig. 6c), implying the hybrid device is feasible to produce hydrogen. To the best of our knowledge, this is the first demonstration of using PEC–MFC hybrid devices based on the same anode material to generate hydrogen at zero external bias.4. Conclusions
In summary, we developed a facile and effective method to significantly improve the conductivity and performances of the Nb2O5−x NPs films in PEC cells and MFCs through the introduction of oxygen vacancies. The Nb2O5−x NPs photoanode achieved a remarkable photocurrent density of 0.9 mA cm−2 at 0.6 V (vs. SCE) in a 1 M KOH aqueous solution. Meanwhile, the Nb2O5−x-MFC exhibited a superior power density of 1196 mW m−2 when the Nb2O5−x NPs film was used as an anode in the MFC cell. The oxygen vacancy plays a critical role in enhancing the effective charge transport of the electrodes, as well as increasing the conductivity. Moreover, we also demonstrated that the PEC–MFC hybrid device with the Nb2O5−x NPs anodes in both devices is feasible and could produce hydrogen even at zero external bias (0 V vs. Pt) under illumination. To our best knowledge, it is the first report about the applications of Nb2O5 materials in an integrated PEC–MFC device to produce hydrogen without an external bias, by just using organic matter and solar light. This environmentally friendly and novel design provides a promising research direction for the future development of energy conversion and storage.Acknowledgements
This work was supported by the Natural Science Foundations of China (21476271, 2141101037, 21405182, 21403306, and J1103305), Guangdong Natural Science Foundation for Distinguished Young Scholar (2014A030306048), the Research Fund for the Doctoral Program of Higher Education of China (20120171110043), and the Fundamental Research Foundations for the Central Universities (15lgpy24).Notes and references
- A. Fujishima and K. Honda, Nature, 1972, 238, 37–38 CrossRef CAS PubMed.
- X. Wang, K. Q. Peng, Y. Hu, F. Q. Zhang, B. Hu, L. Li, M. Wang, X. M. Meng and S. T. Lee, Nano Lett., 2014, 14, 18–23 CrossRef CAS PubMed.
- S. C. Riha, B. M. Klahr, E. C. Tyo, S. Seifert, S. Vajda, M. J. Pellin, T. W. Hamann and A. B. Martinson, ACS Nano, 2013, 7, 2396–2405 CrossRef CAS PubMed.
- Y. Ling, G. Wang, J. Reddy, C. Wang, J. Z. Zhang and Y. Li, Angew. Chem., Int. Ed., 2012, 124, 4150–4155 CrossRef PubMed.
- Y. Hou, F. Zuo, A. Dagg and P. Feng, Angew. Chem., Int. Ed., 2013, 52, 1248–1252 CrossRef CAS PubMed.
- Y. Qiu, S. F. Leung, Q. Zhang, B. Hua, Q. Lin, Z. Wei, K. H. Tsui, Y. Zhang, S. Yang and Z. Fan, Nano Lett., 2014, 14, 2123–2129 CrossRef CAS PubMed.
- S. J. A. Moniz, S. A. Shevlin, D. J. Martin, Z.-X. Guo and J. Tang, Energy Environ. Sci., 2015, 8, 731–759 CAS.
- D. K. Bora, A. Braun, R. Erni, U. Müller, M. Döbeli and E. C. Constable, Phys. Chem. Chem. Phys., 2013, 15, 12648–12659 RSC.
- K. Li, R. Chen, S.-L. Li, M. Han, S.-L. Xie, J.-C. Bao, Z.-H. Dai and Y.-Q. Lan, Chem. Sci., 2015, 6, 5263–5268 RSC.
- J. Willkomm, N. M. Muresan and E. Reisner, Chem. Sci., 2015, 6, 2727–2736 RSC.
- Z. Li, W. Luo, M. Zhang, J. Feng and Z. Zou, Energy Environ. Sci., 2013, 6, 347–370 CAS.
- X. Lang, X. Chen and J. Zhao, Chem. Soc. Rev., 2014, 43, 473–486 RSC.
- X. Lu, S. Xie, H. Yang, Y. Tong and H. Ji, Chem. Soc. Rev., 2014, 43, 7581–7593 RSC.
- J. Liu, Y. Liu, N. Liu, Y. Han, X. Zhang, H. Huang, Y. Lifshitz, S. T. Lee, J. Zhong and Z. Kang, Science, 2015, 347, 970–974 CrossRef CAS PubMed.
- C. Mao, F. Zuo, Y. Hou, X. Bu and P. Feng, Angew. Chem., Int. Ed., 2014, 53, 10485–10489 CrossRef CAS PubMed.
- H. Wang, F. Qian, G. Wang, Y. Jiao, Z. He and Y. Li, ACS Nano, 2013, 7, 8728–8735 CrossRef CAS PubMed.
- F. Qian, H. Wang, Y. Ling, G. Wang, M. P. Thelen and Y. Li, Nano Lett., 2014, 14, 3688–3693 CrossRef CAS PubMed.
- F. Qian, G. Wang and Y. Li, Nano Lett., 2010, 10, 4686–4691 CrossRef CAS PubMed.
- Y. Qiao, S. J. Bao, C. M. Li, X. Q. Cui, Z. S. Lu and J. Guo, ACS Nano, 2008, 2, 113–119 CrossRef CAS PubMed.
- B. E. Logan, B. Hamelers, R. Rozendal, U. Schroder, J. Keller, S. Freguia, P. Aelterman, W. Verstraete and K. Rabaey, Environ. Sci. Technol., 2006, 40, 5181–5192 CrossRef CAS.
- R. S. Berk and J. H. Canfield, Appl. Microbiol., 1964, 12, 10–12 CAS.
- J. B. Davis and H. F. Yarbrough, Science, 1962, 137, 615–616 CAS.
- S. J. Yuan, G. P. Sheng, W. W. Li, Z. Q. Lin, R. J. Zeng, Z. H. Tong and H. Q. Yu, Environ. Sci. Technol., 2010, 44, 5575–5580 CrossRef CAS PubMed.
- T. W. Kim and K. S. Choi, Science, 2014, 343, 990–994 CrossRef CAS PubMed.
- Y. M. Ma, S. R. Pendlebury, A. Reynal, F. Le Formal and J. R. Durrant, Chem. Sci., 2014, 5, 2964–2973 RSC.
- J. A. Turner, Science, 2013, 342, 811–812 CrossRef CAS PubMed.
- H. Li, Y. Zhou, W. Tu, J. Ye and Z. Zou, Adv. Funct. Mater., 2015, 25, 998–1013 CrossRef CAS PubMed.
- S.-Q. Guo, X. Zhang, Z. Zhou, G.-D. Gao and L. Liu, J. Mater. Chem. A, 2014, 2, 9236–9243 CAS.
- M. Catti and M. R. Ghaani, Phys. Chem. Chem. Phys., 2014, 16, 1385–1392 RSC.
- Z. Wang, J. Hou, C. Yang, S. Jiao, K. Huang and H. Zhu, Phys. Chem. Chem. Phys., 2013, 15, 3249–3255 RSC.
- G. Li, X. Wang and X. Ma, J. Mater. Chem. A, 2013, 1, 12409–12412 CAS.
- H. Luo, W. Song, P. G. Hoertz, K. Hanson, R. Ghosh, S. Rangan, M. K. Brennaman, J. J. Concepcion, R. A. Binstead, R. A. Bartynski, R. Lopez and T. J. Meyer, Chem. Mater., 2013, 25, 122–131 CrossRef CAS.
- C. N. Carvalho, J. R. Martinelli, J. Bauer, M. Haapasalo, Y. Shen, V. Bradaschia-Correa, A. P. Manso and G. Gavini, Int. Endod. J., 2015, 48, 451–459 CrossRef CAS PubMed.
- D. Velten, E. Eisenbarth, N. Schanne and J. Breme, J. Mater. Sci.: Mater. Med., 2004, 15, 457–461 CrossRef CAS.
- E. Eisenbarth, D. Velten, M. Muller, R. Thull and J. Breme, J. Biomed. Mater. Res., Part A, 2006, 79, 166–175 CrossRef CAS PubMed.
- T. Ruff, R. Hahn, M. S. Killian, H. Asoh, S. Ono and P. Schmuki, Electrochim. Acta, 2012, 62, 402–407 CrossRef CAS PubMed.
- X. Wang, G. Chen, C. Zhou, Y. Yu and G. Wang, Eur. J. Inorg. Chem., 2012, 1742–1749 CrossRef CAS PubMed.
- B. Gao, J. Fu, K. Huo, W. Zhang, Y. Xie and P. K. Chu, J. Am. Ceram. Soc., 2011, 94, 2330–2338 CrossRef CAS PubMed.
- J. F. Moulder, W. F. Stickle, P. E. Sobol and K. D. Bomben, Handbook of X-ray photoelectron spectroscopy, Perkin Elmer, Eden Prairie, MN, 1992 Search PubMed.
- W. P. Chen, K. F. He, Y. Wang, Y. M. Hu, J. L. Cao and H. L. W. Chan, Jpn. J. Appl. Phys., 2010, 49, 051103 CrossRef.
- M. R. N. Soares, S. Leite, C. Nico, M. Peres, A. J. S. Fernandes, M. P. F. Graça, M. Matos, R. Monteiro, T. Monteiro and F. M. Costa, J. Eur. Ceram. Soc., 2011, 31, 501–506 CrossRef CAS PubMed.
- F. Vratny and F. Micale, Trans. Faraday Soc., 1963, 59, 2739–2749 RSC.
- M. Wertheimer and J. Bailon, J. Vac. Sci. Technol., 1977, 14, 699–704 CrossRef CAS.
- N. Özer, T. Barreto, T. Büyüklimanli and C. M. Lampert, Sol. Energy Mater. Sol. Cells, 1995, 36, 433–443 CrossRef.
- A. L. Viet, M. V. Reddy, R. Jose, B. V. R. Chowdari and S. Ramakrishna, J. Phys. Chem. C, 2010, 114, 664–671 Search PubMed.
- M. Li, Y. Hu, S. Xie, Y. Huang, Y. Tong and X. Lu, Chem. Commun., 2014, 50, 4341–4343 RSC.
- G. Wang, H. Wang, Y. Ling, Y. Tang, X. Yang, R. C. Fitzmorris, C. Wang, J. Z. Zhang and Y. Li, Nano Lett., 2011, 11, 3026–3033 CrossRef CAS PubMed.
- X. Lu, G. Wang, T. Zhai, M. Yu, J. Gan, Y. Tong and Y. Li, Nano Lett., 2012, 12, 1690–1696 CrossRef CAS PubMed.
- R. Brayner and F. Bozon-Verduraz, Phys. Chem. Chem. Phys., 2003, 5, 1457–1466 RSC.
- F. Dolci, M. D. Chio, M. Baricco and E. Giamello, J. Mater. Sci., 2007, 42, 7180–7185 CrossRef CAS.
- H. Dong, G. Chen, J. Sun, Y. Feng, C. Li and C. Lv, Chem. Commun., 2014, 50, 6596–6599 RSC.
- J. Jiang, M. Wang, Q. Chen, S. Shen, M. Li and L. Guo, RSC Adv., 2014, 4, 10542–10548 RSC.
- H. Miyake and H. Kozuka, J. Phys. Chem. B, 2005, 109, 17951–17956 CrossRef CAS PubMed.
- Y. Yang, Y. Ling, G. Wang and Y. Li, Eur. J. Inorg. Chem., 2014, 760–766 CrossRef CAS PubMed.
Footnote |
| † Electronic supplementary information (ESI) available: Video of the generations of gas by the hybrid device under illumination. See DOI: 10.1039/c5sc03249k |
| This journal is © The Royal Society of Chemistry 2015 |

