Hierarchical superstructures from a star-shaped molecule consisting of a cyclic oligosiloxane with cyanobiphenyl moieties†
Dae-Yoon
Kim
a,
Minwook
Park
a,
Sang-A
Lee
a,
Soeun
Kim
a,
Chih-Hao
Hsu
b,
Namil
Kim
c,
Shiao-Wei
Kuo
d,
Tae-Ho
Yoon
e and
Kwang-Un
Jeong
*a
aDepartment of Polymer-Nano Science and Technology & Polymer Materials Fusion Research Center, Chonbuk National University, Jeonju, Jeonbuk 561-756, Korea. E-mail: kujeong@jbnu.ac.kr
bDepartment of Polymer Science, The University of Akron, Akron, OH 44325, USA
cSmart Materials R&D Center, Korea Automotive Technology Institute, Cheonan, Chungnam 330-912, South Korea
dDepartment of Materials Science and Optoelectronic Engineering, National Sun Yat-Sen University, Kaohsiung 804, Taiwan
eDepartment Materials Science and Technology, Gwangju Institute of Science and Technology, Gwangju, Jeonnam 500-712, South Korea
First published on 6th November 2014
Abstract
Unconventional star-shaped liquid crystals (abbreviated as SiLCs) were successfully synthesized by chemically connecting four cyanobiphenyl anisotropic mesogens to the periphery of a super-hydrophobic and ultra-flexible cyclic tetramethyltetrasiloxane ring with flexible hexyl chains. Based on the combined experimental techniques of differential scanning calorimetry (DSC), cross-polarized optical microscopy (POM), solid-state carbon-13 (13C) nuclear magnetic resonance (NMR) spectroscopy and one-dimensional (1D) wide-angle X-ray diffraction (WAXD), it was found that the SiLC molecule exhibited the monotropic phase transition from a LC phase to a crystalline phase. The crystalline phase was only detected during slow heating processes above its glass transition temperature, while a LC phase was formed both during cooling and during heating processes. The hierarchical superstructures were identified from the structure-sensitive 2D WAXD of the macroscopically oriented SiLC film and confirmed by selected area electron diffraction (SAED) of the SiLC single crystals. The molecular packing symmetry in the monoclinic unit cell was further investigated by computer simulations on the real and reciprocal spaces. Macroscopically oriented SiLC hierarchical superstructures on the different length scales may provide the targeted physical properties, which can allow us to apply SiLC molecules in the fields of electro-optical devices and nonlinear optics.
1. Introduction
Molecular self-assembly is a fundamental bottom-up principle to build up hierarchical systems along with the possible involvement of growth kinetics.1 Formation of hierarchical superstructures from noncovalent interactions of nucleic acids on different length scales or host–guest interactions of cycloamyloses with macromolecules can be representative examples of the self-assembled bottom-up method found in nature.2 Since the first discovery of liquid crystal (LC) materials in the 1880s, LCs have been considered as promising building block molecules in the bottom-up method. The science and engineering of LCs have significantly contributed to the fundamental understanding and developments of partially ordered soft materials and their self-assembled superstructures.3 Due to the anisotropic physical properties combined with the self-healing effects, LC materials play a key role in determining the electrical and optical performances of LC devices.4Since the anisotropic physical properties of LC materials intrinsically originate from the anisotropic molecular shapes, the conventional LC compounds consist of a calamitic and/or discotic rigid core and flexible alkyl or alkoxy chains.5 The property–structure relationships of conventional LC compounds can be predicted by theoretical calculations based on the experimental data.6 However, numerous unconventional anisotropic LC materials including polycatenar-/metallomesogen-/cyclic-compounds and swallow-/star-/banana-shaped molecules have been newly synthesized.7
In this circumstance, the introduction of silicon connectors into LC compounds is attractive in LC devices because they improve the response time under external stimuli and the mechanical flexibility and durability.8 Anisotropic properties of silicon-based LC materials are imparted by chemically attached polymeric or low molar mass (LMM) materials. Since silicon-based polymeric LC systems have some limitations such as a complicated synthesis protocol and long response time to an applied field due to their high viscosity, a silicon-based oligomeric LC has been proposed.9 The mesophase of LMM-LCs is often generated by the nanophase separation between the rigid aromatic mesogens and flexible alkyl groups.10 Therefore, the formation of the mesophase can be enhanced by incorporating short silicon segments such as linear oligocarbosilane, cubic oligosilsesquioxane, and cyclic oligosiloxane.11
In this research, we newly designed and synthesized a star-shaped cyanobiphenyl-substituted cyclic silicon LC molecule (abbreviated as SiLC). A cyclic tetramethyltetrasiloxane ring was selectively chosen for the ultra-flexible and super-hydrophobic central core because the ordered structures with low viscosity are useful in LC displays, nonlinear optics, information storage, and electro-optical devices.12 It was also possible to adjust the number of anisotropic cyanobiphenyl mesogens chemically attached to the flexible core for enhancing inter- and intra-molecular interactions. Therefore, there were two main driving forces in the formation of the ordered hierarchical superstructures in this system: the super-hydrophobic interaction among the cyclic siloxanes, and the nanophase separation between the rigid cyanobiphenyl mesogens and the flexible alkyl chains. The hierarchical superstructures and phase behaviors of SiLCs were investigated by the combination of differential scanning calorimetry (DSC), one-dimensional (1D) wide-angle X-ray diffraction (WAXD), cross-polarized optical microscopy (POM), and solid-state carbon-13 (13C) nuclear magnetic resonance (NMR) techniques. Especially, the hierarchical crystalline superstructure identified by 2D WAXD of the macroscopically oriented film was confirmed by selected area electron diffraction (SAED) of the SiLC single crystal and its molecular packing symmetry in the unit cell was further investigated by computer simulations on the real and reciprocal spaces.
2. Experimental
Materials
4′-Hydroxy-4-biphenylcarbonitrile (CBP, 97%, Aldrich), 2,4,6,8-tetramethylcyclotetrasiloxane (TMCTS, 95%, TCI), 6-bromo-1-hexene (95%, TCI), platinum(0)-1,3-divinyl-1,1,3,3-tetramethyldisiloxane (Karstedt's catalyst, 2 wt% in xylene, Aldrich), and potassium carbonate (K2CO3, 99.99%, Aldrich) were used as-received unless otherwise noted. N,N-Dimethylformamide (DMF, 99.8%, Sigma-Aldrich) and toluene (99.8%, Sigma-Aldrich) were distilled by conventional methods prior to use. Merck silica gel (9385 grade, 230–400 mesh) was used for all column chromatography separations.Synthesis
![[thin space (1/6-em)]](https://www.rsc.org/images/entities/char_2009.gif) :
:![[thin space (1/6-em)]](https://www.rsc.org/images/entities/char_2009.gif) n-hexanes = 5
n-hexanes = 5![[thin space (1/6-em)]](https://www.rsc.org/images/entities/char_2009.gif) :
:![[thin space (1/6-em)]](https://www.rsc.org/images/entities/char_2009.gif) 1. The resulting product was opaque white oil (yield: 90%). 1H NMR (400 MHz, CDCl3, TMS): δ = 1.61 (m, 2H), 1.84 (m, 2H), 2.14 (m, 2H), 4.02 (t, 2H), 5.03 (m, 2H), 5.85 (m, 1H), 6.89 (d, 2H), 7.54 (d, 2H), 7.62 (d, 2H), 7.67 ppm (d, 2H).
1. The resulting product was opaque white oil (yield: 90%). 1H NMR (400 MHz, CDCl3, TMS): δ = 1.61 (m, 2H), 1.84 (m, 2H), 2.14 (m, 2H), 4.02 (t, 2H), 5.03 (m, 2H), 5.85 (m, 1H), 6.89 (d, 2H), 7.54 (d, 2H), 7.62 (d, 2H), 7.67 ppm (d, 2H).
![[thin space (1/6-em)]](https://www.rsc.org/images/entities/char_2009.gif) :
:![[thin space (1/6-em)]](https://www.rsc.org/images/entities/char_2009.gif) n-hexanes = 5
n-hexanes = 5![[thin space (1/6-em)]](https://www.rsc.org/images/entities/char_2009.gif) :
:![[thin space (1/6-em)]](https://www.rsc.org/images/entities/char_2009.gif) 3). The resulting product was white powder (yield: 76.4%). 1H NMR (400 MHz, CDCl3, TMS): δ = 0.08 (s, 12H), 0.55 (t, 8H), 1.40 (m, 24H), 1.79 (m, 8H), 3.98 (t, 8H), 6.96 (m, 8H), 7.49 (m, 8H), 7.60 (m, 8H), 7.67 ppm (m, 8H); 13C NMR (400 MHz, CDCl3, TMS): δ = 0.57, 17.1, 22.9, 25.8, 29.1, 32.8, 68.1, 110.0, 115.0, 119.0, 126.9, 128.2, 131.2, 132.5, 145.1, 159.7 ppm.
3). The resulting product was white powder (yield: 76.4%). 1H NMR (400 MHz, CDCl3, TMS): δ = 0.08 (s, 12H), 0.55 (t, 8H), 1.40 (m, 24H), 1.79 (m, 8H), 3.98 (t, 8H), 6.96 (m, 8H), 7.49 (m, 8H), 7.60 (m, 8H), 7.67 ppm (m, 8H); 13C NMR (400 MHz, CDCl3, TMS): δ = 0.57, 17.1, 22.9, 25.8, 29.1, 32.8, 68.1, 110.0, 115.0, 119.0, 126.9, 128.2, 131.2, 132.5, 145.1, 159.7 ppm.
Equipment and experiments
Phase transition behavior of SiLC was studied using a Perkin-Elmer PYRIS Diamond DSC with an Intracooler 2P apparatus. The temperatures and heat flows were calibrated using indium and zinc standards at cooling and heating rates ranging from 2.5 to 40 °C min−1. Heating experiments always preceded the cooling experiments at the same scanning rate in order to eliminate previous thermal histories. The transition temperatures were determined by measuring the onset temperatures from both the cooling and heating scans at different rates. Optical textures of the ordered phases were observed with a POM (Nikon ECLIPSE E600POL) coupled with a LINKAM LTS 350 heating stage in order to investigate morphology on the micrometer scale.1D WAXD experiments were conducted in the reflection mode of a Rigaku 12 kW rotating-anode X-ray (Cu Kα radiation) generator coupled with a diffractometer. The position and width of diffraction peaks were calibrated with silicon crystals in the high 2θ-angle region (>15°) and silver behenate in the low 2θ-angle region. To monitor the structural evolutions with temperature changes, a hot stage calibrated to be within ±1 °C error was coupled to the diffractometer. Samples were scanned across a 2θ-angle range of 1.5° to 35° at a scanning rate of 10° min−1.
The oriented 2D WAXD patterns were obtained using a Rigaku X-ray imaging system with an 18 kW rotating anode X-ray generator. The diffraction peak positions and widths were also calibrated with silicon crystals and silver behenate. A hot stage was employed to obtain diffraction peaks at elevated temperatures. At least 30 min exposure time was required for a high-quality pattern. In 2D WAXD experiments, background scattering was subtracted from the sample scans.
Bright-field TEM images (FEI Tecnai 12) were taken to examine the film morphology on the nanometer length scale at an accelerating voltage of 120 kV. The camera length for selected area electron diffraction (SAED) analysis was set at 3.0 m, and the calibration of the SAED spacing smaller than 0.384 nm was carried out using evaporated thallous chloride, which has a largest first-order spacing diffraction of 0.384 nm. Spacing values larger than 0.384 nm were calibrated by doubling the d-spacing values of the first order diffractions.
Conformational changes of the alkyl chain in SiLCs at different temperatures were also studied using solid-state 13C NMR spectroscopy (Chemagnetics CMX 200) operating at 201.13 and 50.78 MHz for 13C nuclei, respectively. The samples were spun in nitrogen gas at 4.5 kHz at the magic angle. The magic angle was optimized by the intensity calibration of the aromatic carbon resonance of hexamethylbenzene. The 13C NMR spectra with CP/MAS/DD were acquired to selectively investigate the rigid components, and the Bloch decay spectra with MAS/DD were used to particularly study the mobile components. The CP contact time was 1 ms, while the recycle time of the pulse was 5 s. Each spectrum consisted of an accumulation of 500 scans. The temperature of the solid-state 13C NMR experiment was controlled using a REX-F900 VT unit. Overlapped carbon peaks in solid-state 13C NMR were resolved using the PeakFit peak separation program from Jandel Scientific. Lorentzian functions were used to obtain the best reasonable fit.
Crystallographic simulation was performed using Cerius2 (Version 4.6) simulation software from Accelrys utilizing the COMPASS force field. The global equilibrium conformation of the SiLC compound in the isolated gas phase was chosen as the starting building block. Basic unit cell parameters determined by crystallographic experimental data from 2D WAXD of the macroscopically oriented SiLC film and SAED of SiLC single crystals were used to build the crystal unit cell. The molecular packing symmetry in this unit cell was judged by comparing the calculated diffraction patterns with those of experiments.
3. Results and discussion
Programmed star-shaped oligosiloxane LC molecule
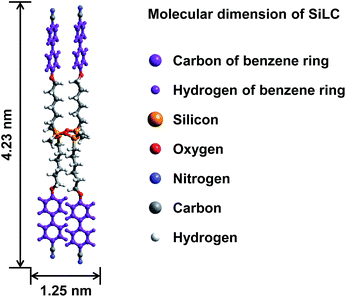
A cyclic silicon-based LC molecule (abbreviated as SiLC) containing four cyanobiphenyl moieties is newly designed and synthesized, as illustrated in Fig. 1. By precisely locating the flexible alkyl connectors to the rigid cyanobiphenyl mesogens at the periphery of the super-hydrophobic and ultra-flexible cyclic siloxane ring, the nanophase separation between cyanobiphenyl mesogens and cyclic siloxanes is maximized. From a synthetic point of view, the 2,4,6,8-tetramethylcyclotetrasiloxane (TMCTS) cyclic ring containing four Si–H functions allows us to synthesize a discrete and well-defined SiLC compound by a click chemistry.As shown in Scheme 1, the olefin terminated alkyl ether of 4′-hydroxy-4-biphenyl-carbonitrile is first prepared from the corresponding bromide compound with potassium carbonate and then cyanobiphenyl substituted cyclic oligomeric siloxane was synthesized by the hydrosilation of olefin terminated cyanobiphenyl mesogens with a multi-functional cyclic hydrosiloxane TMCTS. The reaction is conducted in the presence of a Pt(0) catalyst, divinyl(tetramethyldisiloxane) platinum.13 The detailed synthetic procedures are described in the Experimental section of this paper. Chemical structures and purities of the SiLC and its intermediates are confirmed by 1H NMR (see Fig. S1 and S2 in the ESI†), 13C NMR (Fig. S3†), and thin layer chromatography (TLC).
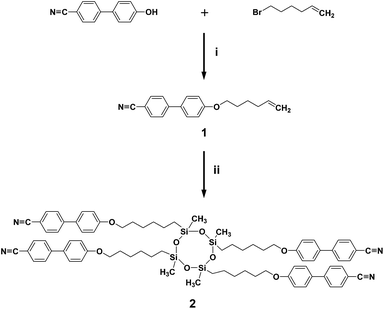 | ||
| Scheme 1 Synthesis of SiLC. Reagents and conditions: (i) CBP, bromohexane, K2CO3, DMF, 90 °C, 24 h; (ii) Karstedt's catalyst, TMCTS, toluene, 100 °C, 24 h. | ||
The molecular weight of the SiLC is 1349.9 g mol−1. The molecular dimensions and energy-minimized geometry in the isolated gas phase are estimated by performing computer simulation. As represented in Fig. 1, two cyanobiphenyl mesogens connected at 1 and 3 positions of cyclic siloxane with hexyl chains are located at one side of cyclic siloxane, while the other two cyanobiphenyl mesogens at 2 and 4 positions are located at the other side. Therefore, the overall shape of the SiLC compound is ribbon-like. From the all-trans conformation in the alkyl chains, the calculated length of the SiLC is 4.23 nm, while the width of the SiLC along the short axis is 1.25 nm, as illustrated in Fig. 1.
Thermodynamic phase transitions and their corresponding structural evolutions
The DSC experiment was first conducted at cooling and heating rates ranging from 2.5 to 40 °C min−1 to determine the thermal transition temperatures and quantitative thermodynamic properties of the SiLC compound. As shown in Fig. 2, a single exothermic first-order thermal transition is observed at 119 °C with −7.34 J g−1 (−9.91 kJ mol−1) during a rapid cooling at 40.0 °C min−1. Upon further cooling, a sudden step change of heat capacity is detected at 22 °C, which is attributed to the glass transition temperature (Tg) of the SiLC. The DSC thermogram obtained upon subsequent heating at 40 °C min−1 exhibits strong endothermic first-order transition at 119 °C with 7.35 J g−1 (9.92 kJ mol−1). Similar thermal transition behaviors are observed at the scanning rates of 10 to 40 °C min−1.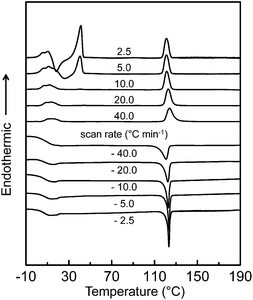 | ||
| Fig. 2 Sets of DSC cooling and subsequent heating thermal diagrams of the SiLC molecule at scanning rates ranging from 2.5 to 40 °C min−1. | ||
When the scanning rate is reduced to 5.0 and 2.5 °C min−1, on the other hand, exothermic and endothermic thermal transitions are newly observed slightly above the Tg. Larger heat is evolved at a slower heating rate: −10.85 J g−1 (−14.64 kJ mol−1) for 2.5 °C min−1 and −3.72 J g−1 (−5.02 kJ mol−1) for 5.0 °C min−1. Since the amount of heat released during the exothermic transition is almost identical to that of heat absorbed during the endothermic transition, the exothermic transition can be due to the recrystallization of the SiLC. The onset temperature and the corresponding heat at 119 °C show no change regardless of cooling and heating rates because the first-order thermal transition is close to the equilibrium state. From the POM analysis, it is found that the transition at elevated temperature is associated with liquid crystal (LC)-isotropic melt (I) transition of the SiLC.14 The fast cooled SiLC reveals a glassy LC phase below Tg = 22 °C.
Although DSC experiments are sensitive to heat absorption and release events, this technique cannot provide direct information about structural changes.15 The 1D WAXD experiments at different temperatures are combined with DSC results to identify the corresponding structure evolutions. Fig. 3 shows a set of 1D WAXD powder patterns obtained at cooling and subsequent heating rates of 2.5 °C min−1. It is realized that the SiLC undergoes the isotropization above Ti = 119 °C, exhibiting three amorphous scatterings at 2θ = 2.91° (d = 3.03 nm), 2θ = 12.01° (d = 0.74 nm) and 2θ = 19.59° (d = 0.45 nm). The amorphous halo at 2θ = 2.91° corresponds to the average periodicity of electron density fluctuations between the nanophase separated cyclic siloxane cores and cyanobiphenyl mesogens while the amorphous halo at 2θ = 19.59° and at 2θ = 12.01° comes from the average distances between the cyanobiphenyl mesogens and between the cyclic siloxane cores, respectively. It is apparent that the nanophase separation between cyanobiphenyl mesogens and cyclic siloxanes is maintained even in the isotropic (I) phase by locating the flexible alkyl connectors to the rigid cyanobiphenyl mesogens at the periphery of super-hydrophobic and ultra-flexible cyclic siloxane. When the temperature is decreased below Ti = 119 °C, the scattering halo at 2θ = 19.59° (d-spacing = 0.45 nm) suddenly shifts to 2θ = 20.84° (d-spacing = 0.42 nm) with a smaller width at half height. In a low-angle region, a single strong diffraction peak at 2θ = 2.91° (d = 3.03 nm) is concurrently emerged but its high-order diffractions are very weak. However, the amorphous halo at 2θ = 12.01° is not much changed. On further cooling below Tg = 22 °C, the 1D WAXD patterns are not changed. Based on the 1D WAXD data combined with DSC results, it is clear that a low-ordered smectic LC phase is formed by the self-organization of rigid cyanobiphenyl mesogens in the nanophase separated domains below Ti = 119 °C and the molecular packing symmetry is still retained below Tg = 22 °C. Therefore, the structure below Tg = 22 °C should be denoted as a metastable glassy smectic LC phase.
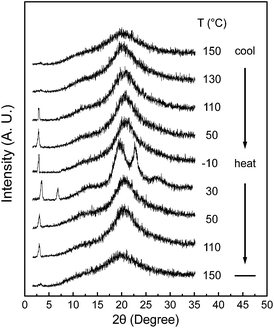 | ||
| Fig. 3 A set of 1D WAXD powder patterns of the SiLC molecule obtained at different temperatures between −10 and 150 °C during cooling and subsequent heating at a rate of 2.5 °C min−1. | ||
On subsequent heating above the Tg of the SiLC molecule at a rate of 2.5 °C min−1, several sharp reflection peaks suddenly appear in both low and wide-angle regions due to the development of highly ordered crystals. Phase transition at 30 °C should be closely associated with the exothermic thermal transition detected between Tg and 35 °C in DSC results (Fig. 2). The sharp diffraction peak at 2θ = 2.91° (d = 3.03 nm) shifts to 2θ = 3.39° (d = 2.60 nm) and its second-order diffraction peak is also observed at 2θ = 6.78° (d = 1.30 nm). In the wide-angle region, the scattering halo at 2θ = 20.84° (d-spacing = 0.42 nm) at the glassy smectic LC phase is split into three distinct diffraction peaks at 2θ = 19.59°, 22.74° and 27.24°, which correspond to the d-spacings of 0.45 nm, 0.39 nm and 0.32 nm, respectively. The diffraction peaks in wide-angle regions are mainly related to the lateral molecular packing between cyanobiphenyl mesogens. However, the amorphous halo at 2θ = 12.01° detected in the smectic LC phase is not much changed even in the crystalline phase. This result refers to the fact that the nanophase separated cyclic siloxane groups are in a disordered state with a short-range positional order even in the crystalline phase. The 1D WAXD pattern at 30 °C clearly indicates that the constructed hierarchical crystalline SiLC superstructure is a layered structure. However, its molecular packing symmetry in the smectic layer should be identified by 2D WAXD of the oriented sample, which will be discussed in this paper. When the temperature is increased above the endothermic transition at 35 °C, the SiLC crystal phase transforms to a smectic LC phase. This explanation is justified by the fact that the 1D WAXD patterns at 50 °C obtained during cooling and subsequent heating processes are almost identical. Above Ti = 119 °C, a typical 1D WAXD pattern for the I phase is observed.
Phase transformations from the I phase to the smectic LC phase and the crystalline K phase can be further supported by the morphological investigation on the micrometer length scale. Optical textures of the SiLC upon cooling and subsequent heating at 2.5 °C min−1 from −10 °C to 130 °C have been recorded, and textures at −10 °C, 30 °C and 50 °C are represented in Fig. 4a–c, respectively. On cooling below Ti, the fan-shaped textures are grown against the dark state, suggesting the emergence of a low-ordered smectic LC phase.16 As shown in Fig. 4a, the fully grown fan-shaped textures are still discernible even below Tg, which agrees well with DSC and 1D WAXD results. Upon heating at 2.5 °C min−1 above Tg, the boundary lines between the fan-shaped domains and the Maltese cross in each fan shaped domain get obvious, as shown in Fig. 4b, the phenomena of which are often detected during a recrystallization process. The fan shaped texture observed during cooling appears again above 35 °C due to the K → LC transition (Fig. 4c).
 | ||
| Fig. 4 POM images of the SiLC molecule at (a) −10 °C, (b) 30 °C and (c) 50 °C during heating at 2.5 °C min−1. | ||
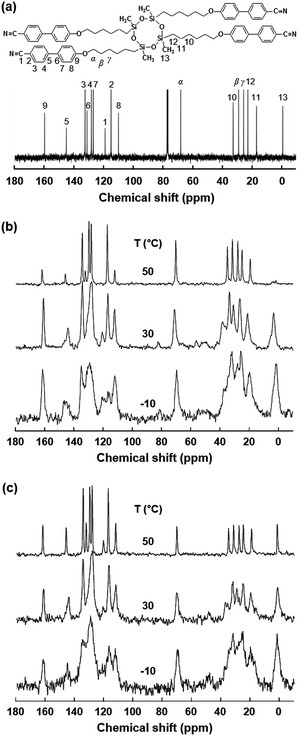
From the combined experiments of DSC, 1D WAXD and POM, it is realized that there are two stable hierarchical superstructures of the SiLC molecule depending on temperature: one is a low-ordered smectic LC phase at high temperature and the other is a crystalline structure formed by annealing a metastable glassy smectic LC phase above Tg. Note that the cyclic siloxane group of the SiLC molecule is involved in constructing the hierarchical superstructures but the nanophase separated cyclic siloxane groups are in a disordered state with a short-range positional order even in the crystalline phase. It means that the cyclic siloxane groups of the SiLC are in the mobile and flexible states in all hierarchical superstructures. To confirm this statement, the solid-state 13C NMR spectra with Cross Polarization/Magic Angle Spinning/Dipolar Decoupling (CP/MAS/DD) (Fig. 5b) and Bloch decay (Fig. 5c) are acquired at different temperatures to selectively investigate the rigid and mobile components of the SiLC at different phases, respectively.17
At first, chemical shift is identified by analyzing the solution 13C NMR. As indicated in Fig. 5a, the carbon atoms in cyanobiphenyl groups appear between 100 ppm and 170 ppm, while carbons in the alkyl chains are chemically shifted between 100 ppm and 10 ppm. Specifically, chemical shift of carbons in the cyclic siloxane ring is detected at 0 ppm. As we expected from the DSC and 1D WAXD results, the mobilities of the cyclic siloxane ring and alkyl chains as well as cyanobiphenyl groups in the low-ordered smectic LC phase (50 °C) are much higher than those of the glassy smectic LC phase (−10 °C). Especially, the cyclic siloxane rings in the crystalline phase are still mobile even though the rigidity is higher than that in the low-ordered smectic LC phase. This result is matched well with those of 1D WAXD. In Fig. 5, the 13C chemical shift at 63 ppm represents the carbon atoms at the α position, and the β and γ carbon atoms appeared at 34 and 24 ppm, respectively. Especially, the β carbon chemical shift in the Bloch decay method consists of two values. The chemical shift at 34–32 ppm in the Bloch decay 13C solid-state NMR spectra of the SiLC (Fig. 5c) represents the methylene carbon atoms in the long trans zigzag segments of the alkyl chains, while the chemical shift at 32–30 ppm corresponds to the carbon atoms in the disordered, statistically distributed trans and gauche conformations. Upon increasing the temperature from −10 °C (a glassy smectic LC phase) to 30 °C (a crystalline phase), the area of the β peak at 33 ppm corresponding to the carbon atoms in the ordered segments of alkyl chains suddenly increases from 40% to 60%. When the temperature is further increased up to 50 °C (a low-ordered smectic LC phase), the area of the β peak is abruptly decreased down to 40%. Temperature-dependent solid-state 13C NMR results agree well with those of DSC, 1D WAXD and POM.
To understand the thermodynamic phase transition behaviors of the SiLC and the formation of the stable K crystalline phase, the free energy versus temperature at constant pressure is schematically illustrated based on the combined experimental data of DSC, 1D WAXD, POM and solid-state 13C NMR. As represented by blue arrows in Fig. 6, the I phase is transferred to the smectic LC phase by cooling the SiLC. Since the I ↔ LC transition is close to the equilibrium state, the transition temperature and its heat change are independent of cooling and heating rates. Upon lowering the temperature below the Tg of the SiLC, the symmetry and order of the smectic LC phase are retained to be a glassy smectic LC phase. As illustrated in Fig. 6, on subsequent heating above the Tg of the SiLC, the metastable glassy smectic LC phase transforms to the stable K crystalline phase. To confirm this monotropic phase transition, the SiLC compound is isothermally annealed at 30 °C right after cooling at 10 °C min−1 using DSC. The subsequent heating at 10 °C min−1 indicates that the crystallization starts after 10 min and finishes in 2 h. The continuous heating makes the 3D ordered crystalline K phase transform to the smectic LC phase at TK-LC and to the I phase at TLC-I. This monotropic phase transition behavior and the development of the metastable smectic LC phase below TK should originate from the kinetic competition between the smectic LC phase and the crystalline K phase.
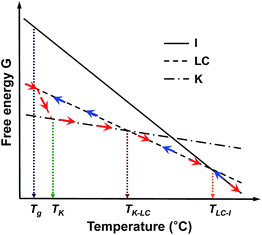 | ||
| Fig. 6 Illustration of the free energy versus temperature at constant pressure for the SiLC. Here, blue and red arrows represent the cooling and subsequent heating tracks, respectively. | ||
Identification of hierarchical superstructures at different temperatures
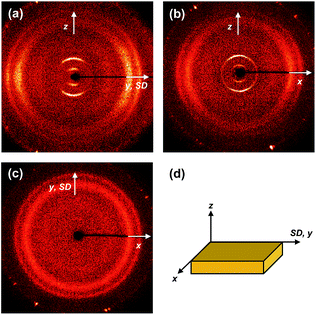
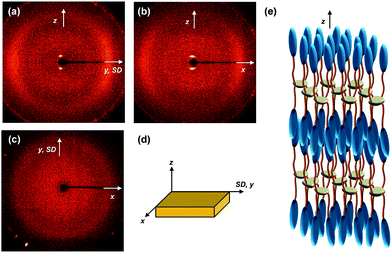
The molecular packing structures and symmetries in the hierarchical superstructures of the SiLC are identified by conducting the 2D WAXD experiments. Macroscopically oriented SiLC samples for 2D WAXD experiments are first prepared by mechanical shearing at the temperature between TK-LC and TLC-I and then quenched below the Tg of the SiLC. The oriented and quenched sample is further annealed at the temperature between Tg and TK-LC to prepare the macroscopically oriented K crystalline film for 2D WAXD.A series of 2D WAXD patterns for the oriented SiLC crystal (Fig. 7d) were obtained with the incident X-ray beam directions parallel to the x (Fig. 7a), y (Fig. 7b) and z (Fig. 7c) axes, respectively. Diffraction arc positions and widths in Fig. 7 are calibrated based on the diffraction ring of the silicon power crystal at 2θ = 28.466° (d = 0.314 nm). As discussed in 1D WAXD (Fig. 3), diffraction information about SiLC molecular arrangements appears on two different length scales. One is on the nanometer length scale in the low 2θ-angle region between 1.5° and 11°, which is related to hierarchical superstructures of the SiLC. Diffractions on the sub-nanometer length scale between 11° and 30° can provide information about the lateral molecular packing structures between the nanophase separated cyclic siloxane cores and between the cyanobiphenyl mesogens. As represented in Fig. 7, the X-ray patterns along the x and y axes are identical while the 2D WAXD along the z axis (Fig. 7c) shows disoriented ring patterns in wide-angle regions without any detectable diffractions in low-angle regions. Therefore, it is safe to conclude that 2D WAXD along the x and y axes is a uniaxially oriented fiber pattern, in which the molecular long axis is parallel to the z axis (perpendicular to the shear direction, SD). In Fig. 7a and b, a pair of strong diffraction at 2θ = 3.39° (d = 2.60 nm) is detected on the meridian with its high order diffraction at 2θ = 6.78° (d = 1.30 nm). This result indicates that the hierarchical superstructure of the SiLC in the K phase is a basically layer structure with the layer d-spacing = 2.60 nm. Therefore, Miller indices of the diffractions at 2θ = 3.39° and 6.78° are identified as (001) and (002), respectively. Note that the layer normal is parallel to the z axis which is perpendicular to the SD. Since the calculated length of the SiLC is 4.23 nm (as shown in Fig. 1), SiLC molecules may overlap each other along the layer normal. On the equator of 2D WAXD along the x and y axes, three diffraction arcs are detected at 2θ = 19.59° (d = 0.45 nm), 22.74° (d = 0.39 nm) and 27.24° (d = 0.32 nm) with a pair of scattering halo at 2θ = 12.01° (d = 0.74 nm). Note that all diffractions and scatterings on the equator of 2D WAXD along the x and y axes appear as ring patterns in Fig. 7c (along the z axis). The scattering halo detected at 2θ = 12.01° originates from the average periodicity of electron density fluctuations between the nanophase separated cyclic siloxane cores with a short-range positional order. Since the scattering halo is detected on the equator, the layer normal of siloxane core aggregates is parallel to the z axis (meridian direction). When the molecular packing among cyanobiphenyl mesogens in the hierarchical crystalline superstructure of the SiLC is only considered, three diffractions on the equator at 2θ = 19.59°, 22.74° and 27.24° can be assigned to the (200), (110) and (120) planes, respectively, based on the triangulation method of building a 2D a′*b′* lattice of the unit cell. Through the refinement of the reciprocal 2D a′*b′* lattice using the diffractions on the equator, a real space 2D unit cell is evaluated with dimensions of a′ = 0.78 nm, b′ = 0.55 nm, and γ′ = 90°.
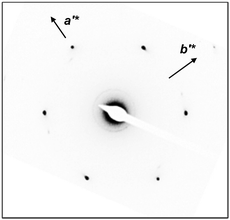
To confirm the 2D molecular packing of cyanobiphenyl mesogens in the hierarchical crystalline superstructure of the SiLC, SAED experiments from single crystals are conducted. The thin SiLC film prepared by casting the 0.05 wt% chloroform solution is cooled down to −10 °C from Ti = 119 °C and subsequently heated up to 30 °C at a rate of 2.5 °C min−1. The SAED pattern of the single crystal obtained by a low dose TEM technique is shown in Fig. 8. Two pairs of electron diffractions are detected at d = 0.45 nm on the quadrants while a pair of electron diffractions at d = 0.39 nm is observed on the a′* axis. The (020) diffraction is also detected at d = 0.275 nm, as shown in Fig. 8. The calculated γ′-angle (γ′ = 90°) based on 2D WAXD is matched well with the measured value in SAED.
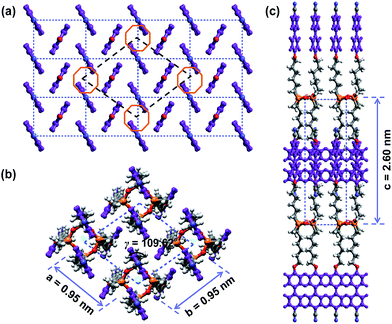
The molecular packing structure of cyanobiphenyl mesogens in the hierarchical crystalline superstructure of the SiLC determined by 2D WAXD and SAED is further verified by a computer simulation. At first, we only take care of the molecular packing of cyanobiphenyl mesogenic parts in SiLC molecules. As shown in Fig. 9, four cyanobiphenyl mesogens located at the corners are arranged along the c′ axis (long axis of the molecule, z axis) while the cyanobiphenyl mesogen at the center points the opposite direction. This molecular arrangement exactly satisfies the diffraction patterns of the experimentally observed 2D WAXD and SAED. Furthermore, the dipole moment induced by the individual cyanobiphenyl mesogen can be canceled out to make the system stable. Note that the cyanobiphenyl mesogen at the center and at the corners should come from the different SiLC molecules. The unit cell created only from cyanobiphenyl mesogens cannot represent the K phase, but it is considered as a sub-unit cell of the hierarchical crystalline superstructure of the SiLC.
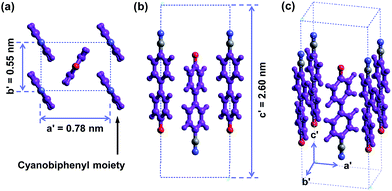 | ||
| Fig. 9 Simulated molecular packing in the real space by considering only cyanobiphenyl mesogens in the SiLC. | ||
Next, to identify the hierarchical crystalline superstructure of SiLC diffractions generated from all parts of the SiLC molecule should be considered together. In Fig. 7a and b, the a* and b* axes are assigned parallel to the equator while the c*-axis is along the meridian direction, which is parallel to the layer normal. Based on the triangulation method of building a 2D a*b* lattice of the unit cell, a scattering halo at 2θ = 12.01° and three diffraction arcs at 2θ = 19.59°, 22.74° and 27.24° on the equator of 2D WAXD (Fig. 7a and b) can be indexed to (1![[1 with combining macron]](https://www.rsc.org/images/entities/char_0031_0304.gif) 0), (200), (2
0), (200), (2![[2 with combining macron]](https://www.rsc.org/images/entities/char_0032_0304.gif) 0) and (3
0) and (3![[1 with combining macron]](https://www.rsc.org/images/entities/char_0031_0304.gif) 0), respectively. Through the refinement of the reciprocal 2D a*b* lattice using the diffractions on the equator, a real space 2D unit cell is evaluated with dimensions of a = 0.95 nm, b = 0.95 nm and γ = 109.62°.18
0), respectively. Through the refinement of the reciprocal 2D a*b* lattice using the diffractions on the equator, a real space 2D unit cell is evaluated with dimensions of a = 0.95 nm, b = 0.95 nm and γ = 109.62°.18
Since the c*-axis along the meridian is perpendicular to the a* and c* axes along the equator, both α and β angles are 90°. From the strong diffraction at 2θ = 3.39° with its high order diffraction at 2θ = 6.78°, the dimension of c-axis is determined to be 2.60 nm. Table 1 lists the experimentally observed and the calculated d-spacings based on this monoclinic unit cell lattice. With one SiLC molecule in one unit cell, its calculated crystallographic density is 1.00 g cm−3. The experimentally observed density is 0.98 g cm−3, which fits well with the calculated one. Therefore, this hierarchical crystalline superstructure (K) of the SiLC is identified as a monoclinic crystalline phase.
| (hkl) | 2θ (degree) | d-spacing (nm) | ||
|---|---|---|---|---|
| Exptla | Calc.b | Exptla | Calc.b | |
| a The accuracy of the experimental data is ±0.005 nm. b The calculated data listed are based on the crystalline (K) monoclinic unit cell with a = 0.95 nm, b = 0.95 nm, c = 2.60 nm, α = β = 90.0° and γ = 109.62°. | ||||
1![[1 with combining macron]](https://www.rsc.org/images/entities/char_0031_0304.gif) 0 0 |
12.01 | 11.82 | 0.74 | 0.75 |
| 200 | 19.59 | 19.65 | 0.45 | 0.45 |
| 020 | 19.59 | 19.65 | 0.45 | 0.45 |
2![[2 with combining macron]](https://www.rsc.org/images/entities/char_0032_0304.gif) 0 0 |
22.74 | 22.85 | 0.39 | 0.39 |
3![[1 with combining macron]](https://www.rsc.org/images/entities/char_0031_0304.gif) 0 0 |
27.24 | 27.51 | 0.32 | 0.32 |
1![[3 with combining macron]](https://www.rsc.org/images/entities/char_0033_0304.gif) 0 0 |
27.24 | 27.51 | 0.32 | 0.32 |
| 001 | 3.39 | 3.40 | 2.60 | 2.60 |
| 002 | 6.78 | 6.80 | 1.30 | 1.30 |
The 3D molecular arrangement and packing symmetry in the monoclinic unit cell of the SiLC hierarchical crystalline superstructure are further investigated by computer simulation. The simulated molecular packing should satisfy the experimentally observed 2D WAXD and SAED results. First of all, there is a strong nanophase separation between cyanobiphenyl mesogens and cyclic siloxane groups of the SiLC molecule, and four cyanobiphenyl mesogens are chemically connected to the periphery of a cyclic siloxane ring. Second, the nanophase separated cyanobiphenyl mesogens are laterally aggregated to form the 2D orthogonal unit cell with dimensions of a′ = 0.78 nm, b′ = 0.55 nm, and γ′ = 90°. Here, note that the cyanobiphenyl mesogens on the (11) 2D plane in the sub unit cell are all arranged parallel to the layer normal but their polar axes are opposite to the neighboring ones, as shown in Fig. 9. Finally, the cyclic siloxane groups of the SiLC molecule are self-assembled to form the 2D platform with the average distance among cyclic siloxane cores = 0.74 nm. Since the scattering halo from cyclic siloxane groups is detected on the equator of 2D WAXD (Fig. 7a and b), the 2D platform normal is parallel to the z-axis (meridian direction). Without disturbing the molecular packing symmetry of cyanobiphenyl mesogens in the 2D orthogonal unit cell, the locations of cyclic siloxane groups are first estimated by overlapping two sub unit cells, as illustrated in Fig. 10a. By connecting four cyanobiphenyl mesogens to the periphery of a cyclic siloxane ring with hexyl chains, the 3D molecular arrangements of the SiLC molecule in the K phase are recognized in the real space. This simulated molecular packing model satisfies all the experimental data observed in 2D WAXD and SAED.
In order to examine whether the proposed molecular packing scheme fits to the real structure, the calculated 2D WAXD and SAED diffraction patterns are generated and compared with the experimentally obtained diffraction patterns.19 On comparison, the precise atom positions in the monoclinic unit cell are determined. The calculated 2D WAXD fiber pattern (Fig. 11a) and the SAED pattern with the [001] zone (Fig. 11b) based on the molecular packing in the real space (Fig. 10) are qualitatively matched well with the experimental observations (Fig. 7a for 2D WAXD and Fig. 8 for SAED).
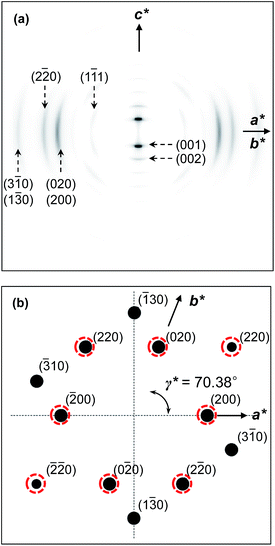 | ||
| Fig. 11 Computer simulated 2D WAXD fiber pattern (a) and SAED on the [001] zone (b) of the SiLC in the K phase. The circled diffractions are experimentally observed. | ||
The molecular packing structure of the low-ordered LC phase between TK-LC = 35 °C and TLC-I = 119 °C is also studied by the 2D WAXD patterns obtained by irradiating X-ray along the x (Fig. 12a), y (Fig. 12b) and z (Fig. 12c) axes, respectively. The 2D WAXD along the x and y axes are identical and the 2D WAXD along the z-axis is the amorphous ring pattern without exhibiting low-angle diffractions. Similar to the 2D WAXD of the K phase, the 2D WAXD of the low-ordered LC phase is a uniaxially oriented fiber pattern. As shown in Fig. 12a and b, a pair of diffractions is detected on the meridian at 2θ = 2.91° (d = 3.03 nm) with its second order diffraction at 2θ = 5.82°. This means that the hierarchical LC superstructure maintains a layer structure with d-spacing = 3.03 nm. Even though the flexible alkyl chains are assumed to be all trans conformation, the calculated length (4.23 nm) of the SiLC is significantly greater than the detected layer spacing (d = 3.03 nm). The smaller layer thickness compared with the length of the SiLC molecule indicates the fact that the SiLC molecule is tilted with respect to layer normal or that the SiLC molecules are interdigitated with the molecules in the neighboring layers. Since the scattering halos at 2θ = 20.84° (d = 0.42 nm) and 2θ = 12.01° (0.74 nm) that originated from the average distances between the cyanobiphenyl mesogens and between cyclic siloxane cores, respectively, are on the equator in Fig. 12a and b, the smectic layer should be interdigitated and the long axis of the SiLC molecule is parallel to the layer normal. Therefore, this low-ordered LC phase can be identified as a SmA phase, as schematically illustrated in Fig. 12e.
4. Conclusions
A star-shaped liquid crystalline (LC) molecule (abbreviated as SiLC) has been newly designed and successfully synthesized by chemically connecting four cyanobiphenyl mesogens to the periphery of a cyclic tetramethyltetrasiloxane ring with flexible hexyl chains. Utilizing the combined techniques of thermal, microscopic, spectroscopic, and scattering experiments, it was found that the SiLC molecule exhibited the peculiar monotropic phase transition behavior. The hierarchical crystalline (K) superstructure was only formed during heating processes above its glass transition temperature (Tg = 22 °C), while the low-ordered LC phase is formed both during cooling and during heating processes. Based on the structure-sensitive 2D WAXD and SAED, the 3D hierarchical superstructures of the SiLC molecule at different temperatures were identified: one is the crystalline phase with a monoclinic unit cell at low temperatures and the other is the SmA LC phase at high temperatures. The molecular packing symmetry in the hierarchical crystalline superstructure was further investigated by performing computer simulations on the real and reciprocal spaces. The hierarchical superstructures controlled on the different length scales can allow us to apply SiLC molecules in the fields of electro-optical devices and nonlinear optics.Acknowledgements
This work was mainly supported by Basic Science Research (2013R1A1A2007238) and BK21 Plus program, Korea. D.-Y. Kim appreciates the support from Global Ph.D. Fellowship Program.Notes and references
- S. S. Babu, V. K. Praveen and A. Ajayaghosh, Chem. Rev., 2014, 114, 1973 CrossRef CAS PubMed; J. F. Stoddart, Angew. Chem., Int. Ed., 2012, 51, 12902 CrossRef PubMed; S. Srinivasan, V. K. Praveen, R. Philip and A. Ajayaghosh, Angew. Chem., Int. Ed., 2008, 47, 5750 CrossRef PubMed; R. J. Williams, A. M. Smith, R. Collins, N. Hodson, A. K. Das and R. V. Ulijn, Nat. Nanotechnol., 2009, 4, 19 CrossRef PubMed; K. J. Skilling, F. Citossi, T. D. Bradshaw, M. Ashford, B. Kellam and M. Marlow, Soft Matter, 2014, 10, 237 RSC; J. W. Goodby, G. H. Mehl, I. M. Saez, R. P. Tuffin, G. Mackenzie, R. Auzely-Velty, T. Benvegnu and D. Plusquellec, Chem. Commun., 1998, 2057 RSC.
- J. Shimada, S. Handa, H. Kaneko and T. Takada, Macromolecules, 1996, 29, 6408 CrossRef CAS; S. Honda, T. Yamamoto and Y. Tezuka, Nat. Commun., 2012, 4, 1 Search PubMed; E. A. Appel, J. Barrio, X. J. Loh and O. A. Scherman, Chem. Soc. Rev., 2012, 41, 6195 RSC; J. Szejtli, Chem. Rev., 1998, 98, 1743 CrossRef PubMed.
- O. Z. Lehmann, Phys. Chem., 1888, 9, 421 Search PubMed; H. Kelker and P. M. Knoll, Liq. Cryst., 1989, 5, 19 CrossRef CAS; C. Xue, S. Jin, X. Weng, J. J. Ge, Z. Shen, H. Shen, M. J. Graham, K.-U. Jeong, H. Huang, D. Zhang, M. Guo, F. W. Harris and S. Z. D. Cheng, Chem. Mater., 2004, 16, 1014 CrossRef.
- A. Mori, M. Yokoo, M. Hashimoto, S. Ujiie, S. Diele, U. Baumeister and C. Tschierske, J. Am. Chem. Soc., 2003, 125, 6620 CrossRef CAS PubMed; T. Cardinaels, K. Driesen, T. N. Parac-Vogt, B. Heinrich, C. Bourgogne, D. Guillon, B. Donnio and K. Binnemans, Chem. Mater., 2005, 17, 6589 CrossRef; S. Norvez, F.-G. Tournilhac, P. Bassoul and P. Herson, Chem. Mater., 2001, 13, 2552 CrossRef; L. Cui, J. Miao and L. Zhu, Macromolecules, 2006, 39, 2536 CrossRef; R. A. Bissell, N. Boden, R. J. Bushby, C. W. G. Fishwick, E. Holland, B. Movaghar and G. Ungar, Chem. Commun., 1998, 113 RSC; J. L. Segura and N. Martin, Angew. Chem., Int. Ed., 2001, 40, 1372 CrossRef.
- D.-Y. Kim, L. Wang, Y. Cao, X. Yu, S. Z. D. Cheng, S.-W. Kuo, D.-H. Song, S. H. Lee, M.-H. Lee and K.-U. Jeong, J. Mater. Chem., 2012, 22, 16382 RSC; S.-K. Park, S.-E. Kim, D.-Y. Kim, S.-W. Kang, S. Shin, S.-W. Kuo, S.-H. Hwang, S. H. Lee, M.-H. Lee and K.-U. Jeong, Adv. Funct. Mater., 2011, 21, 2129 CrossRef CAS; M.-C. Yeh, Y.-L. Su, M.-C. Tzeng, C. W. Ong, T. Kajitani, H. Enozawa, M. Takata, Y. Koizumi, A. Saeki, S. Seki and T. Fukushima, Angew. Chem., Int. Ed., 2013, 52, 1031 CrossRef PubMed.
- N. Kim, L. Wang, D.-Y. Kim, S.-H. Hwang, S.-W. Kuo, M.-H. Lee and K.-U. Jeong, Soft Matter, 2012, 8, 9183 RSC; D.-Y. Kim, P. Nayek, S. Kim, K. S. Ha, M. H. Jo, C.-H. Hsu, Y. Cao, S. Z. D. Cheng, S. H. Lee and K.-U. Jeong, Cryst. Growth Des., 2013, 13, 1309 Search PubMed.
- L. Gonzalez, N. Gimeno, R. M. Tejedor, V. Polo, M. B. Ros, S. Uriel and J. L. Serrano, Chem. Mater., 2013, 25, 4503 CrossRef CAS; J. Wu, T. Usui and J.-I. Hanna, J. Mater. Chem., 2011, 21, 8045 RSC; R. Deschenaux, B. Donnio and D. Guillon, New J. Chem., 2007, 31, 1064 RSC; A. S. Achalkumar, U. S. Hiremath, D. S. S. Rao and C. V. Yelamaggad, Liq. Cryst., 2011, 38, 1563 CrossRef; N. D. Suhan, S. J. Loeb and S. H. Eichhorn, J. Am. Chem. Soc., 2013, 135, 400 CrossRef PubMed.
- S. Rendon and W. R. Burghardt, Macromolecules, 2007, 40, 6624 CrossRef CAS; Q. Pan, X. Chen, X. Fan, Z. Shen and Q. Zhou, J. Mater. Chem., 2008, 18, 3481 RSC; X. Wang, C. M. Cho, W. Y. Say, A. Y. X. Tan, C. He, H. S. O. Chan and J. Xu, J. Mater. Chem., 2011, 21, 5248 RSC; B. Donnio, S. Buathong, I. Bury and D. Guillon, Chem. Soc. Rev., 2007, 36, 1495 RSC; J. T. Soltysiak, E. Bialecka-Florjanczyk and J. Przedmojski, Eur. Polym. J., 2006, 42, 1662 CrossRef PubMed; H. Finkelmann and G. Rehage, Macromol. Rapid Commun., 1980, 1, 31 CrossRef; K. Hiraoka, M. Kobayasi, R. Kazama and H. Finkelmann, Macromolecules, 2009, 42, 5600 CrossRef; W. Kossack, P. Papadopoulos, P. Heinze, H. Finkelmann and F. Kremer, Macromolecules, 2010, 43, 7532 CrossRef; H. Finkelmann, S. T. Kim, A. Munoz, P. Palffy-Muhoray and B. Taheri, Adv. Mater., 2001, 13, 1069 CrossRef.
- K. Kaneko, Y. Miwa and N. Nakamura, J. Appl. Polym. Sci., 2007, 105, 2474 CrossRef CAS; Z. Cheng, H. Cao, D. Zhao, W. Hu, W. He, X. Yuan, J. Xiao, H. Zhang and H. Yang, Liq. Cryst., 2011, 38, 9 CrossRef; D. Lacey and T. E. Mann, Liq. Cryst., 2003, 30, 1159 CrossRef; L.-M. Liu, B.-Y. Zhang, X.-Z. He and C.-S. Cheng, Liq. Cryst., 2004, 31, 781 CrossRef; R. Zniber, R. Achour, M. Z. Cherkaoui, B. Donnio, L. Gehringer and D. Guillon, J. Mater. Chem., 2002, 12, 2208 RSC.
- A. S. Mocanu, M. Amela-Cortes, Y. Molard, V. Circu and S. Cordier, Chem. Commun., 2011, 47, 2056 RSC; Q. Song, D. Nannenmacher, F. Giesselmann and R. P. Lemieux, J. Mater. Chem. C, 2013, 1, 343 RSC.
- D.-Y. Kim, S. Kim, S.-A. Lee, Y.-E. Choi, W.-J. Yoon, S.-W. Kuo, C.-H. Hsu, M.-J. Huang, S. H. Lee and K.-U. Jeong, J. Phys. Chem. C, 2014, 118, 6300 Search PubMed; I. Imae and Y. Kawakami, J. Mater. Chem., 2005, 15, 4581 RSC; V. V. Tsukruk, T. J. Bunning, H. Korner, C. K. Ober and W. W. Adams, Macromolecules, 1996, 29, 8706 CrossRef CAS.
- D. R. Medeiros, M. A. Hale, R. J. P. Hung, J. K. Leitko and C. G. Willson, J. Mater. Chem., 1999, 9, 1453 RSC; C. Keith, G. Dantlgraber, R. A. Reddy, U. Baumeister, M. Prehm, H. Hahn, H. Lang and C. Tschierske, J. Mater. Chem., 2007, 17, 3796 RSC.
- A. R. Jennings and D. Y. Son, Chem. Commun., 2013, 49, 3467 RSC.
- S. Leng, B. Wex, L. H. Chan, M. J. Graham, S. Jin, A. J. Jing, K.-U. Jeong, R. M. V. Horn, B. Sun, M. Zhu, B. R. Kaafarani and S. Z. D. Cheng, J. Phys. Chem. B, 2009, 113, 5403 CrossRef CAS PubMed; K.-U. Jeong, S. Jin, J. J. Ge, B. S. Knapp, M. J. Graham, J. Ruan, M. Guo, H. Xiong, F. W. Harris and S. Z. D. Cheng, Chem. Mater., 2005, 17, 2852 CrossRef; A. Yamaguchi, N. Uehara, J. Yamamoto and A. Yoshizawa, Chem. Mater., 2007, 19, 6455 CrossRef; K.-U. Jeong, D.-K. Yang, M. J. Graham, Y. Tu, S.-W. Kuo, B. S. Knapp, F. W. Harris and S. Z. D. Cheng, Adv. Mater., 2006, 18, 3229 CrossRef; H.-J. Sun, C.-L. Wang, I.-F. Hsieh, C.-H. Hsu, R. M. V. Horn, C.-C. Tsai, K.-U. Jeong, B. Lotz and S. Z. D. Cheng, Soft Matter, 2012, 8, 4767 RSC.
- C. Ye, G. Xu, Z.-Q. Yu, J. W. Y. Lam, J. H. Jang, H.-L. Peng, Y.-F. Tu, Z.-F. Liu, K.-U. Jeong, S. Z. D. Cheng, E.-Q. Chen and B. Z. Tang, J. Am. Chem. Soc., 2005, 127, 7668 CrossRef CAS PubMed; K.-U. Jeong, B. S. Knapp, J. J. Ge, M. J. Graham, Y. Tu, S. Leng, H. Xiong, F. W. Harris and S. Z. D. Cheng, Polymer, 2006, 47, 3351 CrossRef PubMed; S. Leng, L. H. Chan, J. Jing, J. Hu, R. M. Moustafa, R. M. V. Horn, M. J. Graham, B. Sun, M. Zhu, K.-U. Jeong, B. R. Kaafarani, W. Zhang, F. W. Harris and S. Z. D. Cheng, Soft Matter, 2010, 6, 100 RSC.
- I. Dierking, Textures of Liquid Crystals, Wiley-VCH, Weinheim, 2003 Search PubMed.
- H. Shen, K.-U. Jeong, H. Xiong, M. J. Graham, S. Leng, J. X. Zheng, H. Huang, M. Guo, F. W. Harris and S. Z. D. Cheng, Soft Matter, 2006, 2, 232 RSC; S.-W. Kuo, H.-F. Lee, W.-J. Huang, K.-U. Jeong and F.-C. Chang, Macromolecules, 2009, 42, 1619 CrossRef CAS.
- S.-H. Hwang, S.-J. Park, H.-Y. Kim, S.-W. Kuo, S. H. Lee, M.-H. Lee and K.-U. Jeong, J. Phys. Chem. B, 2009, 113, 5843 CrossRef CAS PubMed.
- Y.-F. Huang, Y.-W. Chian, J. Ruan, S. Jin, K.-U. Jeong, H.-Y. Tang and A.-C. Su, Polymer, 2011, 52, 4114 CrossRef CAS PubMed.
Footnote |
| † Electronic supplementary information (ESI) available: 1H NMR, 13C NMR, and detailed experimental procedures. See DOI: 10.1039/c4sm02239d |
| This journal is © The Royal Society of Chemistry 2015 |

