 Open Access Article
Thermoelectric properties of pulsed current sintered nanocrystalline Al-doped ZnO by chemical vapour synthesis
Devendraprakash
Gautam
*,
Markus
Engenhorst
,
Carolin
Schilling
,
Gabi
Schierning
,
Roland
Schmechel
and
Markus
Winterer
Faculty of Engineering and Center for Nanointegration Duisburg-Essen (CENIDE), University of Duisburg-Essen, 47057 Duisburg, Germany. E-mail: devendraprakash.gautam@uni-due.de
First published on 22nd October 2014
Abstract
ZnO is a promising n-type oxide thermoelectric material, which is stable in air at elevated temperatures. In the present study, we report the bottom-up approach to create Al-doped ZnO nanocomposites from nanopowders, which are prepared by chemical vapour synthesis. With our synthesis route, we are able to create highly doped Al-containing ZnO nanocomposites that exhibit bulk-like electrical conductivity. Moreover, the impact of the microstructure of the nanocomposites on their thermal conductivity is enormous, with a value of 1.0 W m−1 K−1 for 1% Al–ZnO at room temperature, which is one of the lowest values reported, to date, on ZnO nanocomposites. The optimization of the Al-doping and microstructure with respect to the transport properties of bulk Al–ZnO nanocomposites leads to a zT value of about 0.24 at 950 K, underlining the potential of our technique.
Introduction
Nanostructured materials based on alloys, namely, tellurides, skutterudites, transition-metal silicides and Si–Ge alloys, exhibit good thermoelectric properties.1,2 However, their practical utilization is limited because they cannot be operated in air due to their oxidation and the high cost of the materials. Metal oxides are potential candidates for high temperature thermoelectric applications because they are thermally stable in air and show excellent durability. In particular, zinc oxide (ZnO) has been investigated as an n-type thermoelectric material for high temperature applications because of its better conversion efficiency compared to other oxides, abundance, non-toxicity and low cost.3,4The thermoelectric conversion efficiency of a material is closely related to the dimensionless figure of merit zT, which is given as follows:
 | (1) |
The thermoelectric efficiency can be enhanced by the maximization of the power factor (α2σ) and reduction of the thermal conductivity. The power factor can be optimized by band gap engineering5,6 or doping. However, the most common approach for the figure of merit enhancement is to reduce the total thermal conductivity. In particular, the lattice contribution can be altered by nanostructuring and placing nanoprecipitates in the matrix;7–9 therefore, creating abundant grain boundaries, which scatter phonons more strongly than electronic charge carriers.
For using nanostructured materials in thermoelectric devices, bulk solids are required. One of the methods to create bulk nanostructured materials is the bottom-up approach, in which nanoparticles are compacted into a bulk material. Chemical vapour synthesis (CVS) is a facile method for the continuous production of nanoparticles that can be up-scaled to industrial levels.10 The CVS route is advantageous for tailoring the powder properties, such as particle diameter, size distribution, morphology, crystallinity and doping concentration. The sintering of nanoparticles also offers a promising route for the synthesis of bulk samples with nanoscale constituents. However, the challenges during the sintering process are to limit the grain growth and to preserve a high density of grain boundaries. Pulsed electric current sintering (PECS) is a rapid sintering technique in which pulsed electric current and uniaxial pressure are simultaneously applied. It has been successfully demonstrated to manufacture bulk nanoscaled bodies.11
In this work, we report the high temperature electrical and thermal properties of Al-doped ZnO (AZO) nanocomposites. The AZO nanoparticles are prepared by the CVS route, which are then processed into bulk nanocomposites using PECS. The structural and thermoelectric properties of the sintered ceramic pellets are characterized. This study demonstrates the impact of the processing technique on the incorporation of a high amount of electrically active Al-dopant, as reflected in the high electrical conductivity value of about 105 S m−1 and low Seebeck coefficient of about −50 μV K−1 at room temperature. In addition, the thermal conductivity is drastically decreased to an extremely low value of 1.0 W m−1 K−1 at ambient temperature. In regards to the obtained data, we discuss how the doping of nano-microstructure and composite phase-mixture of ZnO and ZnAl2O4 in the sintered samples affect the charge transport, and thus the thermoelectric performance of AZO nanocomposites.
Experimental details
Synthesis of nanoparticles
ZnO and AZO nanoparticles are prepared by CVS using a hot-wall reactor. The set-up consists of a precursor delivery unit, a hot-wall reactor and a thermophoretic particle collector. The set-up is described in detail elsewhere.12,13 The precursor unit comprises of two bubblers filled with liquid precursors, diethylzinc (DEZn) and triethylaluminium (TEAl), which are placed in a temperature-controlled oil bath to adjust the vapour pressure of the precursors. The precursors DEZn and TEAl are transported into the reactor chamber using helium as the carrier gas. Oxygen acting as a reaction gas with a flow rate of 1000 sccm (standard cubic centimeter per minute) is added to the helium–precursor mixture just before the gas mixture enters the reactor to avoid preliminary oxidation of the precursors. Thermal mass flow controllers are used to control the flow rates of the gases. The reactor consists of a ceramic alumina tube heated by a tube furnace. The synthesis temperature equal to the wall temperature of alumina tube is fixed at 1173 K. The precursors and oxygen react in the reaction zone to form oxide particles, which are subsequently transported to the thermophoretic particle collector by the gas stream. AZO powders are prepared by adjusting the desired mass flow of the DEZn and TEAl vapours, which is achieved by altering the oil bath temperatures and the helium flow rates through the precursors corresponding to nominal doping concentration of 0, 0.5, 1, 2 and 8 at% Al in the particles. In the collector, a thermophoretic force acts on the particles because of the temperature gradient between the hot quartz lamps and the water-cooled wall of the collector, where the particles are finally deposited. The powder is mechanically removed from the wall by a scraper. The process pressure is maintained at 20 mbar by a butterfly valve and measured by a capacitive absolute pressure gauge placed at the outlet of the reactor.Processing to bulk nanocomposites
The compaction of AZO and ZnO nanopowders into bulk nanocomposites is achieved using the PECS technique. A FCT HP D5/2 (FCT Systeme GmbH, Rauenstein, Germany) instrument is used for sintering. The powder is loaded into a graphite die with an inner diameter of 20 mm fabricated from high strength graphite. A graphite foil coated with boron nitride (BN) is used to avoid the contact of the powder with the inner surface of the die. BN is used as a high temperature electrical insulator to ensure that the current flows through the powder and not through the dies during sintering. To reduce the radial temperature gradient in the dies and to minimize radiation heat losses, the complete die assembly is surrounded with carbon wool. The nanopowders are pre-pressed at 12 MPa and heated by a pulsed electric current with a heating rate of 100 K min−1 to the desired sintering temperature. A pulse pattern of 10![[thin space (1/6-em)]](https://www.rsc.org/images/entities/char_2009.gif) :
:![[thin space (1/6-em)]](https://www.rsc.org/images/entities/char_2009.gif) 5 (10 ms on and 5 ms off) is used for sintering the samples. The samples are sintered at 700 °C or 900 °C with a holding time of 3 minutes. A uniaxial pressure of 35 MPa is applied to the specimens over the entire heating and cooling cycle. The samples are cooled to 500 °C at a cooling rate of 100 K min−1. Furthermore, the samples are furnace cooled to room temperature with a continuous release of applied pressure. The heating power is adjusted using a pyrometer, which monitors the temperature at the bottom of the upper graphite push-punch of the dies. The whole sintering procedure is performed under 1 mbar Ar atmosphere. The graphite foils on the surface of the sintered samples are removed by grinding.
5 (10 ms on and 5 ms off) is used for sintering the samples. The samples are sintered at 700 °C or 900 °C with a holding time of 3 minutes. A uniaxial pressure of 35 MPa is applied to the specimens over the entire heating and cooling cycle. The samples are cooled to 500 °C at a cooling rate of 100 K min−1. Furthermore, the samples are furnace cooled to room temperature with a continuous release of applied pressure. The heating power is adjusted using a pyrometer, which monitors the temperature at the bottom of the upper graphite push-punch of the dies. The whole sintering procedure is performed under 1 mbar Ar atmosphere. The graphite foils on the surface of the sintered samples are removed by grinding.
Characterization
The phase composition, crystal structure and isotropic crystallite size of the as-prepared nanopowders and sintered nanocomposites are determined by X-ray diffraction (XRD) using a PANalytical X-ray diffractometer (X-Pert PRO) with Ni-filtered Cu Kα (0.154 nm) radiation detected by an X-Celerator detector. The data are measured in the 2θ range = 20–120° and analyzed by Rietveld refinement using the MAUD software.14 The geometric density of the sintered samples is determined from the sample mass and geometry. The nano-microstructure and elemental analysis of the as-synthesized powders and sintered pellets are characterized by a high-resolution scanning electron microscope (SEM, JEOL-JSM 7500 F) using a scanning transmission detector (STEM) equipped with an energy dispersive X-ray analyser (EDX, QX200 Bruker Quantax 2000).The electrical conductivity and the Seebeck coefficient of the sintered nanocomposites are measured under He atmosphere at 100 mbar using a ZEM-3 from Ulvac-Riko, Inc. The thermal conductivity is determined by the laser flash method using a LFA 457 Microflash from Netzsch-Gerätebau GmbH under atmospheric pressure at a flow of 75 sccm N2. Because of the limited sample geometry within the available measurement techniques, the thermal transport is measured parallel to the direction of the pressing force and the sintering current, whereas the electrical transport is characterized perpendicular to this direction. This aspect has to be taken into account when both transport processes are considered in combination.
Results and discussion
Microstructure of nanoparticles and nanocomposites
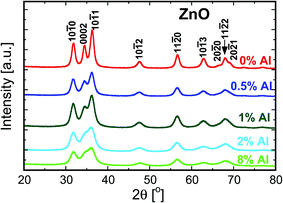
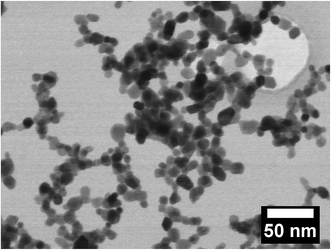
Fig. 1 depicts the XRD patterns of the as-synthesized ZnO nanoparticles doped with 0, 0.5, 1, 2 and 8% of Al. The patterns show that the doped and undoped particles exhibit the hexagonal wurtzite structure and exist in a single phase. It has been reported that the thermodynamic solubility limit of Al in ZnO is below 1%.15,16 Even though in the present study the doping exceeded the solubility limit, we did not observe a second phase in the as-prepared nanopowders. This could be because of the CVS method, which is a non-equilibrium process, and therefore allows the incorporation of more dopant than permitted by the thermodynamic limit.12,13 The continuous increase in the broadening of the XRD signals with increasing Al concentration (see Fig. 1) indicates that the crystallite size of the particles decreases. Both the crystallite size and the microstrain are determined from the Rietveld refinement of the data and are plotted as a function of Al concentration in Fig. 2. The addition of Al as a dopant hinders the growth rate of the nanoparticles because of the impurity drag, which results in smaller crystallites. It can also be seen from Fig. 2 that the lattice microstrain increases with Al concentration, indicating that Al is incorporated into the ZnO lattice. The findings are in agreement with the previous studies.17,18Fig. 3 shows the STEM micrograph of undoped ZnO nanopowders, which consists of nearly spherical crystalline particles with a small degree of agglomeration with a mean diameter of 15 nm, thus substantiating the XRD data.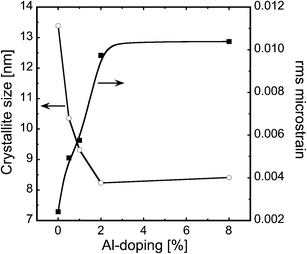 | ||
| Fig. 2 Evolution of crystallite size and microstrain as a function of the nominal Al concentration for the as-prepared AZO nanoparticles. | ||
The XRD patterns of undoped and 8% Al-doped pellets sintered at 900 °C are shown in Fig. 4. As is evident by the narrower Bragg reflections, substantial grain growth occurred during sintering. Most of the Bragg reflections for the AZO nanocomposites belong to the hexagonal wurtzite phase, similar to that of undoped ZnO. Moreover, the patterns reveal the presence of a ZnAl2O4 spinel phase (gahnite). This additional phase is observed in the patterns when the nanocomposites have an Al concentration ≥1% at the sintering temperature of 900 °C. The XRD pattern of undoped ZnO sintered at 900 °C shows significant texturing. The intensity of the (0002) reflection is strongly decreased, while for the (10![[1 with combining macron]](https://www.rsc.org/images/entities/char_0031_0304.gif) 0) reflection, the intensity is increased compared to the undoped nanoparticles. This indicates a preferential growth along the c-axis of the crystals,19 suggesting that the externally applied pressure and the pulsed current during sintering define the texture direction. The addition of Al as a dopant in the nanocomposites enhances the intensity of the (0002) reflection in comparison with the (10
0) reflection, the intensity is increased compared to the undoped nanoparticles. This indicates a preferential growth along the c-axis of the crystals,19 suggesting that the externally applied pressure and the pulsed current during sintering define the texture direction. The addition of Al as a dopant in the nanocomposites enhances the intensity of the (0002) reflection in comparison with the (10![[1 with combining macron]](https://www.rsc.org/images/entities/char_0031_0304.gif) 0) reflection, as seen in Fig. 4, indicating a change in the anisotropy of the surface enthalpy of the particles. This modifies the growth direction and dynamics with the presence of Al in the samples.20,21
0) reflection, as seen in Fig. 4, indicating a change in the anisotropy of the surface enthalpy of the particles. This modifies the growth direction and dynamics with the presence of Al in the samples.20,21
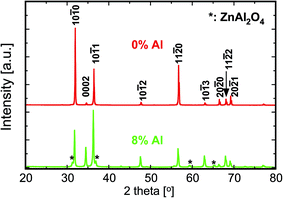 | ||
| Fig. 4 X-ray diffractograms of the undoped and 8% Al-doped ZnO nanocomposites sintered at 900 °C by PECS. | ||
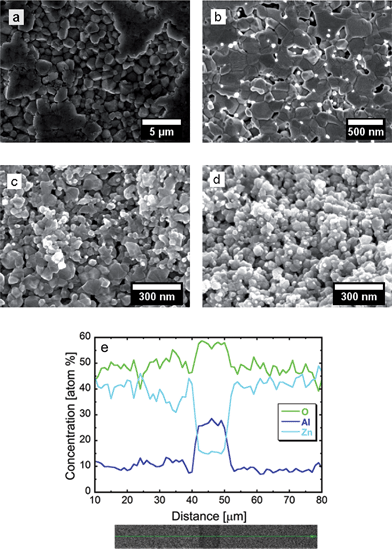
Fig. 5 shows the SEM micrographs of the fresh fracture surface of AZO nanocomposites. The structure of undoped ZnO sintered at 900 °C shows a grain size of 1–2 μm having a hexagonal cross-section with intense faceting in the material. The faceting substantiates the XRD observation of the preferred growth along the c-axis of the ZnO lattice. The hexagonal cross-sectional structures are created because of the lower energy associated with these facets.20 The micrographs for the AZO nanocomposites reveal that ZnO grains are interspersed with the spinel ZnAl2O4 phase, which precipitates at the ZnO grain boundaries. The presence of Al in the nanocomposites inhibits the growth of ZnO grains, and the average size is confined in the range of 80–200 nm. The size of the ZnAl2O4 precipitates is in the order of 10–50 nm. The grain growth for both ZnO and ZnAl2O4 depends on the sintering temperature, as well as on the Al concentration in the material. Grain/crystallite growth is restricted because of the Al-doping not only during particle synthesis, but also during sintering due to the pinning of the grain boundaries.17,19 In addition, the presence of Al changes the surface energy of the (0001) facet, which can give rise to twins and planar defects.21 The morphology of the grains changes from hexagonal, as observed for undoped ZnO (see Fig. 5a), to a plate/planar-like structure for AZO nanocomposites, as shown in Fig. 5b–d. The addition of Al suppresses the grain boundary mobility, thus enabling the pores to remain on the moving boundaries during sintering. Thus, most of the porosity is located in the vicinity of the ZnAl2O4 precipitates, as revealed in the SEM micrographs (see Fig. 5b–d). These porous materials with fine grains may act as good thermoelectric materials because their thermal conductivity can be significantly reduced without considerably affecting their electrical conductivity. The EDX line-scan across a region, particularly at a distance of 40–50 μm (see Fig. 5e), in the 8% AZO sample shows an enhancement of Al and O concentration in the nanoprecipitates region, consistent with the formation of ZnAl2O4, as substantiated by the XRD pattern of the sintered pellets (see Fig. 4).
The bulk relative density of the sintered samples is in the range of 65–93%. The density of the specimens is affected both by the sintering temperature and the Al concentration in the samples. Increasing amounts of Al in the material, as well as high sintering temperatures, create more ZnAl2O4 precipitates. This makes densification increasingly difficult because of the difference in the physical properties of ZnAl2O4 and ZnO. This observation is in agreement with the previous findings in the literature.22
Dependence of the transport properties of nanocomposites on Al concentration
The room temperature electrical conductivities of the nanocomposites sintered at 700 °C and 900 °C as a function of Al concentration are illustrated in Fig. 6. The undoped ZnO sample sintered at 900 °C has a room temperature electrical conductivity of 3 × 10³ S m−1. The addition of 0.5% Al enhances the conductivity by two orders of magnitude to 1.5 × 10⁵ S m−1. The substitution of Zn2+ by Al3+ increases the free charge carrier concentration to compensate for the electrical charge balance, and in turn the electrical conductivity of the sample.17,23 This value is one of the highest for ZnO nanocomposites and is comparable to the bulk value of about 2 × 10⁵ S m−1.24,25 In contrast, Nam et al. reported an electrical conductivity of about 1.3 × 10⁴ S m−1 for ZnO nanocomposites.26 This indicates that with our processing method we are able to prepare nanocomposites incorporating an active dopant in the material. On further addition of Al, the conductivity slightly decreased for the samples sintered at 900 °C.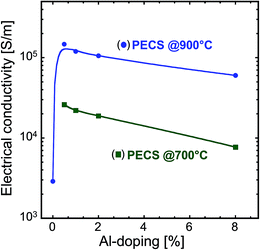 | ||
| Fig. 6 Room temperature electrical conductivity as a function of Al concentration for the nanocomposites sintered at 700 °C and 900 °C. | ||
The samples sintered at 700 °C exhibit lower electrical conductivity compared to those sintered at 900 °C and their conductivity decreases in a similar pattern with increasing Al concentration (see Fig. 6). First, an increasing fraction of the non-conductive ZnAl2O4 phase reduces the volume available for the charge transport. Second, we suggest that smaller AZO grains and more ZnAl2O4 precipitate enhances the scattering of the charge carriers in increasingly doped samples, thus decreasing their mobility, and in turn the electrical conductivity. This suggestion is in accordance with the microstructural observations (see Fig. 5a–d). In addition to the mobility, the other main factor for electrical conduction, namely, the charge carrier concentration, originating from the electrically active dopant, cannot be directly obtained from the microstructural data and it is discussed in the subsequent section.
The impact of high electrical conductivity values is also observed in the Seebeck coefficient of the nanocomposites. Fig. 7 illustrates how the Seebeck coefficient varies with Al-doping for nanocomposites sintered at 700 °C and 900 °C. The measured values of the Seebeck coefficients are negative for all the samples, indicating the n-type conduction. The room temperature Seebeck coefficient of the undoped ZnO sample sintered at 900 °C is about −280 μV K−1, which is in agreement with the relatively low electrical conductivity of this sample. As anticipated, with increasing Al-doping, the absolute value of the Seebeck coefficient decreases, and reaches a value of about −50 μV K−1 at 0.5% Al. The further addition of Al does not have considerable impact on the values of the Seebeck coefficient for the samples sintered at 900 °C. As mentioned above, Al-doping results in the increase in charge carrier concentration by the substitution of Zn by Al at the Zn-site, but this effect is confined by the low solubility limit. Interestingly, even though the electrical conductivities of the samples sintered at 700 °C and 900 °C are remarkably different (see Fig. 6 and 7), their Seebeck coefficient values are very similar, confirming the assumption of Kinemuchi et al.4 and Nam et al.26 that the impact of grain boundaries in the nanocomposite is less significant on the Seebeck coefficient than on the electrical conductivity. However, it is worth noting that we observe a local minimum in the room temperature Seebeck coefficient at 1% Al-doping for both the sintering temperatures. In the case of the sample sintered at 700 °C, the electrical conductivity only slightly decreased compared to the sample with 0.5 Al%-doping, and the power factor reaches a maximum value at this dopant concentration amongst the samples sintered at 700 °C.
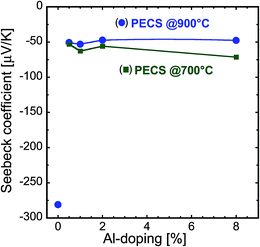 | ||
| Fig. 7 Room temperature Seebeck coefficient as a function of Al concentration for the nanocomposites sintered at 700 °C and 900 °C. | ||
The impact of the nanostructure on the thermal conductivity of sintered samples is enormous. Fig. 8 illustrates how the room temperature thermal conductivity of the samples sintered at 700 °C and 900 °C varies as a function of Al content. Undoped ZnO sintered at 900 °C exhibits a room temperature thermal conductivity of about 40 W m−1 K−1, similar to the bulk value.3,27,28 This phenomenon is expected because the specimen contains grains in the micrometer range (see Fig. 5a), considerably larger than the mean free path of about 30 nm for phonons in ZnO.29,30 The addition of Al in the ZnO nanopowders decreases the thermal conductivity of the sintered nanocomposites. The amount of reduction in thermal conductivity depends on the sintering temperature and the Al content. In the case of the samples sintered at 900 °C, the thermal conductivity decreases with increasing Al content, reaching its minimum of 7 W m−1 K−1 at 8% Al-doping. However, the samples sintered at 700 °C exhibit considerably lower values and have a pronounced minimum at a doping concentration of 1% Al. The thermal conductivity of this sample is reduced by a factor of 40, compared to the bulk and reaches a value of about 1.0 W m−1 K−1, which is one of the lowest reported for oxide materials. Our findings on the low thermal conductivity of nanocomposites are in agreement with the recently reported observations on AZO thin films by Loureiro et al.31 Kinemuchi et al.4,29 reported that the thermal conductivity of ZnO nanocomposites can reach values below 5 W m−1 K−1 when the grain size is around 50 nm, whereas Nam et al.26 found reductions for grain sizes below 200 nm. Because the phonon mean free path in ZnO is approximately 30 nm,29,30 our findings of a strong reduction in the thermal conductivity for grain sizes of ZnO in the range of 50–100 nm agree well with these reported values. The smaller grains of ZnAl2O4 (10–30 nm, see Fig. 5c, d and 8) also have a major impact on the decrease of thermal conductivity. We attribute this strong reduction in the total thermal conductivity to the reduction in the lattice contribution by the increased phonon scattering from the ZnAl2O4 precipitates, point defects, porosity and refined nanograins by Al-doping.
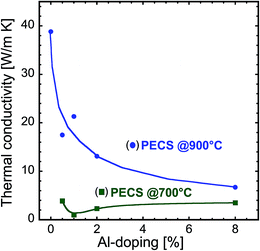 | ||
| Fig. 8 Variation of room temperature thermal conductivity as a function of Al concentration for the nanocomposites sintered at 700 °C and 900 °C. | ||
Dependence of transport properties of the sintered samples on temperature
As a representative example for illustrating and discussing the charge transport of doped nanocomposites, we used 1% AZO sample and compared it with the undoped specimen. The Seebeck coefficient α of the nanocomposites as a function of measuring temperature is illustrated in Fig. 9 for undoped and 1% AZO nanocomposites sintered at 700 °C and 900 °C. For the undoped ZnO specimen sintered at 900 °C, the Seebeck coefficient has large negative values in the range of −280 to −350 μV K−1 indicating a low charge carrier concentration. However, the Al-doped samples exhibit a low absolute value of the Seebeck coefficient over the complete temperature interval, highlighting the enhancement in the concentration of free charge carriers, as previously discussed. As illustrated in Fig. 9, the Seebeck coefficient decreases with temperature, which is in agreement with the findings in the literature for bulk doped-ZnO ceramics.3,32–34 Similar results were also reported for doped nanocomposites.4,26,29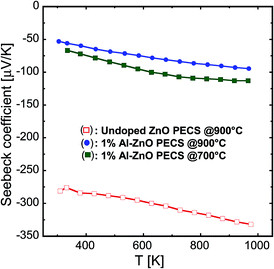 | ||
| Fig. 9 Temperature dependence of the Seebeck coefficient of the nanocomposites sintered at 700 °C and 900 °C. | ||
The temperature dependence of the Seebeck coefficient of a degenerate semiconductor can be described using the Jonker and Pisarenko relationship,8 as expressed in eqn (2)
 | (2) |
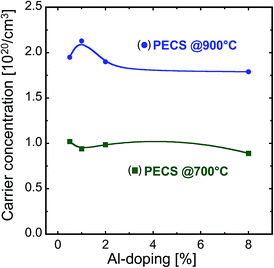
The charge carrier concentration for different samples is plotted in Fig. 10. It can be seen that the carrier concentration in all the sintered samples is considerably high, with values in the order of 1020 cm−3, satisfying the criterion of degeneracy. For those samples sintered at 900 °C, we find values that are a factor of 3 to 4 times larger than for the samples sintered at 700 °C, indicating that at higher sintering temperatures more Al is incorporated into the ZnO lattice. Considering the amount of Al-dopants, the carrier concentration is of the same order as the theoretical concentration35 for 0.5% Al, highlighting the effectiveness of our synthesis route to prepare highly doped material (see Fig. 10 and ref. 35). For higher Al contents, the evaluated carrier concentration is different from the theoretical Al content, indicating that only a limited fraction of added Al might be effective as the dopant and the remaining Al is precipitated as ZnAl2O4 spinel phase, as demonstrated by the XRD and SEM micrographs of the sintered samples.
Fig. 11 shows the temperature dependence of the electrical conductivity σ of the undoped and 1% AZO nanocomposites. All the samples exhibit decreasing electrical conductivity with increasing temperature, indicating a metallic or strongly degenerate behaviour. It should be noted that even for undoped ZnO, we observe the same tendency, though the absolute values are considerably lower than for the Al-doped samples.
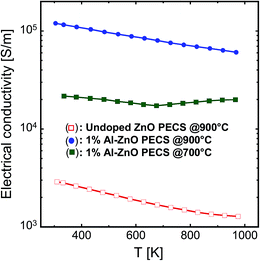 | ||
| Fig. 11 Temperature dependence of the electrical conductivity of the nanocomposites sintered at 700 °C and 900 °C. | ||
The electrical conductivity can be expressed as follows:
| σ = neμe | (3) |
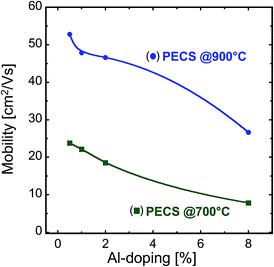
Taking into account eqn (3) and the charge carrier concentrations from Fig. 10, the room temperature mobility of the charge carriers can be evaluated from the electrical conductivity. By dividing the evaluated average mobility of the charge carriers with the relative density of the samples, we obtain a normalized mobility value for the charge carriers. This normalized mobility takes into account the electrically active volume of the samples and more directly reflects the influence of the nano-microstructure on the transport of the charge carriers. The normalized mobility is illustrated for the room temperature values as a function of Al content in Fig. 12. The mobility of the charge carriers in the sintered nanocomposites decreases with increasing Al-doping in the material, irrespective of the sintering temperature, which is in agreement with the previous reports.35–37 At room temperature, the mobility of the charge carriers in most of the samples is well in the range of undoped and Al-doped polycrystalline bulk ZnO (20–80 cm2 V−1 s−1)35 and pulsed laser deposited thin films (30–10 cm2 V−1 s−1, decreasing with increasing Al-content).37 However, it should be noted that Baxter et al.38 reported higher mobility values for undoped ZnO thin films and nanowires and showed that annealing enhances the mobility of the charge carriers (140–230 cm2 V−1 s−1). The high mobility found for the sample with 0.5% Al content sintered at 900 °C (53 cm2 V−1 s−1) suggests that even though this sample has grains of about 200 nm and that the spinel ZnAl2O4 phase is present as observed from the structural evaluation, the microstructure has little influence on the transport of the charge carriers in this sample. A further increase in the Al content, however, increases the amount of ZnAl2O4 nanoprecipitates, which scatter the charge carriers, thus decreasing the mobility. In the case of the samples sintered at 700 °C, the lower mobility values indicate that the microstructure of the specimens contains smaller grains, and therefore an increased fraction of grain boundaries more effectively scatters the charge carriers (see Fig. 5c and d). We cannot directly conclude that the increase in the volume fraction of the spinel ZnAl2O4 phase with Al-doping is solely responsible for the mobility reduction and in turn for the electrical conductivity because the amount of the spinel phase is considerably less than the observed diminution in the mobility of the sintered nanocomposites. As already seen from the dependence of the Seebeck coefficient and electrical conductivity on the doping concentration, we also find from their dependence on temperature that the nanostructure and composite nature has an impact on the electrical conductivity, but not on the Seebeck coefficient of the sintered samples, thus supporting the hypothesis by Nam et al.26
The thermal conductivity κ of the nanocomposites is shown in Fig. 13. It rapidly decreases with the temperature for undoped ZnO, as also reported by Ohtaki et al.3 Doping with Al not only significantly reduces the thermal conductivity of the samples, but also modifies the temperature dependence of κ, as illustrated for 1% Al-doped specimen. It can also be seen that the sample sintered at 700 °C with 1% Al content displays the lowest κ of all the measured specimens and its behaviour is temperature independent. Kinemuchi et al.4,29 observed a similar dependence of κ on grain size and temperature. We conclude that phonon–phonon scattering is responsible for the decrease in thermal conductivity with increasing temperature in the case of undoped ZnO.35,39 In addition, in the case of the Al-doped nanocomposites, the significant reduction in phonon transport occurs because of grain boundary scattering at ZnO nanograins, ZnAl2O4 precipitates, point defects and pores present in the sample.29,36,39 We estimate the electronic contribution κe to the total thermal conductivity using the Wiedemann–Franz law, κe = LσT, where L is the Lorenz number (2.44 × 10⁻⁸ V2 K−2).40 The electronic contribution to the thermal conductivity κe amounts to about 8–43% at 900 K for all the measured samples, implying that the major contribution to the total thermal conductivity is because of the lattice conductivity κL. Therefore, the nanocomposite microstructure of the samples significantly influences the thermal conductivity, and we are able to drastically reduce the lattice contribution to the total thermal conductivity, as reflected in the low κ values and the increasing contribution from the electronic carriers to the thermal conductivity.
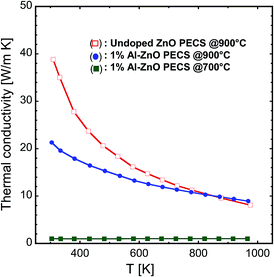 | ||
| Fig. 13 Temperature dependence of the thermal conductivity of the nanocomposites sintered at 700 °C and 900 °C. | ||
Thermoelectric figure of merit
The numerical values for the dimensionless figure of merit zT resulting from the calculation using eqn (1) are shown in Fig. 14. These values have to be evaluated with care because thermal and electrical transports are measured in perpendicular directions. However, the dependence of zT on temperature features a considerably smooth slope, and this behaviour is assumed to be rather insensitive against possible anisotropy within the sample, allowing for a comparison amongst our samples and with temperature dependent data reproduced from Jood et al.36 Because of the massive increase in electrical conductivity above 850 K, their zT shows a kink, whereas our samples exhibit a considerable smoother dependence of zT on temperature. A figure of merit that is high over a wide temperature range is advantageous for power generation in large thermal gradients. The highest value for zT of 0.24 at 965 K is calculated for nanocomposites doped with 1% Al sintered at 700 °C, as illustrated in Fig. 14. This sample exhibits a slightly higher absolute Seebeck coefficient than all other doped samples. Together with an only slight decrease in the electrical conductivity compared to the sample with 0.5% Al-content sintered at 700 °C, this results in the highest power factor amongst the samples sintered at 700 °C, and coupled with a strong reduction in the thermal conductivity, results in the highest zT amongst all the sintered nanocomposites.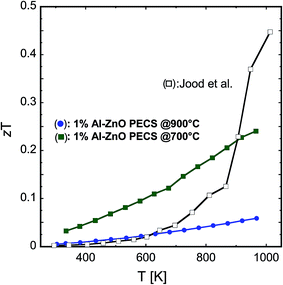 | ||
| Fig. 14 Temperature dependence of the figure of merit zT for 1% AZO nanocomposites sintered at 700 °C and 900 °C. The present study is compared to the data from Jood et al. (see ref. 36). | ||
We have demonstrated that nanostructuring and the composite nature of the material significantly affect the thermal and electrical transports because of the scattering of phonons and charge carriers at the grain boundaries and nanoprecipitates, while only a minor influence is observed on the Seebeck coefficient because the concentration of active charge carriers does not significantly vary beyond the solubility limit of Al in ZnO. However, the Al content beyond the solubility limit can be used to tailor the nano-microstructure in such a fashion that the lattice contribution to the thermal conductivity is significantly reduced. Thus, we optimized the ratio of σ/κ to enhance zT of the material.
Conclusions
We synthesized Al-doped ZnO nanoparticles by chemical vapour synthesis in a hot-wall reactor. The powders were compacted into bulk nanocomposites by pulsed electric current sintering. The structural characterization shows that the presence of Al-dopant inhibits grain growth, both in the synthesized nanopowders and in the sintered nanocomposites. The impact of Al-doping, nanograins/grain boundaries and ZnAl2O4 nanoprecipitates, i.e., the microstructure of the nanocomposites, on the thermoelectric properties were demonstrated. With our processing methodology, we were able to create efficient Al-doping in ZnO, which produced bulk-like electrical conductivity and a strong reduction in the thermal conductivity of the nanocomposites at room temperature. We observed a strong correlation between the microstructure and the thermoelectric properties of the sintered nanocomposites. However, the detailed mechanism of the impact of the microstructure on the transport of the charge carriers requires further investigations. With this knowledge, a further tuning of the thermoelectric properties would be possible.Acknowledgements
The authors are thankful to Dr Christian Notthoff, University of Duisburg-Essen, for SEM/EDX imaging. The authors gratefully acknowledge the financial support by the European Union and Ministry of Economic Affairs and Energy of the State North Rhine-Westphalia in Germany (Objective 2 Programme: European Regional Development Fund, ERDF). Moreover, financial support in the framework of a young investigator grant by the Ministry for innovation, science and research of the State North Rhine-Westphalia in Germany is gratefully acknowledged.References
- M. S. Dresselhaus, G. Chen, M. Tang, R. Yang, H. Lee, D. Wang, Z. Ren, J. P. Fleurial and P. Gogna, Adv. Mater., 2007, 19, 1043 CrossRef CAS.
- J. P. Heremans, C. M. Thrush and D. T. Morelli, J. Appl. Phys., 2005, 98, 063703 CrossRef PubMed.
- M. Ohtaki, T. Tsubota, K. Eguchi and H. Arai, J. Appl. Phys., 1996, 79, 1816 CrossRef CAS PubMed.
- Y. Kinemuchi, H. Nakano, M. Mikami, K. Kobayashi, K. Watari and Y. Hotta, J. Appl. Phys., 2010, 108, 053721 CrossRef PubMed.
- J. He, M. G. Kanatzidis and V. P. Dravid, Mater. Today, 2013, 16, 166 CrossRef CAS PubMed.
- J. P. Heremans, B. Wiendlocha and A. M. Chamoire, Energy Environ. Sci., 2012, 5, 5510 CAS.
- W. Kim, R. Wang and A. Majumdar, Nano Today, 2007, 2, 40 CrossRef.
- G. J. Snyder and E. S. Toberer, Nat. Mater., 2008, 7, 105 CrossRef CAS PubMed.
- W. Liu, X. Yan, G. Chen and Z. Ren, Nano Energy, 2012, 1, 42 CrossRef CAS PubMed.
- M. Winterer, Nanocrystalline Ceramics: Synthesis and Structure, Springer Verlag, Berlin, 2002 Search PubMed.
- U. Anselmi-Tamburini, J. E. Garay, Z. A. Munir, A. Tacca, F. Maglia and G. Spinolo, J. Mater. Res., 2004, 19, 3255 CrossRef CAS.
- C. Schilling, M. Zähres, C. Mayer and M. Winterer, J. Nanopart. Res., 2014, 16(2506), 1 CAS.
- S. Hartner, M. Ali, C. Schulz, M. Winterer and H. Wiggers, Nanotechnology, 2009, 20, 445701 CrossRef PubMed.
- L. Lutterotti and P. Scardi, J. Appl. Crystallogr., 1990, 23, 246 CrossRef CAS and MAUD (Material Analysis Using Diffraction) is a free Java program for Rietveld Analysis.
- M. H. Yoon, S. H. Lee, H. L. Park, H. K. Kim and M. S. Jang, J. Mater. Sci. Lett., 2002, 21, 1703 CrossRef CAS.
- K. Shirouzu, T. Kawamoto, N. Enomoto and J. Hojo, Jpn. J. Appl. Phys., 2010, 49, 010201 CrossRef.
- B. Ingham, R. Linklater and T. Kemmitt, J. Phys. Chem. C, 2011, 115, 21034 CAS.
- J. U. Brehm, M. Winterer and H. Hahn, J. Appl. Phys., 2006, 100, 064311 CrossRef PubMed.
- D. R. Clarke, J. Am. Ceram. Soc., 1999, 82, 485 CrossRef CAS PubMed.
- Z. L. Wang, J. Phys.: Condens. Matter, 2004, 16, R829 CrossRef CAS.
- Y. Ding, X. Y. Kong and Z. L. Wang, Phys. Rev. B: Condens. Matter Mater. Phys., 2004, 70, 235408 CrossRef.
- W. S. Hong, L. C. De-Jonghe, X. Yang and M. N. Rahaman, J. Am. Ceram. Soc., 1995, 78, 3217 CrossRef CAS PubMed.
- K. Hauffe and A. L. Vierk, Z. Phys. Chem., 1950, 196, 160 Search PubMed.
- Y. Kinemuchi, C. Ito, H. Kaga, T. Aoki and K. Watari, J. Mater. Res., 2007, 22, 1942 CrossRef CAS.
- T. Tsubota, M. Ohtaki, K. Eguchi and H. Arai, Proceedings of the 16th International Conference on Thermoelectrics (ICT 1997), IEEE, Piscataway, 1997, p. 240 Search PubMed.
- W. H. Nam, Y. S. Lim, S. M. Choi, W. S. Seo and J. Y. Lee, J. Mater. Chem., 2012, 22, 14633 RSC.
- G. G. Gadzhiev, High Temp., 2003, 41, 778 CrossRef CAS.
- N. Vogel-Schäuble, R. Dujardin, A. Weidenkaff and M. H. Aguirre, J. Electron. Mater., 2012, 41, 1606 CrossRef PubMed.
- Y. Kinemuchi, M. Mikami, K. Kobayashi, K. Watari and Y. Hotta, J. Electron. Mater., 2010, 39, 2059 CrossRef CAS PubMed.
- S. LeBlanc, S. Phadke, T. Kodama, A. Salleo and K. E. Goodson, Appl. Phys. Lett., 2012, 100, 163105 CrossRef PubMed.
- J. Loureiro, N. Neve, R. Barros, T. Mateus, R. Santos, S. Filonovich, S. Reparaz, C. M. Sotomayor-Torres, F. Wyczisk, L. Divay, R. Martins and I. Ferreira, J. Mater. Chem. A, 2014, 2, 6649 CAS.
- K. H. Kim, S. H. Shim, K. B. Shim, K. Niihara and J. Hojo, J. Am. Ceram. Soc., 2005, 88, 628 CrossRef CAS PubMed.
- N. Ma, J. F. Li, B. P. Zhang, Y. H. Lin, L. R. Ren and G. F. Chen, J. Phys. Chem. Solids, 2012, 71, 1344 CrossRef PubMed.
- Y. Fujishiro, M. Miyata, M. Awano and K. Maeda, J. Am. Ceram. Soc., 2003, 86, 2063 CrossRef CAS PubMed.
- T. Tsubota, M. Ohtaki, K. Eguchi and H. Arai, J. Mater. Chem., 1997, 7, 85 RSC.
- P. Jood, R. Mehta, Y. Zhang, G. Peleckis, X. Wang, R. W. Siegel, T. Borca-Tasciuc, S. X. Dou and G. Ramanath, Nano Lett., 2011, 11, 4337 CrossRef CAS PubMed.
- H. Kim, A. Piqué, J. S. Horwitz, H. Murata, Z. H. Kafafi, C. M. Gilmore and D. B. Chrisey, Thin Solid Films, 2000, 377–378, 798 CrossRef CAS.
- J. B. Baxter and C. A. Schmuttenmaer, J. Phys. Chem. B, 2006, 110, 25229 CrossRef CAS PubMed.
- E. S. Toberer, A. Zevalkink and G. J. Snyder, J. Mater. Chem., 2011, 21, 15843 RSC.
- M. Ohtaki, K. Araki and K. Yamamoto, J. Electron. Mater., 2009, 38, 1234 CrossRef CAS PubMed.
| This journal is © The Royal Society of Chemistry 2015 |

