Preparation of quantum dot/polymer light conversion films with alleviated Förster resonance energy transfer redshift†
Chih-Jung
Chen
ab,
Chee-Cheng
Lin
a,
Jiun-Yi
Lien
c,
Sue-Lein
Wang
b and
Ray-Kuang
Chiang
*a
aNanomaterials Laboratory, Far East University, Hsing-Shih, Tainan County 74448, Taiwan, Republic of China. E-mail: rkc.chem@msa.hinet.net
bDepartment of Chemistry, National Tsing Hua University, Hsinchu 30013, Taiwan, Republic of China
cDepartment of Physics, National Cheng Kung University, Tainan 70101, Taiwan, Republic of China
First published on 28th October 2014
Abstract
Hybrid quantum dot (QD)/polymer light conversion (QDPLC) films containing QDs of two or more emission colors in a high concentration are subject to inter-dot Förster resonance energy transfer (FRET), which causes an intractable photoluminescence (PL) redshift and therefore renders the desired PL color of the conversion film unfeasible. Accordingly, the present study proposes a straightforward approach for preparing QDPLC films containing green- and red-emission QD nanoclusters (5–20 nm) with a separation distance greater than 10 nm. Comparing the PL spectrum of the hybrid QDPLC film with those of films comprising only green- or red-emission QD nanoclusters, a redshift phenomenon is not observed. In other words, FRET from the green-emission QDs to the red-emission QDs (G/R FRET) does not occur. The QDPLC film is transferred onto a blue LED chip (460 nm) in order to realize a white-light-emitting device (WLED). It is shown that the WLED has CIE color coordinates of (0.282, 0.296), a correlated color temperature (CCT) of 9492 K, a color-rendering index (CRI) of 69, and a luminance efficiency (LE) of 40.4 lm W−1 under a forward current of 20 mA.
Introduction
Colloidal semiconductor nanocrystals, more commonly referred to as quantum dots (QDs), have attracted significant interest in the past thirty years or so due to their high quantum yield (QY), broad absorption band, narrow emission line width, and tunable emission wavelength.1 QDs find extensive use as light down-converters in such diverse applications as display backlights,2 solid-state lighting,3 solar cells,4 bio-labeling,5 and so on. In liquid crystal display (LCD) backlight applications, QD-based light conversion films (i.e., hybrid QD/polymer composite films containing both green- and red-emission QDs) are excited by a blue LED light source in order to generate a wide color gamut (>100% NTSC 1931) with an excellent luminance efficiency (LE).6 In such applications, adjusting the ratio of the constituent QDs of different emission colors in such a way as to achieve the desired PL spectrum is of crucial importance. However, this adjustment process is highly challenging due to complex interactions among the QDs (e.g., reabsorption and Förster resonance energy transfer (FRET)), which cause a significant redshift of the final color from the desired color.7The photons emitted from donor QDs are readily reabsorbed by acceptor QDs as a result of an overlap between the emission bands of the donors and the absorption bands of the acceptors.7a The magnitude of the resulting redshift varies proportionally with the QD concentration. However, due to application constraints, the problem cannot be resolved by simply reducing the number of QDs in the matrix. Thus, a more practical approach is to alleviate the reabsorption effect by adding transparent and high-refractive-index powders such as ZnO to the conversion film in order to reduce internal reflection and increase light extraction at the polymer–air interface.8
The dipole moments of the excitons in high-energy QDs tend to couple with the absorption band of nearby QDs with a lower band gap, given an inter-QD distance is in the range of several nanometers.9 For monodisperse QDs (with low size inhomogeneity), this coupling effect (known as FRET) presents no particular problem since, even for dense solids, very few viable acceptors with a sufficiently large band gap difference are available.10 However, in color conversion films, the polymer matrix contains large numbers of QDs with substantial band gap differences, and thus FRET readily occurs.11 For color conversion films containing green- and red-emission QDs, the FRET from the green-emission QDs to the red-emission QDs (G/R FRET) causes the PL spectrum to be strongly weighted toward the red-emission band. Studies have shown that the inter-dot FRET phenomenon can be suppressed by constructing bilayer structures comprising an alternating arrangement of red-emission QD and green-emission QD layers (or vice versa),11,12 or films consisting of alternating green and red QD arrays.13 However, the fabrication of such films is extremely complex and time-consuming. Accordingly, the present study proposes a straightforward method for fabricating single-layer QD–polymer light conversion (QDPLC) films containing both green- and red-emission QDs with minimal G/R FRET. The spectral properties of the proposed QDPLC film are compared with those of films comprising only red-emission or green-emission QDs, respectively. The QDPLC film is then transferred onto a blue LED chip with a wavelength of 460 nm in order to realize a white-light-emitting device (WLED). It is shown that the WLED has a high correlated color temperature (CCT) of 9492 K and a luminance efficiency (LE) of 40.4 lm W−1.
Experimental
Chemicals
Poly(methyl methacrylate) (PMMA, Mw ∼ 35![[thin space (1/6-em)]](https://www.rsc.org/images/entities/char_2009.gif) 000, 99%, Aldrich) and poly(methyl methacrylate-co-methacrylic acid) (PMMA-co-MA, MMA
000, 99%, Aldrich) and poly(methyl methacrylate-co-methacrylic acid) (PMMA-co-MA, MMA![[thin space (1/6-em)]](https://www.rsc.org/images/entities/char_2009.gif) :
:![[thin space (1/6-em)]](https://www.rsc.org/images/entities/char_2009.gif) MA = 1
MA = 1![[thin space (1/6-em)]](https://www.rsc.org/images/entities/char_2009.gif) :
:![[thin space (1/6-em)]](https://www.rsc.org/images/entities/char_2009.gif) 0.016, Mn ∼ 15
0.016, Mn ∼ 15![[thin space (1/6-em)]](https://www.rsc.org/images/entities/char_2009.gif) 000, Mw ∼ 34
000, Mw ∼ 34![[thin space (1/6-em)]](https://www.rsc.org/images/entities/char_2009.gif) 000, Aldrich) were used in an as-received condition without further purification.
000, Aldrich) were used in an as-received condition without further purification.
Preparation of quantum dot–polymer (QDP) powders
QDs (0.02 g, preparation details provided in the supplement to this article), PMMA-co-MA (0.98 g), and toluene (10 mL) were mixed in a 20 mL flask by a magnetic stirrer for 3 days at room temperature. The resulting product was diluted with hexane (100 mL) and then centrifuged at a speed of 5000 rpm. Finally, the precipitate was dried in an oven at 60 °C for 1 h to remove any free hexane and toluene.Fabrication of QDPLC films
QDPLC films were prepared by dropping 1 mL QD–polymer solution (polymer to toluene ratio of 1![[thin space (1/6-em)]](https://www.rsc.org/images/entities/char_2009.gif) :
:![[thin space (1/6-em)]](https://www.rsc.org/images/entities/char_2009.gif) 10) onto a 3 × 3 cm glass slide to obtain a uniform wet film. The slide was then heated to 60 °C under a hotplate for 1 h to remove any residual solvent. The thickness of the QDPLC film was characterized by an Alpha Step IQ surface profiler, and was found to be around 80 μm. TEM samples were prepared by dropping 0.05 mL QD–polymer solution onto a copper grid (200 mesh), and then spinning the mesh on a spin coater at a speed of 3000 rpm for 5 min. Finally, the TEM film was dried in an oven at 60 °C for 24 h in order to remove any excess solvent.
10) onto a 3 × 3 cm glass slide to obtain a uniform wet film. The slide was then heated to 60 °C under a hotplate for 1 h to remove any residual solvent. The thickness of the QDPLC film was characterized by an Alpha Step IQ surface profiler, and was found to be around 80 μm. TEM samples were prepared by dropping 0.05 mL QD–polymer solution onto a copper grid (200 mesh), and then spinning the mesh on a spin coater at a speed of 3000 rpm for 5 min. Finally, the TEM film was dried in an oven at 60 °C for 24 h in order to remove any excess solvent.
Fabrication of QD-based white-light LED
Green-emission QDP powder (0.8 g, containing 2 wt% green-emission QDs in PMMA-co-MA), red-emission QDP powder (0.2 g, containing 2 wt% red-emission QDs in PMMA-co-MA), and ZnO powder (0.01 g) were mixed in toluene (10 mL) and then stirred magnetically at room temperature until a clear solution was obtained. A QDPLC film with a thickness of approximately 80 μm was prepared by dropping 0.11 mL QD–polymer solution (polymer to toluene ratio of 1![[thin space (1/6-em)]](https://www.rsc.org/images/entities/char_2009.gif) :
:![[thin space (1/6-em)]](https://www.rsc.org/images/entities/char_2009.gif) 10) onto a PET-based release film with dimensions of 1 × 1 cm. The film was dried at 60 °C for 2 h under ambient conditions and was then placed on a GaN-based blue LED with an emission wavelength of 460 nm.
10) onto a PET-based release film with dimensions of 1 × 1 cm. The film was dried at 60 °C for 2 h under ambient conditions and was then placed on a GaN-based blue LED with an emission wavelength of 460 nm.
Characterization
The phases of the synthesized products were characterized using an X-ray diffractometer (Shimadzu XRD-6000) using Cu Kα radiation. Moreover, a transmission electron microscope (JEOL JEM 1200EX) with an accelerating voltage of 80 kV and a high-resolution transmission electron microscope (JEOL JEM 2100) with an accelerating voltage of 200 kV were used to observe the nanoparticle aggregation. The content of inorganic nanoparticles in the dried precipitate was determined using a thermogravimetric analyzer (TGA) under a constant flow of N2 gas with a heating rate of 20 °C min−1. The UV-vis absorption and PL spectra of the QDPLC films were measured using a UV-vis spectrophotometer (MPC-2200, SHIMADZU) and a fluorescence spectrophotometer (FluoroMax-3, HORIBA Jobin Yvon), respectively. The photoluminescence quantum yields (QYs) of the diluted QD solutions were determined via a comparison with known QY standards (coumarin 540, QY = 78% in ethanol, Aldrich 99%; rhodamine 6G, QY = 95% in ethanol, Aldrich 99%) with an identical optical density (OD). The OD values of the samples were all set in the range 0.04–0.06. The QY data of the QDs and the standard dyes were measured by a fluorescence spectrophotometer fitted with a 4′′ integrating sphere (IS) module (HORIBA Jobin Yvon). Finally, the electroluminescent (EL) spectrum of the WLED was obtained using a USB2000 spectrometer (Ocean Optics) fitted with a FOIS-1 integrating sphere (Ocean Optics) and a Keithley 2220-30-1 power source. Fig. S1† illustrates the experimental setup used to measure the PL spectra of the QDPLC films. As shown, the films were coated on a glass plate and then transferred to a black holder with a window size of 1 × 1 cm in order to extract light.14Results and discussion
Preparation and characterization of green- and red-emission QDs
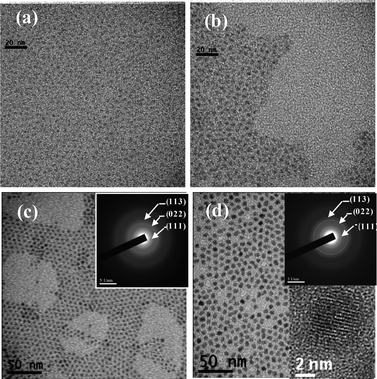
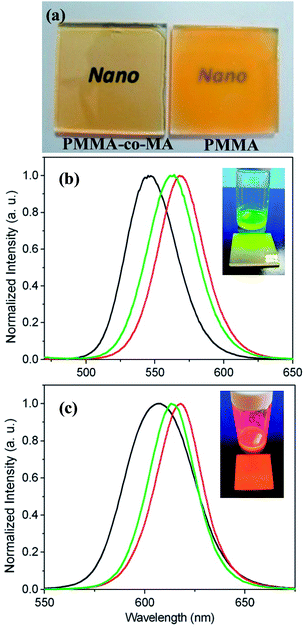
The QDs used in the present study comprised CdSe cores passivated with either CdS or ZnS overcoats in order to improve the quantum yield. The preparation details are described in the supplement to this article. For both QDs, high-quality zinc blende (ZB) CdSe cores were synthesized by a hot-injection route using a modified literature method.15Fig. 1(a) and (b) present TEM images of CdSe cores with sizes of 2.5 ± 0.2 nm and 4.3 ± 0.3 nm obtained after reaction times of 0.5 min and 20 min, respectively. As shown in Fig. S2,† the emission wavelengths of the two CdSe cores are 506 nm (FWHM 27 nm) and 564 nm (FWHM 29 nm), respectively. Prior to overcoating, both CdSe cores have a very low PL quantum yield (i.e., <10%) due to high surface defects. The overcoating process performed in the present study used a thermal-cycling coupled single precursor (TC-SP) approach, comprising the addition/adsorption of single precursors (ZDC or CDC) at a low temperature followed by epitaxial growth at a high temperature.16Fig. 1(c) and (d) present TEM micrographs of green-emission QDs (4.2 ± 0.3 nm) and red-emission QDs (size 6.2 ± 0.4 nm). Note that the overcoats of the QDs comprise a three-monolayer structure of either ZnS (green-emission QDs) or CdS (red-emission QDs). It is seen that the QDs form a close packing arrangement, indicating that they have a uniform size and their surfaces are well ligand-protected. Moreover, the SAED patterns shown in the insets reveal that both core/shell QDs have a single-crystalline zinc blende structure. Fig. 2 shows the PL spectra of the two QDs. As shown in Fig. 2(b), the green-emission QDs (548 nm) have a FWHM of 35 nm and a quantum yield of ∼70% (see Fig. 2(c)). By contrast, the red-emission QDs (608 nm) have a FWHM of 31 nm and a quantum yield of ∼68%.Preparation and characterization of QDPLC films
In QDPLC films comprising QDs of two or more emission colors mixed in a polymer matrix, it is essential that the QDs are homogeneously dispersed in order to minimize inter-dot interactions. Furthermore, large QD aggregates and phase separation should be avoided in order to enhance the optical performance. Previous research has shown that ligands bound to nanocrystal surfaces can be effectively replaced with molecules able to bind more strongly to the nanocrystals.17 Tamborra et al.18 recently demonstrated the homogeneous dispersion of phosphine-capped CdSe/ZnS core/shell QDs in two optically transparent random copolymers, namely, poly(methyl methacrylate-co-acrylic acid) (PMMA-co-MA) and poly(methyl methacrylate-co-dimethylaminoethyl methacrylate) (PMMA-co-DMAEMA). It was shown that the pendant functional groups on the two polymer chains (i.e., carboxylic acid and amine) coordinated to the respective QD surfaces, thereby keeping them dispersed in both matrices. In this study, a similar strategy is adopted to fabricate QDPLC films containing both green- and red-emission QDs. However, in the present case, oleylamine is used as surface ligand on the QDs rather than TOPO or TOP, as in the study conducted by Tamborra et al.18In preparing QDPLC films, the QD concentration must be carefully considered. Specifically, the number of QDs should be sufficiently large to ensure the conversion of the exciting blue light, but not so concentrated as to induce excessive inter-dot interactions. In theory, both requirements can be satisfied by choosing a high QD content and a large film thickness. However, in practical applications (e.g., LCD backlights), large film thicknesses cannot be tolerated due to space constraints and the need for device miniaturization.19 Accordingly, following several trial tests, the QD concentration for the present QDPLC films was set as 2% of the copolymer weight in order to minimize the film thickness and inter-dot interactions while simultaneously obtaining an efficient light conversion performance. The number of carboxylic functional groups on each copolymer chain is also an important consideration when preparing QDPLC films. Theoretically, a polymer chain with a high ratio of carboxylic groups has a better ability to capture QDs. However, given a high QD concentration, a high carboxylic acid ratio tends to result in the formation of large QD aggregates. Thus, a PMMA-co-MA copolymer with a number average molecular weight Mn ∼ 15![[thin space (1/6-em)]](https://www.rsc.org/images/entities/char_2009.gif) 000 and a low MMA-to-MA ratio of 1
000 and a low MMA-to-MA ratio of 1![[thin space (1/6-em)]](https://www.rsc.org/images/entities/char_2009.gif) :
:![[thin space (1/6-em)]](https://www.rsc.org/images/entities/char_2009.gif) 0.016 was selected as the matrix for the present QD–polymer films. The chain length and number of MA in each polymer chain were calculated to be 37.7 nm and 2.4, respectively (see ESI†). To test the dispersibility of the oleylamine-capped QDs in the selected copolymer matrix, the as-prepared QDs were dispersed in PMMA-co-MA0.016 in toluene and the resulting QD–polymer suspension was then cast on a glass substrate. For comparison purposes, a QD–PMMA film with the same QD concentration and a similar molecular weight of polymer was also prepared. (Note that PMMA homopolymer has no pendant carboxylic functional groups on the polymer chain, and therefore provides a useful material for control purposes.) As shown in Fig. 2(a), the QDPLC film based on the PMMA-co-MA0.016 matrix has a transparent characteristic, indicating that the carboxylic groups on the polymer chain readily replace the oleylamine ligands of the QDs and therefore ensure their fine dispersion. By contrast, the QD–polymer film with a PMMA matrix is opaque, which suggests a strong light-scattering effect due to the presence of large QD aggregates. Furthermore, from Fig. 2(b) and (c), it is observed that the PL spectra of the green- or red-emission QD-PMMA-co-MA0.016 films both have a redshift of approximately 40 nm relative to the spectra obtained for the same QDs in a dilute solution in which no inter-dot interactions occur. As described in the introduction part, this redshift phenomenon is an inevitable result of reabsorption and FRET effects. It is noted that the redshift in the PL spectra of the two QD–PMMA films is greater than that of the films with a PMMA-co-MA0.016 matrix. This finding is reasonable since, as discussed above, the former films have a relatively poorer QD dispersibility, and hence the inter-dot interaction effect is increased.
0.016 was selected as the matrix for the present QD–polymer films. The chain length and number of MA in each polymer chain were calculated to be 37.7 nm and 2.4, respectively (see ESI†). To test the dispersibility of the oleylamine-capped QDs in the selected copolymer matrix, the as-prepared QDs were dispersed in PMMA-co-MA0.016 in toluene and the resulting QD–polymer suspension was then cast on a glass substrate. For comparison purposes, a QD–PMMA film with the same QD concentration and a similar molecular weight of polymer was also prepared. (Note that PMMA homopolymer has no pendant carboxylic functional groups on the polymer chain, and therefore provides a useful material for control purposes.) As shown in Fig. 2(a), the QDPLC film based on the PMMA-co-MA0.016 matrix has a transparent characteristic, indicating that the carboxylic groups on the polymer chain readily replace the oleylamine ligands of the QDs and therefore ensure their fine dispersion. By contrast, the QD–polymer film with a PMMA matrix is opaque, which suggests a strong light-scattering effect due to the presence of large QD aggregates. Furthermore, from Fig. 2(b) and (c), it is observed that the PL spectra of the green- or red-emission QD-PMMA-co-MA0.016 films both have a redshift of approximately 40 nm relative to the spectra obtained for the same QDs in a dilute solution in which no inter-dot interactions occur. As described in the introduction part, this redshift phenomenon is an inevitable result of reabsorption and FRET effects. It is noted that the redshift in the PL spectra of the two QD–PMMA films is greater than that of the films with a PMMA-co-MA0.016 matrix. This finding is reasonable since, as discussed above, the former films have a relatively poorer QD dispersibility, and hence the inter-dot interaction effect is increased.
Fig. 3(a) and (b) present TEM images of the green- and red-emission QDPLC films with a PMMA-co-MA copolymer matrix. For comparison purposes, Fig. 3(c) presents a TEM image of the QDPLC film consisting of red-emission QDs immobilized in a PMMA matrix. It is seen that the PMMA-co-MA copolymer-based films contain isolated QD nanoclusters, with each cluster containing between 1 and 10 QDs. More specifically, approximately 40% of the clusters contain a single QD, ∼50% contain 2–3 QDs, and ∼10% contain 5 or more QDs. The TEM image presented in Fig. 3(c) shows that the QD film with a PMMA matrix contains large QD aggregates. It is noted that this observation is consistent with that reported in previous studies for PMMA films.20 As described earlier, FRET occurs only for inter-dot distances in the range of several nanometers. The TEM results presented in Fig. 3(a) and (b) indicate that the inter-cluster distance is generally greater than 10 nm, which suggests that the FRET phenomenon is unlikely to occur.
 | ||
| Fig. 3 TEM images of (a) green-emission QD/PMMA-co-MA nanoclusters (b) red-emission QD/PMMA-co-MA nanoclusters, and (c) red-emission QD/PMMA aggregates. | ||
Fig. S3† presents photographs of the original QD/PMMA-co-MA/toluene solution (left) and the QD nanocomposite precipitates obtained four hours after the addition of hexane (right). The precipitates were dried in an oven at 60 °C for 8 h in order to remove any free solvent, and were then ground into a powdered form, as shown in Fig. S4.† The remaining solution was inspected under a UV lamp, and was found to display no obvious emissions. Thus, it was inferred that all of the QDs in the original dispersion were captured by the PMMA-co-MA copolymer chains. The QDPC powder samples have several benefits, such as light weight (being thus convenient for storage and delivery). Furthermore, the powder can be dissolved once again in toluene to form a clear dispersed solution for further fabrication processes.
Color mixing in QDPLC films
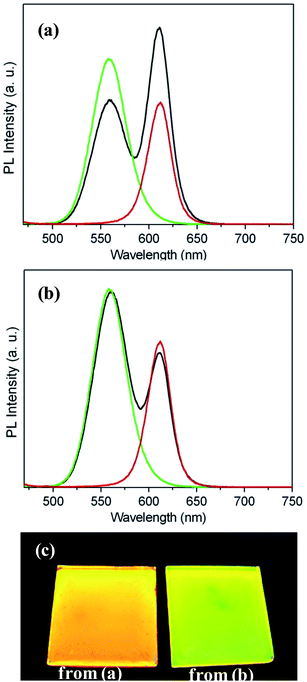
In principle, white light can be generated by using a blue LED to excite a polymer film containing both green- and red-emission QDs. However, as discussed above, the light quality of QDPLC films is strongly affected by inter-dot interaction effects such as FRET.11 For this reason, the desired color cannot be ensured based on a purely theoretical consideration of the concentration required for each constituent QD. That is, the degree of QD aggregation in the polymer matrix must also be taken into account. In the present study, two experiments were performed to evaluate the effects of QD aggregation on the optical performance of QDPLC films. In the first experiment, a QDPLC film was prepared by mixing green- and red-emission QDs directly in a ratio of 4![[thin space (1/6-em)]](https://www.rsc.org/images/entities/char_2009.gif) :
:![[thin space (1/6-em)]](https://www.rsc.org/images/entities/char_2009.gif) 1 in PMMA-co-MA and toluene. Green-emission QDPLC films and red-emission QDPLC films with the same thickness and concentration as the composite film were also prepared for comparison purposes. The PL spectra of the three films are shown in Fig. 4(a). The results clearly show that the spectrum of the composite film is strongly weighed toward the red-emission band. As shown in Fig. 5(a), dispersing the green- and red-emission QDs directly in the polymer/solvent solution results in the formation of nanoclusters containing both types of QD. As a result, the distance between the green- and red-emission QDs is very small, and hence G/R FRET occurs. In the second experiment, a QDPLC film was prepared by mixing green-emission QDP powder and red-emission QDP powder in the polymer/solvent suspension (see Fig. 5(b)). Note that the powders contained QDs with the same concentration as that used in the first experiment. As shown in Fig. 4(b), the PL spectrum of the composite film was found to exhibit no redshift and to closely approximate the spectra of the two constituent QDs. The films fabricated using the two different routes were irradiated with a UV lamp. The images presented in Fig. 4(c) show that the film prepared by mixing the pre-made QDP powders is much greener than that prepared by the direct mixing of green- and red-emission QDs. In other words, the former film has a lower G/R FRET. Theoretically, a dynamic interaction may occur between the MA groups on the copolymer chains and the QDs when suspended in toluene solution. That is, the QDs may leave one polymer chain and become trapped in another chain as a result of thermal motion during the dissolution process. As a result, G/R FRET may still occur in the film fabricated using the QDP powders. However, in the present study, this effect was not observed due to the low temperature used in the synthesis process. Fig. 6 presents TEM images of the QDPLC film prepared using the pre-made QDPC powders. It is observed that the average distance between the clusters is greater than 10 nm, and thus G/R FRET does not occur.
1 in PMMA-co-MA and toluene. Green-emission QDPLC films and red-emission QDPLC films with the same thickness and concentration as the composite film were also prepared for comparison purposes. The PL spectra of the three films are shown in Fig. 4(a). The results clearly show that the spectrum of the composite film is strongly weighed toward the red-emission band. As shown in Fig. 5(a), dispersing the green- and red-emission QDs directly in the polymer/solvent solution results in the formation of nanoclusters containing both types of QD. As a result, the distance between the green- and red-emission QDs is very small, and hence G/R FRET occurs. In the second experiment, a QDPLC film was prepared by mixing green-emission QDP powder and red-emission QDP powder in the polymer/solvent suspension (see Fig. 5(b)). Note that the powders contained QDs with the same concentration as that used in the first experiment. As shown in Fig. 4(b), the PL spectrum of the composite film was found to exhibit no redshift and to closely approximate the spectra of the two constituent QDs. The films fabricated using the two different routes were irradiated with a UV lamp. The images presented in Fig. 4(c) show that the film prepared by mixing the pre-made QDP powders is much greener than that prepared by the direct mixing of green- and red-emission QDs. In other words, the former film has a lower G/R FRET. Theoretically, a dynamic interaction may occur between the MA groups on the copolymer chains and the QDs when suspended in toluene solution. That is, the QDs may leave one polymer chain and become trapped in another chain as a result of thermal motion during the dissolution process. As a result, G/R FRET may still occur in the film fabricated using the QDP powders. However, in the present study, this effect was not observed due to the low temperature used in the synthesis process. Fig. 6 presents TEM images of the QDPLC film prepared using the pre-made QDPC powders. It is observed that the average distance between the clusters is greater than 10 nm, and thus G/R FRET does not occur.
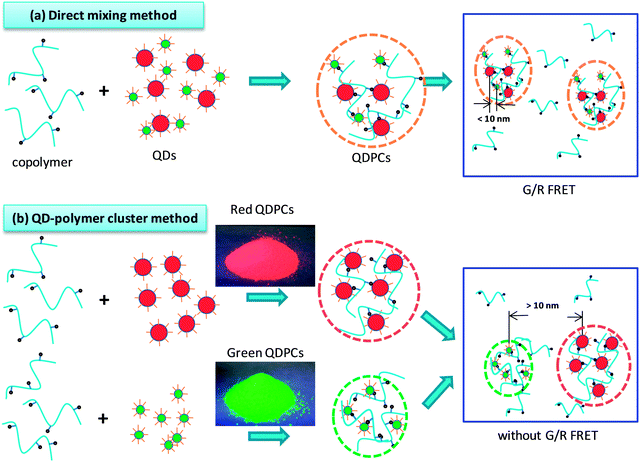 | ||
| Fig. 5 Schematic illustrations showing preparation of QDPLC films by: (a) direct mixing of as-prepared QDs and (b) mixing of pre-made QDP powders. | ||
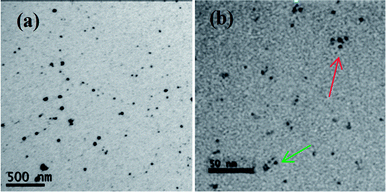 | ||
| Fig. 6 TEM images of green-emission QDs and red-emission QDs dispersed in PMMA-co-MA: (a) 50 K magnification and (b) 500 K magnification. | ||
Electroluminescent properties of QD-based WLEDs
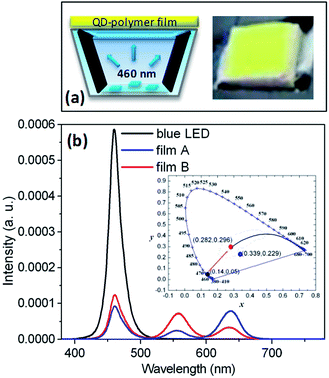
Two QDPLC films were prepared by mixing the QDs directly (Film A) or mixing the pre-made QDP powders (Film B). Both films were excited with a blue LED (460 nm, 15.9 lm W−1 at 20 mA) and their respective electroluminescent (EL) properties investigated, as shown in Fig. 7. Note that both films had the same composition, namely 1.6 wt% green-emission QDs, 0.4 wt% red-emission QDs, and 1 wt% ZnO particles. (Note that ZnO addition was performed to increase the extraction of light from the luminescent film by increasing the absorption ratio of the blue light via light-scattering effects.8) Fig. 7(b) shows the EL spectra of the two QD-based WLEDs and the original blue LED under a forward current of 20 mA. Film A (synthesized by mixing the green- and red-emission QDs directly) has CIE color coordinates of (0.339 and 0.229), a correlated color temperature (CCT) of 4230 K, a color-rendering index (CRI) of 21, and a luminance efficiency (LE) of 22.8 lm W−1. By contrast, Film B (synthesized by mixing pre-prepared green and red QDP powders) has CIE color coordinates of (0.282 and 0.296), a CCT of 9492 K, a CRI of 69 and a LE of 40.4 lm W−1. It is seen that the relative intensities of the green- and red-emission bands in the spectra of the two films are very different due to the difference in the G/R FRET effect in the two cases. In addition, Film B has a much higher LE than Film A since it has a stronger green-emission band and the human eye has a greater photonic sensitivity toward green light than red or blue light.21 In general, the quality of light conversion materials can be evaluated by means of the light conversion efficiency (LCE), defined as the ratio of the converted QD emission to that of the original LED light source.22 In the present case, Film A has a LCE of 41%, while Film B has a slightly higher LCE of 44%. It is noted that the LCE values of both films are lower than the average QY of the as-prepared QDs (i.e., ∼70%). It is presumed that this is due to such effects as reabsorption, a low light extraction ratio, FRET, and/or QD–polymer interaction. Fig. 8 shows the variation of the LE, CCT and CRI properties of the WLED device incorporating Film B as a function of the forward current. For comparison purposes, the LE property of the original blue LED is also shown. It is seen that as the forward bias increases, the LE of both the blue LED and the WLED monotonically decrease. As observed, the LE of the blue LED decreases by 38% as the forward current increases from 20 mA to 100 mA, while that of the WLED decreases by 30%. Thus, it is inferred that the reduction in the LE of the WLED at high forward currents is the result principally of the decline of the blue LED chip.23Fig. 8(b) shows that the CCT and CRI values of the WLED lie in the ranges 9270–9670 K and 66–69, respectively. In addition, it is seen that the CCT increases with an increase in forward current, whereas the CRI decreases. This finding suggests that the light conversion efficiency of the QDs is degraded at higher forward currents. The variation in the CCT and CRI properties of the WLED with an increase in forward current is most likely the result of thermal quenching, multi-exciton effects, saturation of the QD emissions, and so forth. However, it is noted that both variations are relatively small, and thus they are of little practical concern.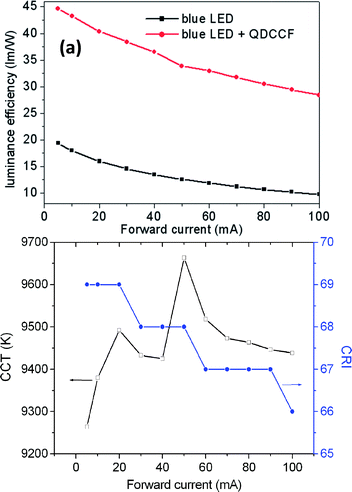 | ||
| Fig. 8 Variation of (a) luminance efficiency of blue LED and WLED and (b) CRI/CCT values of WLED as a function of forward current. | ||
Conclusions
This study has presented a straightforward method for preparing QD–polymer light conversion (QDPLC) films via the mixing of green-emission and red-emission QD/polymer powders in a PMMA-co-MA matrix. Notably, the proposed method increases the separation distance between the green- and red-emission QDs in the polymer matrix, and therefore eliminates the G/R FRET effect. Moreover, the potential exists to adjust the PL color of the synthesized film by controlling the relative amounts of the constituent QD powders. The practical feasibility of the proposed approach has been demonstrated by fabricating a WLED device incorporating a blue LED pump. It has been shown that the WLED has a high correlated color temperature (CCT) of 9492 K and a luminance efficiency (LE) of 40.4 lm W−1. Overall, the results suggest that the color-tunable, flexible and free-standing QDPLC film synthesized in this study has significant potential for such applications as LCD backlight units and solid-state lighting systems.Acknowledgements
The authors would like to thank the National Science Council of the Republic of China, Taiwan, for financially supporting this research under Contract no. NSC 102-2113-M-269-001.References
- O. Chen, H. Wei, A. Maurice, M. Bawendi and P. Reiss, MRS Bull., 2013, 38, 696 CrossRef CAS.
- (a) E. Jang, S. Jun, H. Jang, J. Lim, B. Kim and Y. Kim, Adv. Mater., 2010, 22, 3076 CrossRef CAS PubMed; (b) Y. Shiraski, G. J. Spuran, M. G. Bawendi and V. Bulovic, Nat. Photonics, 2013, 7, 13 CrossRef; (c) T. H. Kim, S. Jun, K. S. Cho, B. L. Choi and E. Jang, MRS Bull., 2013, 38, 712 CrossRef CAS.
- (a) V. Wood and V. Bulović, Nano Rev., 2010, 1, 5202 Search PubMed; (b) M. J. Anc, N. L. Pickett, N. C. Gresty, J. A. Harris and K. C. Mishra, ECS J. Solid State Sci. Technol., 2013, 2, R3071 CrossRef CAS PubMed.
- (a) E. H. Sargent, Nat. Photonics, 2012, 6, 133 CrossRef CAS; (b) F. Purcell-Milton and Y. K. Gun'ko, J. Mater. Chem., 2012, 22, 16687 RSC.
- (a) T. Jamieson, R. Bakhshi, D. Petrova, R. Pocock, M. Imani and A. M. Seifalian, Biomaterials, 2007, 28, 4717 CrossRef CAS PubMed; (b) W. R. Algar, A. J. Tavares and U. J. Krull, Anal. Chim. Acta, 2010, 673, 1 CrossRef CAS PubMed; (c) U. Resch-Genger, M. Grabolle, S. Cavalieve-Jaricot, R. Nitschke and T. Nann, Nat. Methods, 2008, 5, 763 CrossRef CAS PubMed.
- Z. Luo, Y. Chen and S. T. Wu, Opt. Express, 2013, 21, 26269 CrossRef PubMed.
- (a) H. V. Demir, S. Nizamoglu, T. Erdem, E. Mutlugun, N. Gaponik and A. Eychmüller, Nano Today, 2011, 6, 632 CrossRef CAS PubMed; (b) K. J. Chen, H. C. Chen, K. A. Tsai, C. C. Lin, H. H. Tsai, S. H. Chien, B. S. Cheng, Y. J. Hsu, M. H. Shih, C. H. Tsai, H. H. Shih and H. C. Kuo, Adv. Funct. Mater., 2012, 22, 5143 Search PubMed; (c) Q. Ma and X. Su, Analyst, 2010, 135, 1867 RSC; (d) A. Sukhanova and I. Nabiev, Crit. Rev. Oncol. Hematol., 2008, 68, 39 CrossRef PubMed; (e) M. X. Dung, P. Mohapatra, J. K. Choi, J. H. Kim, S. Jeong and H. D. Jeong, Bull. Korean Chem. Soc., 2012, 33, 1491 CrossRef CAS.
- (a) X. Yang, K. Dev, J. Wang, E. Mutlugun, C. Dang, Y. Zhao, S. Liu, Y. Tang, S. T. Tan, X. W. Sun and H. V. Demir, Adv. Funct. Mater., 2014, 24, 5977 CrossRef CAS; (b) Y. Liu, Z. Lin, X. Zhao, S. Yoo, K. S. Moon and C. P. Wong, Electronic Components and Technology Conference (ECTC), 2012 IEEE 62nd, pp. 2140–2144 Search PubMed.
- (a) L. Shi, N. Rosenzweig and Z. Rosenweig, Anal. Chem., 2007, 79, 208 CrossRef CAS PubMed; (b) A. R. Clapp, I. L. Medintz, J. M. Mauro, B. R. Fisher, M. G. Bawendi and H. Mattoussi, J. Am. Chem. Soc., 2004, 126, 301 CrossRef CAS PubMed.
- S. A. Crooker, J. A. Hollingsworth, S. Tretiak and V. I. Klimov, Phys. Rev. Lett., 2002, 89, 186802 CrossRef CAS.
- E. Mutlugun, P. L. Hernandez-Martinez, C. Eroglu, Y. Coskun, T. Erdem, V. K. Sharma, E. Unal, S. K. Panada, S. G. Hickey, N. Gaponik, A. Eychmüller and H. V. Demir, Nano Lett., 2012, 12, 3986 CrossRef CAS PubMed.
- (a) S. Nizamoglu, T. Ozel, E. Sari and H. V. Demir, Nanotechnology, 2007, 18, 065709 CrossRef; (b) S. H. Lee, K. H. Lee, J. H. Jo, B. Park, Y. Kwon, H. S. Jang and H. Yang, Opt. Mater. Express, 2014, 4, 1297 CrossRef.
- T. Erdem, S. Nizamoglu and H. V. Demir, Opt. Express, 2012, 20, 3275 CrossRef CAS PubMed.
- S. W. Jeon, J. H. Noh, K. H. Kim, W. H. Kim, C. Yun, S. B. Song and J. P. Kim, Opt. Express, 2014, 22, A1237 CrossRef PubMed.
- M. Sun and X. Yang, J. Phys. Chem. C, 2009, 113, 8701 CAS.
- (a) D. Chen, F. Zhao, H. Qi, M. Rutherford and X. Peng, Chem. Mater., 2010, 22, 1437 CrossRef CAS; (b) J. R. Dethlefsen and A. Døssing, Nano Lett., 2011, 11, 1964 CrossRef CAS PubMed; (c) G. Chen, W. Zhang and X. Zhong, Front. Chem. China, 2010, 5, 214 CrossRef PubMed.
- M. Green, J. Mater. Chem., 2010, 20, 5797 RSC.
- M. Tamborra, M. Striccoli, M. L. Curri, J. A. Alducin, D. Mecerreyes, J. A. Pomposo, N. Kehagias, V. Reboud, C. M. S. Torres and A. Agostiano, Small, 2007, 3, 822 CrossRef CAS PubMed.
- Z. Luo, D. Xu and S. T. Wu, J. Disp. Technol., 2014, 10, 526 CrossRef.
- (a) Y. Yuan and M. Krüger, Polymer, 2012, 4, 1 CrossRef CAS PubMed; (b) L. Pang, Y. Shen, K. Tetz and Y. Fainman, Opt. Express, 2005, 13, 44 CrossRef CAS; (c) H. Song and S. Lee, Nanotechnology, 2007, 18, 055402 CrossRef; (d) J. Lee, V. C. Sundar, J. R. Heine, M. G. Bawendi and K. F. Jensen, Adv. Mater., 2000, 12, 1102 CrossRef CAS; (e) E. P. Jang, W. S. Song, K. H. Lee and H. Yang, Nanotechnology, 2013, 24, 045607 CrossRef PubMed; (f) N. Reitinger, A. Hohenau, S. Köstler, J. R. Krenn and A. leitner, Phys. Status Solidi A, 2011, 208, 710 CrossRef CAS.
- T. Erdem and H. V. Demir, Nnaophotonics, 2013, 2, 57 CAS.
- W. S. Song and H. Yang, Chem. Mater., 2012, 24, 1961 CrossRef CAS.
- J. I. Shim, D. P. Han, H. Kim, D. S. Shin, G. B. Lin, D. S. Meyaard, Q. Shan, J. Cho, E. F. Schubert, H. Shim and C. Sone, Appl. Phys. Lett., 2012, 100, 111106 CrossRef PubMed.
Footnote |
| † Electronic supplementary information (ESI) available. See DOI: 10.1039/c4tc02201g |
| This journal is © The Royal Society of Chemistry 2015 |

