Preparation of porous aromatic framework/ionic liquid hybrid composite coated solid-phase microextraction fibers and their application in the determination of organochlorine pesticides combined with GC-ECD detection†
Mingxue
Wu
a,
Gang
Chen
a,
Ping
Liu
b,
Weihong
Zhou
*a and
Qiong
Jia
*a
aCollege of Chemistry, Jilin University, Qianjin Street 2699#, Changchun, 130012, P. R. China. E-mail: zhouwh@jlu.edu.cn; jiaqiong@jlu.edu.cn
bChangchun GeneScience Pharmaceuticals Co., Ltd., Changchun 130012, China
First published on 6th November 2015
Abstract
A novel hybrid material incorporating porous aromatic frameworks and an ionic liquid, 1-(triethoxy silyl)propyl-3-aminopropyl imidazole hexafluorophosphate, was prepared as solid-phase microextraction coating and employed for the extraction of organochlorine pesticides. Combining the advantages of porous aromatic frameworks and an ionic liquid, the fiber exhibited a high adsorption capacity for organochlorine pesticides. Under optimized experimental conditions, enhancement factors of 247–1696 were obtained with good linearity in the range of 1–500 μg L−1. The detection limits and quantification limits were determined to be in the range of 0.11–0.29 μg L−1 and 0.35–0.93 μg L−1. The relative standard deviations for six replicates of organochlorine pesticides were in the range of 4.4%–7.2% and 5.7%–10.1% for one fiber and fiber-to-fiber, respectively. By coupling with a gas chromatography–electron capture detector, the novel fiber was successfully used for the determination of organochlorine pesticides in juice and milk samples with recoveries of 76.1%–121.3%.
Introduction
Persistent organic pollutants, including organochlorine pesticides (OCPs), polycyclic aromatic hydrocarbons (PAHs), and polychlorinated biphenyls (PCBs), can cause various health problems including cancer, genetic variation, and diseases of the immune system. OCPs, which are known to instigate disruptions in the endocrine system, are widely used to kill insects in the planting of farm crops. It is of great importance to monitor the level of OCPs in the food and environment by using appropriate analytical tools.In general, a sample preparation step is necessary for the determination of OCPs prior to analysis. This is the most time consuming step in the analytical procedure and is an important factor for the success of the chemical analysis. In the past few decades, various sample pretreatment methods have been developed for OCPs, including liquid–liquid microextraction,1 Soxhlet extraction,2 solid–liquid extraction (SLE),3 solid-phase extraction (SPE), micro-solid-phase extraction (μ-SPE),4 magnetic solid-phase extraction (MSPE),5 matrix solid-phase dispersion (MSPD),6 and solid-phase microextraction (SPME).7 SPME is in line with the conception of green chemistry because it is simple, sensitive, time-efficient, solvent-free, and compatible with analytical separation systems such as gas chromatography and liquid chromatography.
The fiber coating is critical in improving the sensitivity and selectivity of SPME because it is based on the distribution of target analytes between the sample matrix and the stationary phase. In recent years, a variety of SPME fiber coatings have been developed, among which commercial fibers in a range of polarity have been applied in a vast number of analyses although they suffer from short lifetime and high cost. To fabricate low cost, simple, robust, and long-life fibers with enhanced selectivity by introducing novel materials as functional coatings is of continuous interest. Various new types of fibers have been reported, including nanostructured titania-coated fibers,8 C18 composites,9 carbonized polydopamine,10 green coating (cork),11 and graphene-coated fibers.12,13
Metal–organic frameworks (MOFs), an important class of hybrid porous materials, show promising applications in molecular adsorption and separation.14 Some kinds of MOFs have been selected as candidates for preparing SPME fibers.14–19 For instance, Zhang et al.19 employed a copper-based MOF (MOF-199) and graphite oxide (GO) to prepare SPME coatings. The fiber was developed for SPME of eight OCPs from various matrices with satisfactory recoveries, indicating that the composite provided a promising alternative in sample pretreatment. Compared with MOFs, porous organic polymers (POPs) feature robust covalent framework structures showing high water, moisture, and chemical stability.20 Among the several POPs, i.e., porous aromatic frameworks (PAFs), conjugated microporous polymers (CMPs), and porous polymer networks (PPNs), PAFs have attracted much attention in the field of adsorption and separation, especially gas separation.21 However, to the best of our knowledge, PAFs are seldom used for the adsorption of other compounds except gas.22
Ionic liquids (ILs), composed entirely of ions, exist in a liquid state at ambient temperature and exhibit good extractability for various organic compounds and metal ions.23 ILs are also used as the extracting phase in SPME as their high viscosity improves the quality of fiber coating as well as the selectivity maintained by the ionic groups.23,24 A specific concern regarding IL coatings is that they display poor efficiency and low durability. These drawbacks can be overcome by several strategies, e.g., treatment of the fibers with a polymeric membrane to support the IL layer to enhance the performance,25 polymerization of IL on the fiber surface via cross-linking with silica particles or stainless steel fibers,26,27 and intercalation of IL into the galleries of clay material to improve the analysis by the dual function of having an organic group for nonpolar compounds and clay material for polar molecules.28 For instance, modified montmorillonite clay intercalated with IL was co-deposited with polythiophene polymers and coated on an SPME fiber electrochemically. The novel fiber was applied to the selective and sensitive headspace analysis of volatile endocrine-disruptor pesticides, chlorpyrifos, penconazole, procymidone, bromopropylate, and Lambda-cyhalothrin.28
In this work, a novel SPME fiber was prepared that combines the advantages of PAF and IL by using poly(ethylene glycol)diglycidyl ether as a crosslinking agent. The fiber was employed for the preconcentration of OCPs coupled with GC-ECD. The goal of the present study is to explore the application of PAF in the field of separation science. To the best of our knowledge, this is the first time PAF/IL is utilized as the SPME fiber coating for the adsorption of OCPs from complicated samples.
Experimental section
Reagents and materials
Standards of the OCPs, α-hexachlorocyclohexane (α-HCH), β-HCH, δ-HCH, Heptachlor, Aldrin, Dieldrin, 1,1-dichloro-2,2-bis(4-chlorophenyl)ethylene (p,p′-DDE), and 1,1,1-trichloro-2-(2-chlorophenyl)-2-(4-chlorophenyl)ethane (o,p′-DDT), were purchased from Aladdin (Shanghai, China). The concentrations of standard OCP solutions were 100 μg mL−1 except for α-HCH (50 μg mL−1). Working solutions were prepared by diluting the standard solution with ultrapure water.Tetra(4-bromophenyl)methane was obtained from Nanjing Chemical Technology Company (Nanjing, China). 2,2′-Bipyridyl, bis(1,5-cyclooctadiene)nickel(0) ([Ni(cod)2]), 1,5-cyclooctadiene (cod), tin chloride, 3-chloropropyltriethoxysilane, 3-bromopropylamine hydrobromide, potassium hexafluorophosphate, N,N-dimethylformamide (DMF), acetonitrile (ACN), tetrahydrofuran (THF), formic acid, and triethylamine (TEA) were purchased from Aladdin (Shanghai, China). Poly(ethylene glycol)diglycidyl ether (PEGDE) was obtained from Sigma-Aldrich (St. Louis, MO, USA). All reagents used were of analytical grade unless otherwise stated.
Juice and milk samples were purchased from the local market. A quartz fiber (120 μm, o.d.) with protective polyimide coating was obtained from the Academy of Post and Telecommunication (Wuhan, China).
Apparatus and experimental conditions
An Agilent 6890 gas chromatography (Agilent, Palo Alto, USA) equipped with an electron capture detector (ECD) was used for chromatographic analysis. An HP-5 (J&W Scientific, USA) capillary column (50 m × 0.32 mm i.d. × 0.52 μm film thickness) was used for the chromatographic separation. High-purity nitrogen (99.999%) was used as the carrier gas at the flow rate of 2.5 mL min−1 in the splitless mode. The injector and detector temperatures were set at 250 °C and 300 °C respectively. The column temperature was set at 150 °C and then increased to 250 °C at the rate of 10 °C min−1 (held for 10 min). The injection volume was 1 μL.Fourier-transform infrared (FT-IR) spectra were recorded using a Spectrum One FTIR spectrometer (Perkin-Elmer, USA). The thermogravimetric analysis (TGA) experiments were performed on a Q500 thermal gravimetric analyzer (TA, USA). A scanning electron microscope (SEM, JSM-6700F, JEOL Company, Japan) was used to characterize the microscopic morphology of the fiber coatings. Transmission electron microscopy (TEM) images were recorded on a JEM-2100F TEM instrument (Japan).
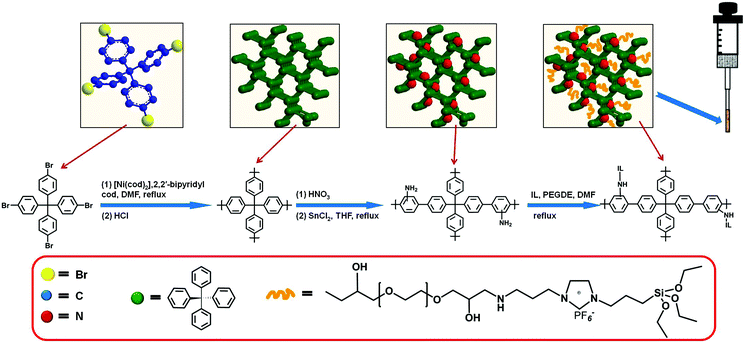
Synthesis of PAF/IL composites
Secondly, 1-(triethoxy silyl)propyl-3-aminopropyl hexafluorophosphate was prepared by an anion exchange reaction.30 The synthesized 1-(triethoxysilyl)propyl-3-aminopropyl imidazole bromide was dissolved in 30 mL methanol and then KPF6 (15.41 mmol) was added under the protection of nitrogen. After the reaction was carried out overnight at 55 °C, the residue was removed. The resulting pale yellow solution was dried under vacuum at 80 °C for 12 h to obtain a viscous ionic liquid.
100 mg as-prepared PAF-NH2 and 1020 mg 1-(triethoxy silyl)propyl-3-aminopropyl hexafluorophosphate were dispersed in 60 mL DMF containing PEGDE (15%, v/v). The yellow suspension was refluxed at 80 °C for 24 h and then centrifuged. The obtained yellow product was washed with anhydrous ethanol to remove unnecessary PEGDE and dried under vacuum at 120 °C to obtain PAF/IL composites.
Preparation of the PAF/IL coated SPME fiber
The overall process to prepare the home-made SPME device is shown in Fig. 1. The end of the quartz fiber (about 1 cm) was dipped in acetone to remove the protective polyimide layer, washed with anhydrous ethanol, and dried at room temperature. The pretreated part of the fiber was vertically dipped in the epoxy resin glue for 30 s and then pulled out carefully, after which the excess epoxy resin glue was wiped by a glass sheet.18 The as-obtained fiber was inserted into a centrifuge tube filled with PAF/IL powder, rotated for 60 s, and then pulled out slowly. After solidification at room temperature for 24 h, the fiber was dried under vacuum at 80 °C for 8 h. Finally, the fiber was passed through a microsyringe to prepare the home-made SPME device. The PAF SPME fiber was made in the same way.Sample preparation
The preparation of juice and milk samples was carried out according to previously reported method.32,33 The juice samples were filtered through a 0.45 μm filter membrane. 2 mL of the filtered sample was added into a centrifuge tube and made up to 10 mL with acetone. The solution was homogenized for 30 min in an ultrasonic cleaner and then centrifuged in a high-speed centrifuge for 15 min. After removing the solvent in the supernatant by rotary evaporation, the residue was dissolved in 10 mL methanol. The prepared sample solutions were stored in a refrigerator. Before the analysis, milk samples were filtered through a 0.45 μm filter membrane and then 1 mL of the resulting sample was added into the mixture of 500 μL formic acid and 10 μL TEA. The mixture was homogenized properly and centrifuged for 20 min, after which 2490 μL ultrapure water was added into the obtained supernatant (1 mL). The sample was centrifuged for 5 min, and then 1 mL of the resulting supernatant was used for analysis.Headspace SPME procedure
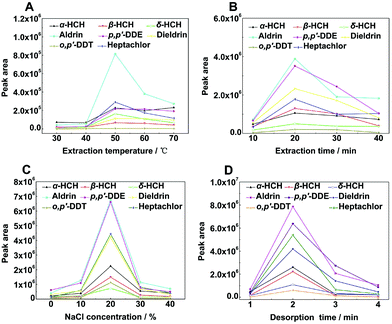
Compared with direct immersion SPME (DI-SPME), headspace SPME (HS-SPME) avoids the fiber coating from coming into contact with the sample solution directly owing to the susceptibility of the coating to slough off the fiber when subjected to the aqueous matrix. In the present HS-SPME procedure, 1 mL working solutions with concentration ranging from 1 to 1000 μg L−1 were added into a 10 mL amber vial enclosed by a PTFE-coated septa for analysis. Extractions were performed at 50 °C for 20 min by employing a magnetic stirrer (1000 rpm) to accelerate the extraction. The ionic strength was kept constant by adding 20% (w/v) NaCl. Before each extraction the fiber was conditioned in the injector for 10 min.Results and discussion
Characterization of PAF/IL fibers
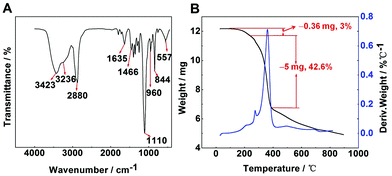
FT-IR spectra were used to indicate the characteristic groups of PAF/IL (Fig. 2A). The peaks at 844 and 557 cm−1 responded to [PF6]−1 absorption bands, while the peak at 1466 cm−1 was the vibration of the imidazole ring in 1-(triethoxy silyl)propyl-3-aminopropyl hexafluorophosphate.34 The band at 960 cm−1 presented the vibration of Si–O–C. The peaks at 2880 and 1110 cm−1 were attributed to the C–H asymmetric stretching and C–O–C stretching vibrations of PEGDE.35 The peaks at 3423, 3236, and 1635 cm−1 were assigned to the O–H adsorption band, N–H stretching vibration, and N–H deformation, respectively.To examine the thermal properties and stability of the material, TGA-DTG analysis was carried out under a nitrogen atmosphere over the temperature range of 20–900 °C (Fig. 2B). Results showed that PAF/IL decomposed at approximately 275 °C. Within the range of 200–275 °C, a weight loss of 3% could be observed, which may be because the boiling point of the residual PEGDE is 197 °C. According to a previous study,35 the composites of PEGDE attached to a substrate decomposed at about 200 °C. In the present work, 1-(triethoxy silyl)propyl-3-aminopropyl hexafluorophosphate improved the thermal stability, leading to a decomposition temperature of 275 °C. High desorption temperature can improve desorption efficiency; however, too high desorption temperature may cause decomposition of fiber coating. Therefore, 250 °C was selected as the desorption temperature in further experiments. In addition, it could be observed in TGA curves that a crosslinking degree of about 42.6% was obtained.
The surface characteristics of the homemade PAF/IL coating were investigated by SEM. Fig. 3A and B present SEM images of the bare fiber and PAF/IL coated fiber, respectively. A smooth surface of the former with a diameter about 120 μm and a uniform coating of the latter with a thickness of about 30 μm could be observed. In addition, TEM determination was carried out to gain a deep insight into the morphology of PAF/IL coatings. TEM images of PAF and PAF/IL are shown in Fig. 3C and D, respectively, indicating that IL was successfully introduced onto PAF. In addition, the porous morphology of PAF/IL could be clearly observed from the TEM image.
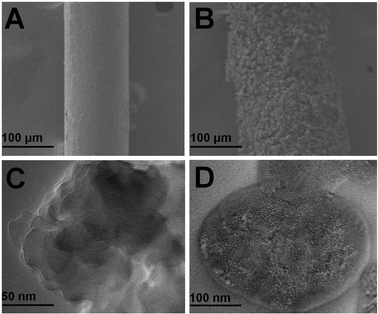 | ||
| Fig. 3 SEM images of bare fiber (A) and PAF/IL fiber (B) and TEM images of PAF fiber (C) and PAF/IL fiber (D). | ||
Optimization of SPME conditions
To obtain the highest extraction efficiency, working solutions containing 200 μg L−1 OCPs were employed for the optimization of experimental parameters including extraction temperature, extraction time, ionic strength, and desorption time. pH does not play an important role in HS-SPME extraction of OCPs because they are non-ionizable;36 therefore, pH dependences were not considered in the present study. The desorption temperature was 250 °C as mentioned above. The stirring speed was 1000 rpm all the time.Statistical analysis
We used the Student's t-test to prove the rationality of the optimal experimental conditions (Table S1†). Analytical data showed that the optimal values and the nearest values of experimental conditions showed significant differences (P < 0.05) and the results were consistent with experimental results in Fig. 4, which further proved that the selected experimental conditions were reasonable.37Method validation
Analytical performance
Under the optimized experimental conditions, the analytical performance of OCPs using the HS-SPME GC-ECD method was investigated. Table 1 lists the figures of merit for the extraction of OCPs using PAF/IL coatings. The linear range was 1–500 μg L−1 with correlation coefficients (R2) varying from 0.9932 to 0.9995. The detection limits (LODs) and quantification limits (LOQs) were determined to be in the range of 0.11–0.29 μg L−1 and 0.35–0.93 μg L−1, respectively. The precision (relative standard deviation, RSD) for six repeated extractions with one fiber ranged from 4.4% to 7.2% while the fiber-to-fiber RSD values of three PAF/IL coatings were in the range of 5.7%–10.1%.| RSD | |||||||
|---|---|---|---|---|---|---|---|
| Analyte | LR (μg L−1) | R 2 | LODs (μg L−1) | LOQs (μg L−1) | One fiber (%, n = 6) | Fiber-to-fiber (%, n = 3) | F |
| F 1, 3 = 10.13. | |||||||
| α-HCH | 1–500 | 0.9974 | 0.20 | 0.69 | 5.0 | 6.8 | 1150.85 |
| β-HCH | 1–500 | 0.9963 | 0.15 | 0.52 | 4.9 | 7.2 | 807.81 |
| δ-HCH | 1–500 | 0.9995 | 0.18 | 0.60 | 6.5 | 8.3 | 5997.00 |
| Heptachlor | 1–500 | 0.9975 | 0.24 | 0.78 | 5.1 | 6.5 | 1197.00 |
| Aldrin | 1–500 | 0.9957 | 0.16 | 0.56 | 5.7 | 7.6 | 694.67 |
| p,p′-DDE | 1–500 | 0.9981 | 0.11 | 0.35 | 4.4 | 5.7 | 1575.95 |
| Dieldrin | 1–500 | 0.9955 | 0.13 | 0.44 | 6.1 | 7.8 | 663.67 |
| o,p′-DDT | 1–500 | 0.9932 | 0.29 | 0.93 | 7.2 | 10.1 | 438.18 |
To evaluate the correlation, F test was applied and calculated by using F = r2(n − 2)/(1 − r2) (where r is the correlation coefficient and n is the number of concentration levels). The F values are also listed in Table 1. It could be observed that peak areas should be concentration-dependent because all the F values were much higher than the F0.05(1,3) value, 10.13.38
Comparison studies
To evaluate the extraction efficiency of the homemade fiber, we compared the enrichment factors (EFs) of PAF/IL and PAF coatings under optimized conditions. Results are shown in Fig. 5A, where EFs were obtained as the ratio of the signal obtained after extraction to that obtained before extraction, i.e., 1 μL of the standard solution were directly injected. The results showed that both PAF/IL and PAF SPME fibers had affinity to OCPs; however, the former showed higher EFs than the latter. Possible explanations are as follows. For the PAF fiber, hydrophobic and π–π interactions existed between PAF and OCPs39,40 and the porous structure of PAF contributed to the efficient extraction of OCPs. When IL was introduced into the synthesis procedure of the SPME fiber, similar hydrophobic and π–π interactions existed between IL and OCPs,23,34 leading to a higher extraction capacity of OCPs by PAF/IL coatings. In addition, imidazole cations that consisted of 1-(triethoxy silyl)propyl-3-aminopropyl hexafluorophosphate could cause electrostatic interactions with OCPs.23 Furthermore, the functionalized PAF with a porous structure might be an efficient host material which has good affinity for OCPs.39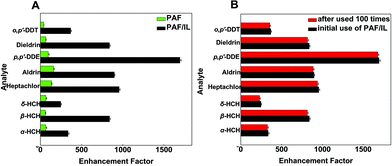 | ||
| Fig. 5 Comparison of enhancement factors of PAF and PAF/IL fibers (A) and PAF/IL fiber before and after being used 100 times (B). | ||
In addition, the present PAF/IL-HS-SPME GC-ECD method was compared with some reported methods for the determination of OCPs focusing on SPME strategies. As shown in Table 2, various types of fibers with different thickness were employed for the microextraction of OCPs. Although the present method could not show the best LOD level, the PAF/IL SPME fiber showed high enrichment efficiency for OCPs, implying its great potential for use in the preconcentration of persistent organic pollutants.
| OCPs | Type of coating | Thickness of coating | Instrument | LODs (μg L−1) | EF | Real sample | Ref. |
|---|---|---|---|---|---|---|---|
| PDMS: polydimethylsiloxane; C-PDA: carbonized polydopamine; MOF-199/GO: metal–organic framework-199/graphite oxide; BPAN: nano-structured polyaniline-ionic liquid; DVB/Car/PDMS: polydimethylsiloxane/carboxen/divinylbenzene; PA: polyacrylate; PDMS-DVB: polydimethylsiloxane-divinylbenzene. | |||||||
| Heptachlor, Aldrin, Dieldrin, o,p′-DDT | PDMS | 100 μm | GC/MS | 0.04–0.41 | — | Textile | 7 |
| o,p′-DDT | Titania | 17 μm | GC/MS | 0.00035 | 916 | Water | 8 |
| o,p′-DDT | C18 | 35 μm | GC/MS | 0.000059 | — | Water | 9 |
| Heptachlor, Aldrin, Dieldrin | C-PDA | 2 μm | GC/MS | 0.0044–0.015 | 102–302 | Water | 10 |
| α-HCH, Heptachlor, Aldrin | Cork | 200 μm | GC/ECD | 0.0003–0.003 | — | Water | 11 |
| Aldrin, p,p′-DDE, Dieldrin | MOF-199/GO | 40 μm | GC/ECD | 0.0028–0.0043 | 7.1–108 | Water, soil, water convolvulus, Longan | 19 |
| α-HCH, p,p′-DDE | BPAN | 15 μm | GC/ECD | 0.00012–0.0002 | — | Water | 24 |
| Heptachlor, Aldrin, Dieldrin | DVB/Car/PDMS | 50/30 μm | GC/ECD | 0.2–0.4 | — | Milk | 41 |
| α-HCH, β-HCH, p,p′-DDE, o,p′-DDT | PA | 85 μm | GC/ECD | 0.31–2.79 | — | Breast milk | 42 |
| Heptachlor, Aldrin, p,p′-DDE, Dieldrin | PDMS-DVB | 65 μm | GC-μECD | 0.015–0.060 | — | Bovine milk | 43 |
| β-HCH, δ-HCH, Heptachlor, Aldrin, p,p′-DDE | PDMS | 100 μm | GC/ECD/FPD | 10–20 | — | Urine and serum | 44 |
| α-HCH, β-HCH, δ-HCH, Heptachlor, Aldrin, p,p′-DDE, Dieldrin, o,p′-DDT | PAF/IL | 30 μm | GC/ECD | 0.11–0.29 | 247–1696 | Juice, milk | Our work |
Lifetime of PAF/IL fibers
The lifetime of an SPME fiber is very crucial for practical application. In our work, the homemade PAF/IL SPME fiber was used more than 100 times in adsorption/desorption cycles without a significant decrease in extraction efficiencies. Results of EF values are presented in Fig. 5B, indicating that the PAF/IL fiber had high stabilities. As is well known, IL fibers have the drawback of a viscosity decrease at high temperature, which leads to unacceptable durability.15 It could be concluded that the present strategy successfully combines the advantages of a high stability of PAF and a satisfactory extraction efficiency of PAF and IL.Real sample analysis and recoveries
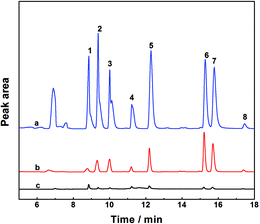
To validate the newly established method in real samples with a complex matrix, the feasibility of the enrichment strategy for the determination of OCPs was studied by analyzing the targets in juice and milk samples under the above optimized experimental circumstances. Juice or milk samples were spiked with OCPs at two different concentration levels, 10 μg L−1 (Level 1) and 100 μg L−1 (Level 2). As shown in Table 3, the recoveries of α-HCH, β-HCH, δ-HCH, Heptachlor, Aldrin, p,p′-DDE, Dieldrin, and o,p′-DDT in different samples were in the range of 79.4–83.9%, 80.7–88.2%, 77.6–90.8%, 76.1–86.0%, 83.8–91.8%, 91.5–121.3%, 90.2–112.0%, and 77.2–85.8% with RSD values of 0.5–6.1%, respectively. These results demonstrated that the complex sample matrix in juice or milk samples had little effect on the extraction efficiency of the PAF/IL HS-SPME method. In addition, it should be noted that most of the target OCPs were detected in the real samples; however, such contents were lower than the Maximum Residue Limits (MRLs) in food admitted by the National Standard of the People's Republic of China.45 A typical GC chromatogram of blank and spiked samples with standards is shown in Fig. 6.| Sample | α-HCH | β-HCH | δ-HCH | Heptachlor | Aldrin | p,p′-DDE | Dieldrin | o,p′-DDT | ||
|---|---|---|---|---|---|---|---|---|---|---|
| a Spiked with 10 μg L−1 OCPs solution. b Spiked with 100 μg L−1 OCPs solution. | ||||||||||
| Apple juice | Found (μg L−1) | <LOD | <LOD | <LOD | <LOD | 0.90 | 0.86 | 0.74 | <LOD | |
| % Recovery | Level 1a | 80.6 ± 6.1 | 84.7 ± 4.3 | 89.7 ± 4.1 | 76.1 ± 5.7 | 83.8 ± 4.9 | 91.5 ± 3.2 | 93.6 ± 5.1 | 78.3 ± 2.8 | |
| Level 2b | 81.7 ± 3.2 | 87.6 ± 0.5 | 90.8 ± 0.7 | 80.9 ± 4.1 | 87.6 ± 1.2 | 95.2 ± 2.1 | 112.0 ± 3.4 | 77.2 ± 0.8 | ||
| Peach juice | Found (μg L−1) | <LOD | <LOD | <LOD | <LOD | <LOD | 0.64 | 0.54 | <LOD | |
| % Recovery | Level 1 | 83.0 ± 1.9 | 85.1 ± 3.7 | 77.6 ± 2.3 | 80.5 ± 2.6 | 86.7 ± 4.1 | 108.9 ± 5.1 | 90.2 ± 0.8 | 77.2 ± 3.5 | |
| Level 2 | 81.8 ± 1.3 | 87.0 ± 2.9 | 82.3 ± 1.5 | 81.3 ± 3.8 | 89.5 ± 2.5 | 121.3 ± 4.5 | 92.4 ± 1.1 | 81.7 ± 2.0 | ||
| Milk 1 | Found (μg L−1) | 2.80 | 0.68 | 0.23 | 0.51 | 0.29 | 0.16 | 0.25 | <LOD | |
| % Recovery | Level 1 | 79.4 ± 1.2 | 80.7 ± 2.5 | 80.2 ± 2.7 | 79.9 ± 2.6 | 89.6 ± 3.1 | 96.7 ± 4.3 | 91.5 ± 1.4 | 78.7 ± 3.8 | |
| Level 2 | 82.6 ± 1.7 | 83.9 ± 1.8 | 80.6 ± 2.9 | 82.1 ± 1.0 | 88.3 ± 2.2 | 99.8 ± 3.1 | 95.1 ± 1.1 | 81.9 ± 3.7 | ||
| Milk 2 | Found (μg L−1) | 1.96 | <LOD | 0.24 | <LOD | 0.25 | <LOD | <LOD | <LOD | |
| % Recovery | Level 1 | 80.2 ± 1.4 | 83.7 ± 4.6 | 82.4 ± 2.5 | 83.3 ± 2.4 | 89.1 ± 3.3 | 95.8 ± 2.6 | 92.9 ± 2.4 | 81.5 ± 1.6 | |
| Level 2 | 83.9 ± 0.9 | 88.2 ± 3.1 | 84.9 ± 1.8 | 86.0 ± 1.9 | 91.8 ± 2.7 | 105.4 ± 2.2 | 95.9 ± 1.8 | 85.8 ± 1.3 | ||
Conclusions
We have developed a novel PAF/IL SPME fiber coupled with GC-ECD for the determination of OCPs from juice and milk samples. The developed method showed good performance with a linear range of 1–500 μg L−1 and low detection limits ranging from 0.11 μg L−1 to 0.29 μg L−1, indicating that the developed method was suitable for the determination of OCPs in juice and milk samples. The high extraction efficiency of the PAF/IL fiber was mainly due to hydrophobic interactions, π–π interactions, and electrostatic interactions between PAF/IL and OCPs. The present work is the first attempt to introduce PAF/IL into the process of SPME. Future study will be directed towards the search for more effective applications of PAF-based materials in the field of microextraction. We look forward to more extensive applications of PAF in the preconcentration and analytical methods.Acknowledgements
This project was supported by the National Natural Science Foundation of China (21205047) and Jilin Provincial Science & Technology Department (No. 20140101112JC).References
- M. Pan, X. Ma, S. Song, J. Zhang, C. Liu and X. Guo, Anal. Lett., 2014, 47, 2173–2182 CrossRef CAS.
- J. G. Martins, A. Amaya Chavez, S. M. Waliszewski, A. Colin Cruz and M. M. Garcia Fabila, Chemosphere, 2013, 92, 233–246 CrossRef CAS PubMed.
- D. A. Sousa, R. M. Gonçalves, F. F. Heleno, M. E. L. R. de Queiroz and M. R. R. de Marchi, Microchem. J., 2014, 114, 266–272 CrossRef CAS.
- Z. Huang and H. K. Lee, J. Chromatogr., A, 2015, 1401, 9–16 CrossRef CAS PubMed.
- Z. He, P. Wang, D. Liu and Z. Zhou, Talanta, 2014, 127, 1–8 CrossRef CAS PubMed.
- H. Ziarrusta, M. Olivares, A. Delgado, O. PosadaUreta, O. Zuloaga and N. Etxebarria, J. Chromatogr., A, 2015, 1391, 18–30 CrossRef CAS PubMed.
- J. A. Cai, F. Zhu, W. Ruan, L. Liu, R. Lai, F. Zeng and G. Ouyang, Microchem. J., 2013, 110, 280–284 CrossRef CAS.
- S. Liu, L. Xie, J. Zheng, R. Jiang, F. Zhu, T. Luan and G. Ouyang, Anal. Chim. Acta, 2015, 878, 109–117 CrossRef CAS PubMed.
- S. Li, C. Lu, F. Zhu, R. Jiang and G. Ouyang, Anal. Chim. Acta, 2015, 873, 57–62 CrossRef CAS PubMed.
- Z. Huang, P. E. Chua and H. K. Lee, J. Chromatogr., A, 2015, 1399, 8–17 CrossRef CAS PubMed.
- A. N. Dias, V. Simao, J. Merib and E. Carasek, Talanta, 2015, 134, 409–414 CrossRef PubMed.
- S. Zhang, Z. Du and G. Li, Anal. Chem., 2011, 83, 7531–7541 CrossRef CAS PubMed.
- G. Zhang, X. Zhou, X. Zang, Z. Li, C. Wang and Z. Wang, Chin. Chem. Lett., 2014, 25, 1449–1454 CrossRef CAS.
- Y. Li, F. Yang, Z. Liu, Q. Liu and Y. Dong, J. Mater. Chem. A, 2014, 2, 13868 CAS.
- J. Zheng, S. Li, Y. Wang, L. Li, C. Su, H. Liu, F. Zhu, R. Jiang and G. Ouyang, Anal. Chim. Acta, 2014, 829, 22–27 CrossRef CAS PubMed.
- G. Zhang, X. Zang, Z. Li, C. Wang and Z. Wang, Talanta, 2014, 129, 600–605 CrossRef CAS PubMed.
- Y. Y. Wu, C. X. Yang and X. P. Yan, J. Chromatogr., A, 2014, 1334, 1–8 CrossRef CAS PubMed.
- H. B. Shang, C. X. Yang and X. P. Yan, J. Chromatogr., A, 2014, 1357, 165–171 CrossRef CAS PubMed.
- S. Zhang, Z. Du and G. Li, Talanta, 2013, 115, 32–39 CrossRef CAS PubMed.
- Y. Xu, S. Jin, H. Xu, A. Nagai and D. Jiang, Chem. Soc. Rev., 2013, 42, 8012–8031 RSC.
- B. Li, Y. Zhang, R. Krishna, K. Yao, Y. Han, Z. Wu, D. Ma, Z. Shi, T. Pham, B. Space, J. Liu, P. K. Thallapally, J. Liu, M. Chrzanowski and S. Ma, J. Am. Chem. Soc., 2014, 136, 8654–8660 CrossRef CAS PubMed.
- Y. Yuan, F. Sun, H. Ren, X. Jing, W. Wang, H. Ma, H. Zhao and G. Zhu, J. Mater. Chem., 2011, 21, 13498 RSC.
- X. Gao, M. Pan, G. Fang, W. Jing, S. He and S. Wang, Anal. Methods, 2013, 5, 6128 RSC.
- Z. Gao, W. Li, B. Liu, F. Liang, H. He, S. Yang and C. Sun, J. Chromatogr., A, 2011, 1218, 6285–6291 CrossRef CAS PubMed.
- X. Huang, L. Chen, D. Yuan and S. Bi, J. Chromatogr., A, 2012, 1248, 67–73 CrossRef CAS PubMed.
- T. D. Ho, H. Yu, W. T. S. Cole and J. L. Anderson, Anal. Chem., 2012, 9520–9528, DOI:10.1021/ac302316c.
- H. Yu, T. D. Ho and J. L. Anderson, TrAC, Trends Anal. Chem., 2013, 45, 219–232 CrossRef CAS.
- F. O. Pelit, L. Pelit, T. N. Dizdas, C. Aftafa, H. Ertas, E. E. Yalcinkaya, H. Turkmen and F. N. Ertas, Anal. Chim. Acta, 2015, 859, 37–45 CrossRef CAS PubMed.
- T. Ben, H. Ren, S. Ma, D. Cao, J. Lan, X. Jing, W. Wang, J. Xu, F. Deng, J. M. Simmons, S. Qiu and G. Zhu, Angew. Chem., Int. Ed., 2009, 48, 9457–9460 CrossRef CAS PubMed.
- H. Zhou, L. Yang, W. Li, Q. Shou, P. Xu, W. Li, F. Wang, P. Yu and H. Liu, Ind. Eng. Chem. Res., 2012, 51, 4582–4590 CrossRef CAS.
- E. Kang, S. B. Choi, N. Ko and J. K. Yang, Bull. Korean Chem. Soc., 2014, 35, 283–285 CrossRef CAS.
- M. Tian, R. Cheng, J. Ye, X. Liu and Q. Jia, Food Chem., 2014, 145, 28–33 CrossRef CAS PubMed.
- M. J. Gonzalez Rodriguez, F. J. Arrebola Liebanas, A. Garrido Frenich, J. L. Martinez Vidal and F. J. Sanchez Lopez, Anal. Bioanal. Chem., 2005, 382, 164–172 CrossRef CAS PubMed.
- J. J. Shu, C. Li, M. M. Liu, H. L. Liu, X. H. Feng, W. F. Tan and F. Liu, Chromatographia, 2012, 75, 1421–1433 CAS.
- D. K. Roh, S. J. Kim, W. S. Chi, J. K. Kim and J. H. Kim, Chem. Commun., 2014, 50, 5717–5720 RSC.
- M. L. BaoHuey Hwang, J. Chromatogr., A, 2000, 898, 245–256 CrossRef.
- Y. Song, L. Wu, N. Li, M. Hu and Z. Wang, Talanta, 2015, 135, 163–169 CrossRef CAS PubMed.
- Y. Wang, J. You, R. Ren, Y. Xiao, S. Gao, H. Zhang and A. Yu, J. Chromatogr., A, 2010, 1217, 4241–4246 CrossRef CAS PubMed.
- T. Ben and S. Qiu, CrystEngComm, 2013, 15, 17–26 RSC.
- H. Ren, T. Ben, E. Wang, X. Jing, M. Xue, B. Liu, Y. Cui, S. Qiu and G. Zhu, Chem. Commun., 2010, 46, 291–293 RSC.
- J. Merib, G. Nardini and E. Carasek, Anal. Methods, 2014, 6, 3254 RSC.
- L. R. H.-U. Meisch, Fresenius J. Anal. Chem., 2000, 106–111 Search PubMed.
- M. Fernandez-Alvarez, M. Llompart, J. P. Lamas, M. Lores, C. Garcia-Jares, R. Cela and T. Dagnac, Anal. Chim. Acta, 2008, 617, 37–50 CrossRef CAS PubMed.
- E. P. F. J. López, S. Egea, J. Beltran and F. Hernández, Anal. Chim. Acta, 2001, 433, 217–226 CrossRef.
- GB 2763-2014, Maximum residue limits for pesticides in food, National Standard of the People's Republic of China, 2014 Search PubMed.
Footnote |
| † Electronic supplementary information (ESI) available. See DOI: 10.1039/c5an01372k |
| This journal is © The Royal Society of Chemistry 2016 |

