Particle size measurement from infrared laser ablation of tissue†
Fan
Cao
,
Fabrizio
Donnarumma
and
Kermit K.
Murray
*
Department of Chemistry, Louisiana State University, Baton Rouge, Louisiana. 70803, USA. E-mail: kkmurray@lsu.edu; Tel: (+225) 578-3417
First published on 18th November 2015
Abstract
The concentration and size distribution were measured for particles ablated from tissue sections using an infrared optical parametric oscillator laser system. A scanning mobility particle sizer and light scattering particle sizer were used in parallel to realize a particle sizing range from 10 nm to 20 μm. Tissue sections from rat brain and lung ranging in thickness between 10 and 50 μm were mounted on microscope slides and irradiated with nanosecond laser pulses at 3 μm wavelength and fluences between 7 and 21 kJ m−2 in reflection geometry. The particle size distributions were characterized by a bimodal distribution with a large number of particles 100 nm in diameter and below and a large mass contribution from particles greater than 1 μm in diameter. The large particle contribution dominated the ablated particle mass at high laser fluence. The tissue type, thickness, and water content did not have a significant effect on the particle size distributions. The implications of these results for laser ablation sampling and mass spectrometry imaging under ambient conditions are discussed.
Introduction
Imaging mass spectrometry uses spectra obtained sequentially at regular intervals on a surface, such as a section of tissue.1–4 Under vacuum, a laser or particle beam bombards the surface to remove material that ultimately forms ions for mass spectrometry analysis. The techniques matrix-assisted laser desorption ionization5,6 (MALDI) and secondary ion mass spectrometry (SIMS)7–10 may involve ejected clusters and particles that lead to the formation of ions.11–13 Although SIMS is limited to vacuum ionization, MALDI can be accomplished under ambient conditions, known as atmospheric pressure MALDI,14–16 and has been used for imaging in this mode.16,17In addition to AP-MALDI, ambient ion formation can be achieved by bombarding surfaces with charged droplets, ions, metastable atoms, or photons, and the material can be removed by extraction, heating, laser ablation, or acoustic shock.18 For example, in desorption electrospray ionization (DESI), highly charged electrospray droplets are directed at the surface, wetting it and removing some of the chemical components for ionization.19 The direct analysis in real time (DART) ion source20 is a related method that uses metastable ions from a glow discharge directed at the surface and the volatile species heated and desorbed from the sample are ionized by chemical ionization. Methods of post-ionization include inductively coupled plasma,21–23 chemical ionization,24,25 photoionization26 and electrospray ionization.27–31 Ambient mass spectrometry imaging has been reported using laser desorption and ablation merged with electrospray,32,33 metastable chemical ionization,34,35 flowing afterglow post-ionization,36 and inductively coupled plasma ionization.37–39 Laser desorbed and ablated material can also be collected prior to post-ionization40 and analyzed or imaged off-line.40,41 The mechanisms for ionization for the above techniques are widely varied and therefore the form of the ablated material, molecules, clusters, and particles, is highly important.
Ablation of tissue differs from ablation of molecular solids in that tissue is a heterogeneous material with a high water content and abundant extracellular material (ECM) containing collagen and elastin, which affects its interaction with lasers for ablation.42 The mechanical strength of tissue can limit recoil ejection of material and can lead to confined boiling due to the tissue holding together at higher temperatures. The mechanical strength of the tissue can limit shock recoil ejection of material and limit the efficiency of laser ablation, although this can be mitigated by thermal degradation on exposure to the laser. For example, mechanically strong tissue such as skin does not exhibit strong secondary expulsion of material due to shock recoil, which results in less efficient removal of material compared to mechanically weaker tissue.43 These studies demonstrate that, in addition to the laser wavelength, pulse temporal width, and energy, the composition of the tissue has a profound effect on the quantity and form of the material ablated.
The behavior of material removal in tissue ablation is typically studied by shadowgraph or light scattering images.42,43 These approaches enable the investigation of the temporal behavior of material removal, but are not amenable to small particles that do not efficiently scatter light. We have recently developed a method for measuring the particle sizes of ablated material over the full range of particle sizes ranging from 10 nm to 20 μm.44 We have used the full-range particle sizing system to investigate particle production by shock impact,45 ultraviolet laser ablation,46 and wavelength resolved mid-laser ablation with the aim of using this information to improve mass spectrometry methods. However, all of these studies involved homogeneous thin films of molecular compounds and thus provide limited information with regard to laser ablation of tissue.
In the work described below, the full-range particle sizing system was used to study the size and concentration of particles ablated from rat lung and brain tissue sections. The tissue was cut into sections and mounted on a microscope slide that was placed in an ablation chamber under atmospheric pressure. The tissue was irradiated with a pulsed nanosecond infrared optical parametric oscillator (OPO) laser system at a wavelength of 2940 nm. The ablated particles were sampled, and the particle size and concentration were recorded for particles between 10 nm and 20 μm diameter. The effects of laser fluence, tissue section thickness, and tissue water content were investigated.
Experimental
The particle ablation and sizing instrument used to obtain the results shown below has been described in detail previously.44,47 Briefly, particle size measurements were performed using a combination of two commercial instruments: a scanning mobility particle sizer (SMPS, Model 3034, TSI, MN, USA) and an aerodynamic particle sizer (APS, Model 3321, TSI). The detection range for the SMPS is from 10 to 500 nm and for the APS it is 500 nm to 20 μm, resulting in a scanning range of 10 nm to 20 μm. Particles are created by laser ablation under ambient conditions in a 240 cm3 stainless steel chamber that is mounted above the inlet of the APS and connected to SMPS with a 20 cm long 5 mm I.D. conductive plastic tube. A high-efficiency particulate arrestance (HEPA) filter is placed on the top of the chamber to allow air to be drawn into the chamber. Both sizing instruments were operated with a 1 L min−1 sample flow and 4 L min−1 sheath flow.Tissue samples were placed on a rotating stage at the center of the chamber. An infrared (IR) optical parametric oscillator (OPO) laser system (IR Opolette, OPOTEK, Carlsbad, CA, USA) with maximum output energy of 2 mJ was used for the experiments. The laser wavelength was set to 2.94 μm, which overlaps OH stretch absorption of water and allows easy comparison with experiments performed with fixed-wavelength Er:YAG lasers. The laser pulse repetition rate was 2 Hz. A 150 mm calcium fluoride lens was used to focus the IR laser onto the target with a resulting 250 μm spot diameter for reflection geometry ablation. The sample target was rotated manually at approximately 15 RPM during ablation in order to expose a fresh surface to the laser. The acquisition time was 180 s and four replicates were performed for each experiment. The SMPS and APS data were merged to create particle size plots ranging from 10 nm to 20 μm.
Tissue samples were obtained from 4–6 week old breeding rats at the LSU School of Veterinary Medicine Division of Laboratory Animal Medicine (DLAM) using procedures approved by the LSU Institutional Animal Care and use Committee (IACUC). Animals were sacrificed by CO2 (5 psi) exposure for 1 hour and brain and lung tissue were collected and frozen in liquid nitrogen within 30 minutes. Frozen samples were stored at −80 °C. Thin sections were prepared with a cryostat (CM1850, Leica Microsystems, Wechsler, Germany) directly from the frozen tissue. Optimal cutting temperature compound (OCT, Sakura Finetek, USA) was used to fix one side of the sample to the cryostat support. Particular care was taken to avoid any contact of the OCT solution with the exposed side of the tissue. Both types of tissue were sectioned at 10, 30, or 50 μm thickness, thaw-mounted onto a plain glass microscope slide and stored at −80 °C until use. The tissue sections were dried for times ranging from 5 to 60 min under rough vacuum before ablation.
A background measurement was performed for all the tissue samples using filtered air with tissue samples loaded into the chamber but without laser irradiation. Measurements were performed 5 minutes after sealing of the chamber in order to allow clearing of the atmospheric air. The total number and mass weighted background particle concentrations were in all cases less than 10 particles per cm3 and 5 μg m−3, respectively.
Results and discussion
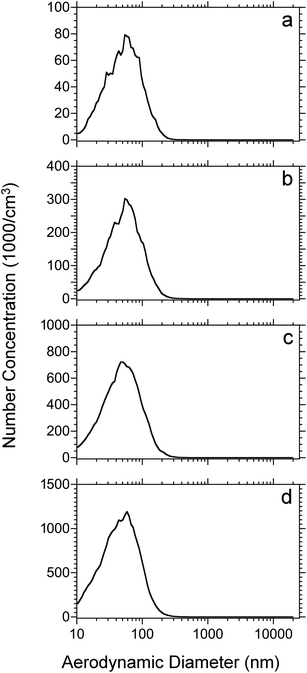
Initial experiments were performed to investigate the relationship between particle size distribution and laser fluence with tissue sections. Particle size measurements were performed on 50 μm thick rat lung tissue sections that were dried under vacuum for 15 minutes before loading into the ablation chamber. Fig. 1 shows plots of particle count as a function of aerodynamic diameter at laser fluences from 7 to 21 kJ m−2. The total number weighted concentration of ablated particles was 5.1 × 10⁴, 1.9 × 10⁵, 4.8 × 10⁵, and 8.1 × 105 cm−3 from low to high laser fluence and is indicated in Table 1. The shape of the distribution did not differ significantly among the different fluences with an average diameters ranging from 55 to 62 nm. Nearly all of the particles (>99%) were detected in a range of 10 nm (lower limit of the SMPS) to 300 nm and more than 86% of the particles were below 100 nm diameter. Overall, the most abundant particles ablated from the lung tissue sections were nanoparticles.| Laser fluence (kJ m−2) | Average particle diameter | Concentration | ||||||
|---|---|---|---|---|---|---|---|---|
| Number weighted (nm) | Mass weighted (nm) | Number weighted (#/cm3) | Mass weighted (μg m−3) | |||||
| <500 nm | >500 nm | <500 nm | >500 nm | <500 nm | >500 nm | <500 nm | >500 nm | |
| 7 | 61 ± 2 | 1200 ± 100 | 142 ± 6 | 8000 ± 3000 | 1.6 × 10⁶ ± 3 × 10⁵ | 50 ± 20 | 500 ± 100 | 300 ± 200 |
| 12 | 61 ± 2 | 1000 ± 30 | 150 ± 7 | 8000 ± 500 | 6 × 10⁶ ± 1 × 10⁶ | 200 ± 40 | 1800 ± 200 | 900 ± 100 |
| 17 | 59 ± 2 | 1700 ± 200 | 154 ± 9 | 9000 ± 300 | 1.6 × 10⁷ ± 4 × 10⁶ | 600 ± 200 | 4700 ± 600 | 12![[thin space (1/6-em)]](https://www.rsc.org/images/entities/char_2009.gif) 000 ± 5000 000 ± 5000 |
| 21 | 55 ± 1 | 1500 ± 200 | 143 ± 4 | 9000 ± 200 | 2.6 × 10⁷ ± 3 × 10⁶ | 1700 ± 500 | 6200 ± 600 | 23![[thin space (1/6-em)]](https://www.rsc.org/images/entities/char_2009.gif) 000 ± 3000 000 ± 3000 |
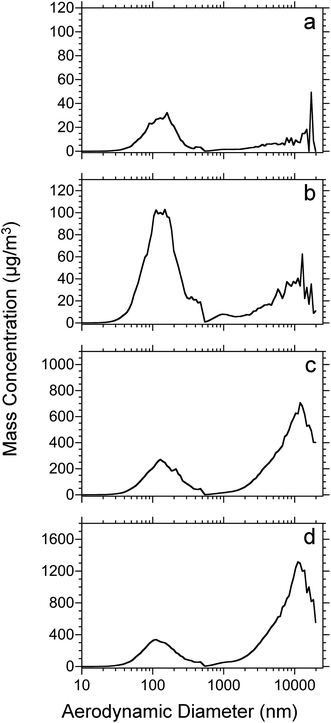
Fig. 2 shows the mass-weighted particle size distribution for 50 μm thick rat lung tissue sections vacuum-dried for 15 minutes before ablation. The dataset corresponds to that shown in Fig. 1. As above, the laser fluence ranged from 7 (Fig. 2a) to 21 kJ m−2 (Fig. 2d). All of the plots display a mass-weighted maximum above 100 nm diameter and, for the higher fluences, a significant mass in particles greater than several micrometers in diameter. The average mass weighted particle diameter and concentration are shown in Table 1. At all laser fluences, the particles below 500 nm have a similar distribution with an average diameter near 150 nm. For the micrometer-size particles, the signal is low at the lower fluences (7 and 12 kJ m−2), nearly at the level of noise, but at the higher fluence (17 and 21 kJ m−2) the distributions are similar. The ratio of microparticle mass to nanoparticle mass increases as a function of laser fluence: the distribution is dominated by nanoparticles at low fluence but is dominated by microparticles at high laser fluence.
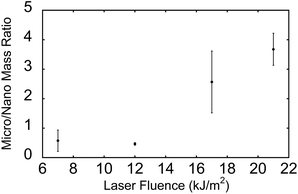
The ratio of microparticle mass (>500 nm diameter) to nanoparticle mass (<500 nm) is shown in Fig. 3. The data were obtained from the dataset shown in Fig. 1 and 2. For both nanoparticles and microparticles, the total mass increases with increasing laser fluence (Table 1). However, the ratio of microparticle to nanoparticle increases as well, from 50% microparticle at 7 kJ m−2 to 4 times the mass at 21 kJ m−2.
Water in the tissue section is the main absorber of the IR laser radiation.48 To ascertain the effect of the tissue water content on the ablated particle size, a study of the effect of drying time on particle size distribution was undertaken. For this study, a set of 50 μm thick rat lung tissue sections was dried at room temperature under vacuum for 5, 15, 30, 60 min before ablation at 17 kJ m−2 laser fluence. Plots of number and mass weighted particle size distributions for the various drying times are shown in ESI Fig. S1 and S2,† respectively. Counter to expectation, the size distributions of ablated particles do not display any obvious dependence on drying time.
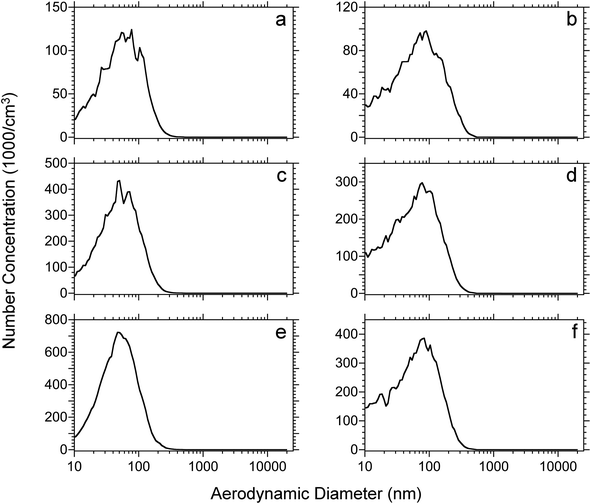
The effect of tissue thicknesses and tissue type were also investigated. Rat lung and brain tissues were cut into 10, 30, 50 μm thick sections. Each tissue section was dried under vacuum for 15 minutes and then ablated using the IR laser at a 17 kJ m−2 fluence. The number-weighted particle distributions of the different thickness rat lung and brain tissue sections are shown in Fig. 4. Among the same tissue type, the size distributions are similar with an increase of intensity proportional to the thickness of the tissue section. On the other hand, the size distributions of lung and brain tissue are slightly different. The average diameter of ablated lung tissue particles is approximately 60 nm for the three tissue thicknesses, whereas the average diameter of rat brain tissue particles is approximately 80 nm. The distribution of particulate from the brain tissue is broad and has a higher concentration of particles below 50 nm diameter and the distribution extends to 400 nm as opposed to 300 nm for the lung tissue.
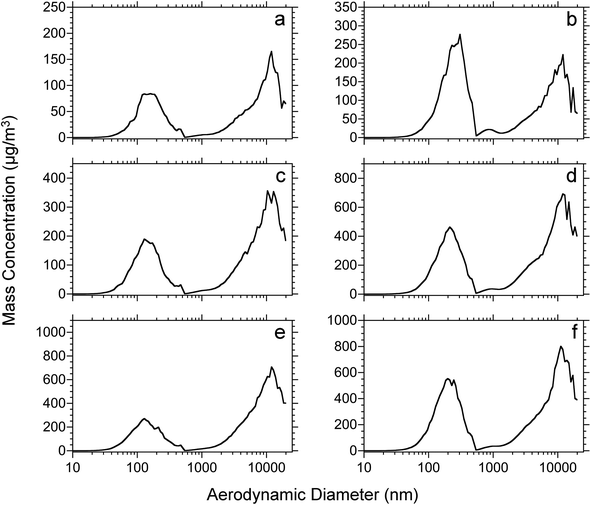
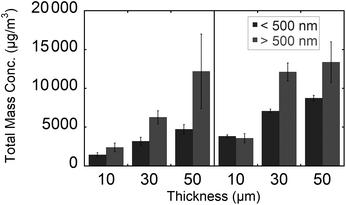
Plots of mass weighted particle distributions for different tissue types and thicknesses are shown in Fig. 5. Two maxima are observed for nanoparticles and microparticles from the lung and brain tissue. For the various thicknesses, no significant difference is observed with regard to the average diameter or the ratio of microparticle to nanoparticle. The average diameters for nanoparticles and microparticles are reported in Table 2. The trends of total mass weighted concentrations of ablated rat brain and lung tissue nanoparticles and microparticles are shown in Fig. 6. Both nanoparticle and microparticle total concentrations are higher for the thicker tissue sections and there is in almost all cases more mass contained in the microparticles compared to the nanoparticles.
| Thickness (μm) | Average particle diameter | Concentration | ||||||
|---|---|---|---|---|---|---|---|---|
| Number weighted (nm) | Mass weighted (nm) | Number weighted (#/cm3) | Mass weighted (μg m−3) | |||||
| <500 nm | >500 nm | <500 nm | >500 nm | <500 nm | >500 nm | <500 nm | >500 nm | |
| Rat lung tissue section | ||||||||
| 10 | 67 ± 3 | 1400 ± 100 | 170 ± 5 | 9000 ± 500 | 3.1 × 10⁶ ± 5 × 10⁵ | 200 ± 100 | 1400 ± 300 | 2400 ± 600 |
| 30 | 60 ± 2 | 1500 ± 100 | 155 ± 5 | 9000 ± 400 | 1 × 10⁷ ± 1 × 10⁶ | 400 ± 100 | 3200 ± 500 | 6300 ± 800 |
| 50 | 59 ± 2 | 1700 ± 200 | 154 ± 9 | 9000 ± 300 | 1.6 × 10⁷ ± 4 × 10⁶ | 600 ± 200 | 4700 ± 600 | 12![[thin space (1/6-em)]](https://www.rsc.org/images/entities/char_2009.gif) 000 ± 5000 000 ± 5000 |
| Rat brain tissue section | ||||||||
| 10 | 87 ± 2 | 1000 ± 40 | 242 ± 4 | 9000 ± 200 | 2.9 × 10⁶ ± 1 × 10⁵ | 800 ± 100 | 3800 ± 200 | 3600 ± 600 |
| 30 | 77 ± 3 | 1200 ± 50 | 211 ± 8 | 9000 ± 200 | 8.3 × 10⁶ ± 1 × 10⁶ | 1400 ± 100 | 7100 ± 200 | 12![[thin space (1/6-em)]](https://www.rsc.org/images/entities/char_2009.gif) 000 ± 1000 000 ± 1000 |
| 50 | 76 ± 3 | 1300 ± 30 | 205 ± 6 | 9000 ± 200 | 1.08 × 10⁷ ± 7 × 10⁵ | 1300 ± 300 | 8700 ± 400 | 13![[thin space (1/6-em)]](https://www.rsc.org/images/entities/char_2009.gif) 000 ± 3000 000 ± 3000 |
The particle size distribution obtained from laser ablation of tissue is qualitatively similar to that observed previously with the full-range particle sizing system.44,47,49,50 There are a large number of smaller particles around 100 nm in diameter that are associated with cluster agglomeration and hydrodynamic sputtering, and a smaller number but comparable mass of larger particles greater than 1 μm in diameter that are associated with spallation of large chunks of material. These observations are consistent with our previous results for matrix materials using an ultraviolet (UV) laser with reflection mode (front-side) and transmission mode (back-side) irradiation44,49 and an IR laser in reflection mode.47 The general result from these studies are the observation that IR laser ablation tends to produce a large number of particles with diameters smaller than 100 nm47 compared to size distributions above 100 nm in the case of reflection mode UV ablation.44 In reflection mode, the IR laser ablated coarse particles are produced with a mass weighted size distribution generally larger than 1 μm as compared to reflection mode UV ablated coarse particles where the majority of the mass is contained in particles smaller than 1 μm. This general trend is also observed for tissue ablation: the nanoparticles are smaller than 100 nm (Fig. 1) and the coarse particles are significantly larger than 1 μm (Fig. 2). In transmission mode UV laser ablation, most of the mass is removed as large particles with diameters greater than 10 μm (similar to reflection mode IR ablation), which is attributed to the lower layers of the film vaporizing and ejecting large pieces of the material above by spallation.47
It is interesting to compare IR ablation of the liquid glycerol matrix with IR ablation of tissue. Ablation of glycerol produces 100 nm particles at low energies and particles 100 to 600 nm in diameter at higher laser fluences.47 IR ablation of tissue does not produce an appreciable number of 100 to 600 nm diameter particles even at higher fluences. The production of coarse particles is similar, although higher fluences are needed to produce large particles from tissue compared to glycerol. This is consistent with studies of tissue ablation that suggest that the mechanical strength of the tissue inhibits tissue fracture and the ejection of large particles.42,51,52 At low fluences, rapid boiling of the water in the tissue leads to the desorption of molecules and small clusters but only at higher fluences where the energy is sufficient to overcome the mechanical strength of the tissue for the removal of large particles. Co-desorption of volatile low molecular weight compounds may occur due to the local increase of temperature at the irradiation spot, which may surpass 300 °C.53
The observation of small clusters ejected at low fluences and large chunks of material at higher fluences in ablation of tissue has implications for the various modes of ionization that rely on different types of materials ejected. For example, MALDI imaging of tissue is typically performed using an ultraviolet laser and a crystalline matrix that is dropped or sprayed onto the tissue section.5,6 In this case, the ablated particle size is likely influenced by the properties of the crystalline matrix rather than the properties of the tissue. Irradiation of matrix compounds in reflection mode with a UV laser tends to produce overall smaller particulate44 compared to IR laser ablation of either matrix compounds or tissue. These small particles formed by the UV laser may be more conducive to ion formation compared to larger particulate formed by the IR laser. On the other hand, approaches aimed at improving spatial resolution of MALDI imaging have used transmission mode with a high numerical aperture lens and small laser spot.54,55 Transmission mode UV laser ablation tends to produce large particles49 that may not lead to the highest efficiency ionization.
Atmospheric pressure MALDI imaging has been performed with both IR16,56,57 as well as UV lasers.58 This mode of ionization relies on the ejection of free molecules, ions, or small clusters that form ions in the ablation plume.12,13 Ambient infrared laser desorption coupled with electrospray post-ionization29,30,59 relies on the interaction of ablated molecules and small clusters with the small highly-charged particles of the electrospray. Laser ablation electrospray ionization (LAESI) using infrared laser ablation of tissue is efficient at relatively lower laser fluences,56,60 which is consistent with our observation that nanoparticles are favored at low fluences. Other studies of IR matrix-assisted laser desorption electrospray ionization found that ablation of large particulate at high energies does not result in the efficient production of ions.61 Ambient laser ablation coupled with chemical34,35 or discharge ionization36 relies on the desorption of molecules for ionization and the removal of material as large particles will be of limited utility for ion formation with these methods. Inductively coupled plasma mass spectrometry imaging with laser ablation can be used in untargeted37,38 as well as targeted imaging modes.62 Inductively coupled plasma ionization has the capability to efficiently atomize and ionize compounds in particles with diameters less than approximately 150 nm in diameter,63,64 thus the amount of material ablated as small compared to large particulate is an important consideration and suggests that the most efficient performance will be at the low energies that favor nanoparticle production.
In contrast to the direct ionization methods, laser ionization methods that decouple the collection of the ablated material and ionization have the potential to extract material from the ablated large particles to a greater degree. Infrared,40,65–67 visible,68 and UV lasers68–70 have been used to ablate material that is then extracted and sent to an electrospray ionization source. Laser ablation sample transfer methods typically use high fluences to transfer material. This is consistent with the observation of higher mass transfer at higher energies even though it is contained in micrometer-sized particulate. Higher energies will produce greater mass transfer provided that the resulting large particulate does not limit the ability to extract and ionize the component biological molecules.
Conclusions
Particle size measurements were made for ablation of tissue under ambient conditions comparable to those used for mass spectrometry imaging of tissue sections. Ablation of tissue at laser fluences from 7 to 21 kJ m−2 produces a large number of nanoparticles with diameters less than 100 nm and a large mass of microparticles with diameters greater than 1 μm. The micrometer sized particles are predominant at the higher laser fluences and the nanoparticles are predominant at lower laser fluences. These results are consistent with previous studies suggesting that the mechanical structure of tissue limits the ejection of large particulate at lower fluences. These results have implications for ambient ionization methods that rely on desorption or ablation of small molecules and nanoparticles for direct ionization or immediate post-ionization. The ambient ionization methods will be most efficient at lower laser fluences at which the majority of the material is removed at small particles. On the other hand, ionization methods based on the capture and subsequent extraction before ionization favor higher laser fluences that produce more efficient material removal as large particles.Acknowledgements
This work was supported by the National Science Foundation (Grant CHE-1152106). The authors thank Dr D. Baker (LSU School of Veterinary Medicine) for providing rat brain and lung samples and Dr H. Hale-Donze (LSU Department of Biological Science) for assistance with tissue microtome sectioning.References
- K. Chughtai and R. M. Heeren, Chem. Rev., 2010, 110, 3237–3277 CrossRef CAS PubMed.
- J. L. Norris and R. M. Caprioli, Chem. Rev., 2013, 113, 2309–2342 CrossRef CAS PubMed.
- B. Spengler, Anal. Chem., 2015, 87, 64–82 CrossRef CAS PubMed.
- R. M. A. Heeren, Int. J. Mass Spectrom., 2015, 377, 672–680 CrossRef CAS.
- J. L. Norris and R. M. Caprioli, Chem. Rev., 2013, 113, 2309–2342 CrossRef CAS PubMed.
- M. M. Gessel, J. L. Norris and R. M. Caprioli, J. Proteomics, 2014, 107, 71–82 CrossRef CAS PubMed.
- R. Honig, Philos. Mag., 1985, 20, 752–767 Search PubMed.
- L. McDonnell and R. M. Heeren, Mass Spectrom. Rev., 2007, 26, 606–643 CrossRef CAS PubMed.
- S. S. Rubakhin and J. V. Sweedler, Methods Mol. Biol., 2010, 656, 21–49 CAS.
- E. R. Amstalden van Hove, D. F. Smith and R. M. A. Heeren, J. Chromatogr. A, 2010, 1217, 3946–3954 CrossRef CAS PubMed.
- C. Fenselau and R. J. Cotter, Chem. Rev., 1987, 87, 501–512 CrossRef CAS.
- M. Karas and R. Krüger, Chem. Rev., 2003, 103, 427–440 CrossRef CAS PubMed.
- R. Knochenmuss, Analyst, 2006, 131, 966–986 RSC.
- V. V. Laiko, M. A. Baldwin and A. L. Burlingame, Anal. Chem., 2000, 72, 652–657 CrossRef CAS PubMed.
- V. V. Laiko, N. I. Taranenko, V. D. Berkout, M. A. Yakshin, C. R. Prasad, H. S. Lee and V. M. Doroshenko, J. Am. Soc. Mass Spectrom., 2002, 13, 354–361 CrossRef CAS PubMed.
- Y. Li, B. Shrestha and A. Vertes, Anal. Chem., 2007, 79, 523–532 CrossRef CAS PubMed.
- A. Römpp, J.-P. Both, A. Brunelle, R. M. A. Heeren, O. Laprévote, B. Prideaux, A. Seyer, B. Spengler, M. Stoeckli and D. F. Smith, Anal. Bioanal. Chem., 2015, 407, 2329–2335 CrossRef PubMed.
- R. G. Cooks, Z. Ouyang, Z. Takats and J. Wiseman, Science, 2006, 311, 1566–1570 CrossRef CAS PubMed.
- Z. Takats, J. M. Wiseman, B. Gologan and R. G. Cooks, Science, 2004, 306, 471–473 CrossRef CAS PubMed.
- R. B. Cody, J. A. Laramee and H. D. Durst, Anal. Chem., 2005, 77, 2297–2302 CrossRef CAS PubMed.
- A. L. Gray, Analyst, 1985, 110, 551–556 RSC.
- R. E. Russo, X. Mao, H. Liu, J. Gonzalez and S. Mao, Talanta, 2002, 57, 425–451 CrossRef CAS PubMed.
- R. E. Russo, X. Mao, J. J. Gonzalez, V. Zorba and J. Yoo, Anal. Chem., 2013, 85, 6162–6177 CrossRef CAS PubMed.
- J. J. Coon, K. J. McHale and W. W. Harrison, Rapid Commun. Mass Spectrom., 2002, 16, 681–685 CrossRef CAS PubMed.
- L. Nyadong, A. S. Galhena and F. M. Fernandez, Anal. Chem., 2009, 81, 7788–7794 CrossRef CAS PubMed.
- A. Vaikkinen, B. Shrestha, T. J. Kauppila, A. Vertes and R. Kostiainen, Anal. Chem., 2012, 84, 1630–1636 CrossRef CAS PubMed.
- J. Shiea, M.-Z. Huang, H.-J. Hsu, C.-Y. Lee, C.-H. Yuan, I. Beech and J. Sunner, Rapid Commun. Mass Spectrom., 2005, 19, 3701–3704 CrossRef CAS PubMed.
- J. Sampson, A. M. Hawkridge and D. C. Muddiman, J. Am. Soc. Mass Spectrom., 2006, 17, 1712–1716 CrossRef CAS PubMed.
- P. Nemes and A. Vertes, Anal. Chem., 2007, 79, 8098–8106 CrossRef CAS PubMed.
- Y. H. Rezenom, J. Dong and K. K. Murray, Analyst, 2008, 133, 226–232 RSC.
- J. J. Brady, E. J. Judge and R. J. Levis, Rapid Commun. Mass Spectrom., 2009, 23, 3151–3157 CrossRef CAS PubMed.
- B. Shrestha and A. Vertes, Anal. Chem., 2009, 81, 8265–8271 CrossRef CAS PubMed.
- P. Nemes and A. Vertes, Methods Mol. Biol., 2010, 656, 159–171 CAS.
- A. S. Galhena, G. A. Harris, L. Nyadong, K. K. Murray and F. M. Fernandez, Anal. Chem., 2010, 82, 2178–2181 CrossRef CAS PubMed.
- B. Feng, J. Zhang, C. Chang, L. Li, M. Li, X. Xiong, C. Guo, F. Tang, Y. Bai and H. Liu, Anal. Chem., 2014, 86, 4164–4169 CrossRef CAS PubMed.
- J. T. Shelley, S. J. Ray and G. M. Hieftje, Anal. Chem., 2008, 80, 8308–8313 CrossRef CAS PubMed.
- J. Becker, J. Mass Spectrom., 2013, 48, 255–268 CrossRef PubMed.
- J. Becker, A. Matusch and B. Wu, Anal. Chim. Acta, 2014, 835, 1–18 CrossRef CAS PubMed.
- D. J. Hare, E. J. New, M. D. de Jonge and G. McColl, Chem. Soc. Rev., 2015, 44, 5941–5958 RSC.
- S.-G. Park and K. K. Murray, J. Am. Soc. Mass Spectrom., 2011, 22, 1352–1362 CrossRef CAS PubMed.
- S.-G. Park and K. K. Murray, Anal. Chem., 2012, 84, 3240–3245 CrossRef CAS PubMed.
- A. Vogel and V. Venugopalan, Chem. Rev., 2003, 103, 577–644 CrossRef CAS PubMed.
- I. Apitz and A. Vogel, Appl. Phys. A, 2005, 81, 329–338 CrossRef CAS.
- T. Musapelo and K. K. Murray, Anal. Chem., 2011, 83, 6601–6608 CrossRef CAS PubMed.
- C. N. McEwen, V. S. Pagnotti, E. D. Inutan and S. Trimpin, Anal. Chem., 2010, 82, 9164–9168 CrossRef CAS PubMed.
- T. Musapelo and K. K. Murray, Rapid Commun. Mass Spectrom., 2013, 27, 1283–1286 CrossRef CAS PubMed.
- T. Musapelo and K. K. Murray, J. Mass Spectrom., 2014, 49, 543–549 CrossRef CAS PubMed.
- G. M. Hale and M. R. Querry, Appl. Opt., 1973, 12, 555–563 CrossRef CAS PubMed.
- T. Musapelo and K. Murray, J. Am. Soc. Mass Spectrom., 2013, 24, 1108–1115 CrossRef CAS PubMed.
- S. N. Jackson, S. Mishra and K. K. Murray, J. Phys. Chem. B, 2003, 107, 13106–13110 CrossRef CAS.
- V. Venugopalan, N. S. Nishioka and B. B. Mikić, Biophys. J., 1996, 70, 2981–2993 CrossRef CAS PubMed.
- A. A. Oraevsky, S. L. Jacques, R. O. Esenaliev and F. K. Tittel, Lasers Surg. Med., 1996, 18, 231–240 CrossRef CAS PubMed.
- K. Nahen and A. Vogel, J. Biomed. Opt., 2002, 7, 165–178 CrossRef PubMed.
- A. Zavalin, E. M. Todd, P. D. Rawhouser, J. Yang, J. L. Norris and R. M. Caprioli, J. Mass Spectrom., 2012, 47, 1473–1481 CrossRef PubMed.
- A. Zavalin, J. Yang, K. Hayden, M. Vestal and R. M. Caprioli, Anal. Bioanal. Chem., 2015, 407, 2337–2342 CrossRef CAS PubMed.
- Y. Li, B. Shrestha and A. Vertes, Anal. Chem., 2008, 80, 407–420 CrossRef CAS PubMed.
- A. Römpp, K. C. Schäfer, S. Guenther, Z. Wang, M. Köstler, A. Leisner, C. Paschke, T. Schramm and B. Spengler, Anal. Bioanal. Chem., 2013, 405, 6959–6968 CrossRef PubMed.
- S. Guenther, A. Römpp, W. Kummer and B. Spengler, Int. J. Mass Spectrom., 2011, 305, 228–237 CrossRef CAS.
- J. S. Sampson, K. K. Murray and D. C. Muddiman, J. Am. Soc. Mass Spectrom., 2009, 20, 667–673 CrossRef CAS PubMed.
- P. Nemes, A. A. Barton, Y. Li and A. Vertes, Anal. Chem., 2008, 80, 4575–4582 CrossRef CAS PubMed.
- G. Robichaud, J. A. Barry and D. C. Muddiman, J. Am. Soc. Mass Spectrom., 2014, 25, 319–328 CrossRef CAS PubMed.
- S. Di Palma and B. Bodenmiller, Curr. Opin. Biotechnol., 2015, 31, 122–129 CrossRef CAS PubMed.
- H.-R. Kuhn, M. Guillong and D. Günther, Anal. Bioanal. Chem., 2004, 378, 1069–1074 CrossRef CAS PubMed.
- Z. Wang, B. Hattendorf and D. Günther, J. Am. Soc. Mass Spectrom., 2006, 17, 641–651 CrossRef CAS PubMed.
- S.-G. Park and K. K. Murray, J. Mass Spectrom., 2012, 47, 1322–1326 CrossRef CAS PubMed.
- S.-G. Park and K. K. Murray, Rapid Commun. Mass Spectrom., 2013, 27, 1673–1680 CrossRef CAS PubMed.
- F. Donnarumma, F. Cao and K. K. Murray, J. Am. Soc. Mass Spectrom. DOI:10.1007/s13361-015-1249-0.
- O. S. Ovchinnikova, V. Kertesz and G. J. Van Berkel, Anal. Chem., 2011, 83, 1874–1878 CrossRef CAS PubMed.
- O. S. Ovchinnikova, V. Kertesz and G. J. Van Berkel, Rapid Commun. Mass Spectrom., 2011, 25, 3735–3740 CrossRef CAS PubMed.
- M. Lorenz, O. S. Ovchinnikova and G. J. Van Berkel, Rapid Commun. Mass Spectrom., 2014, 28, 1312–1320 CrossRef CAS PubMed.
Footnote |
| † Electronic supplementary information (ESI) available. See DOI: 10.1039/c5an01765c |
| This journal is © The Royal Society of Chemistry 2016 |

