A biosensor based on gold nanoparticles stabilized in poly(allylamine hydrochloride) and decorated with laccase for determination of dopamine
Tânia Regina
Silva
and
Iolanda Cruz
Vieira
*
Department of Chemistry, Federal University of Santa Catarina, 88040-900, Florianópolis, SC, Brazil. E-mail: iolanda.vieira@ufsc.br; Fax: +55 48 3721 6850; Tel: +55 48 3721 3616
First published on 30th October 2015
Abstract
Gold nanoparticles stabilized in poly(allylamine hydrochloride) (AuNP-PAH) were used as a support for the immobilization of the enzyme laccase obtained from genetically-modified microorganisms (Aspergillus oryzae) and successfully applied in the development of a new biosensor for the determination of dopamine by square-wave voltammetry. The electrochemical characterization of the biosensor was performed by cyclic voltammetry and electrochemical impedance spectroscopy and indicated that the nanomaterial used for the electrode modification facilitated the electron transfer. Under optimized conditions, the calibration curve showed a linear range for dopamine from 0.49 to 23.0 μmol L−1, with a limit of detection of 0.26 μmol L−1. The biosensor demonstrated suitable selectivity and stability, good intra-day and inter-day repeatability and electrode-to-electrode repeatability, with relative standard deviations of 4.95, 4.85 and 4.21%, respectively. The proposed biosensor was successfully applied to the determination of dopamine in pharmaceutical samples and the results were in agreement with those obtained using a spectrophotometric method. The recoveries of 97.6 to 105.5% obtained for the samples demonstrate that the proposed method is suitable for practical applications. The good analytical performance of the proposed method can be attributed to the efficient immobilization of laccase in the nanomaterial and the facilitation of electron transfer between the protein and the electrode surface due to the presence of the Au nanoparticles and the PAH polymer.
1. Introduction
In recent years, considerable attention has been given to the application of nanostructured materials, such as metallic nanoparticles, in biosensing systems.1,2 This is because these promising materials present unique properties, such as a highly active surface area, catalytic activity, chemical stability and good conductivity, which make them useful in the development of new biosensors.3–5 In this context, gold nanoparticles (AuNPs) are notable due to their biocompatibility and low cytotoxicity, providing an efficient platform for the immobilization of biomolecules, such as oxidoreductase enzymes (e.g., laccase), preserving their structure and also facilitating electron transfer between the enzymes and the electrode.1,2,6–9Laccases (LACs) belong to a family of multicopper-oxidase enzymes and they occur widely in fungi, plants and bacteria. These enzymes act mainly in the catalytic process of phenolic compound oxidation with the concomitant reduction of oxygen to water.10–16 Due to this oxidation ability, this enzyme is often used in the construction of biosensors for the quantification of phenolic compounds, such as dopamine.12–20
Dopamine, 3,4-dihydroxyphenyl ethylamine, is a neurotransmitter of great importance for the nervous system because it is involved in motor control, endocrine function, reward, emotion and cognition.21–24 Dysregulation of dopaminergic neurotransmission is associated with attention deficit hyperactivity disorder, mood disorders, schizophrenia and neurodegenerative diseases such as Parkinson and Alzheimer. Thus, the determination of this neurotransmitter is important for diagnosis, monitoring, and pharmacological intervention.24–28 Numerous methods have been used for the detection of dopamine in pharmaceutical samples and biological fluids including spectrophotometry,21,25,29 chromatography,22,30–35 chemiluminescence,36 capillary electrophoresis37,38 and electrochemical methods.35–40 However, these methods generally involve a time-consuming sample pre-treatment step and long analysis times and are relatively expensive. Thus, the development of electrochemical biosensors has proven to be an attractive alternative for the determination of dopamine due to their fast detection, low cost and low detection limits with good accuracy.39–45
In this study, gold nanoparticles stabilized in poly(allylamine hydrochloride) (AuNP-PAH) were used as a support for the immobilization of the enzyme laccase (LAC) obtained from genetically-modified microorganisms (Aspergillus oryzae) and successfully applied in the development of a new biosensor for the determination of dopamine. Various characterization studies were performed and the influence of experimental conditions was investigated to obtain the best performance for the proposed biosensor. The optimized method was then applied to determine dopamine in pharmaceutical samples by square-wave voltammetry (SWV).
2. Experimental
2.1. Reagents, solutions and samples
All reagents were of analytical grade and used without further purification, and all aqueous solutions were prepared in ultrapure water, obtained from a Milli-Q system (Millipore, USA), with a resistivity of 18.2 MΩ cm−1. LAC was purchased from Novozymes (Denmark), under the trade name Denilite II BASE, produced by genetically-modified microorganisms (Aspergillus oryzae). Poly(allylamine hydrochloride) (PAH, MW ≈ 58![[thin space (1/6-em)]](https://www.rsc.org/images/entities/char_2009.gif) 000), chloroauric acid (HAuCl4), sodium borohydride (NaBH4), 2,2′-azino-bis-(3-ethylbenzothiazoline-6-sulphonic acid) (ABTS), potassium ferricyanide (K3[Fe(CN)6]), potassium ferrocyanide (K4[Fe(CN)6]), ascorbic acid, citric acid, levodopa, carbidopa, epinephrine and dopamine were obtained from Sigma-Aldrich. A dopamine standard solution was prepared daily in water. Reference solutions were prepared from stock solutions by appropriate dilution. Acetate buffer solutions (0.1 mol L−1, pH 4.0–5.0) and phosphate buffer solutions (0.1 mol L−1, pH 6.0–8.0) were used as the supporting electrolytes in the optimization of the method and in the electrochemical determination of dopamine. Acheson 38 graphite powder (Fischer) and a mineral oil (Sigma-Aldrich) of high purity were used in the preparation of the carbon paste. Samples of dopamine hydrochloride injection (5 mg mL−1) of different brands (denoted herein as A and B) were supplied by the University Hospital of the Federal University of Santa Catarina (Santa Catarina, Brazil).
000), chloroauric acid (HAuCl4), sodium borohydride (NaBH4), 2,2′-azino-bis-(3-ethylbenzothiazoline-6-sulphonic acid) (ABTS), potassium ferricyanide (K3[Fe(CN)6]), potassium ferrocyanide (K4[Fe(CN)6]), ascorbic acid, citric acid, levodopa, carbidopa, epinephrine and dopamine were obtained from Sigma-Aldrich. A dopamine standard solution was prepared daily in water. Reference solutions were prepared from stock solutions by appropriate dilution. Acetate buffer solutions (0.1 mol L−1, pH 4.0–5.0) and phosphate buffer solutions (0.1 mol L−1, pH 6.0–8.0) were used as the supporting electrolytes in the optimization of the method and in the electrochemical determination of dopamine. Acheson 38 graphite powder (Fischer) and a mineral oil (Sigma-Aldrich) of high purity were used in the preparation of the carbon paste. Samples of dopamine hydrochloride injection (5 mg mL−1) of different brands (denoted herein as A and B) were supplied by the University Hospital of the Federal University of Santa Catarina (Santa Catarina, Brazil).
2.2. Instrumentation and electrodes
Square-wave voltammetry (SWV) and cyclic voltammetry (CV) analyses were performed on an Autolab PGSTAT101 potentiostat/galvanostat (Eco Chemie, The Netherlands), operating with data processing software (NOVA, version 1.10). Electrochemical impedance spectroscopy (EIS) analysis was performed on an Autolab PGSTAT128N potentiostat/galvanostat (Eco Chemie, The Netherlands) with an FRA impedance module. All voltammetry experiments were carried out using a conventional three-electrode system: the proposed biosensor as the working electrode, a platinum plate as the auxiliary electrode and Ag/AgCl (3.0 mol L−1 KCl) as the reference electrode.Transmission electron microscopy (TEM) analysis was performed with a JEOL JEM-1011 transmission electron microscope operating at 100 keV. The micrographs were obtained from the Central Laboratory of Electron Microscopy at the Federal University of Santa Catarina (Florianópolis, Brazil). Spectrophotometric measurements were taken on a Cary 60 UV-Vis spectrometer (Agilent Technologies, USA).
2.3. Synthesis and characterization of AuNP-PAH and AuNP-PAH–LAC
AuNP-PAH was synthesized and characterized according to the procedure described by Silva et al. (2015).45 After synthesis, the AuNP-PAH dispersion was pre-concentrated 10 times for use in the immobilization of the enzyme, which was performed by mixing the enzyme solution with the dispersion of AuNP-PAH (ratio 1![[thin space (1/6-em)]](https://www.rsc.org/images/entities/char_2009.gif) :
:![[thin space (1/6-em)]](https://www.rsc.org/images/entities/char_2009.gif) 1, v/v), and was accompanied by a color change from red to purple. AuNP-PAH–LAC was used in the construction of the proposed biosensor. This nanomaterial was characterized by spectrophotometry and TEM analysis. The samples were prepared for the TEM analysis by depositing dispersions onto a carbon-coated copper grid. The grids were placed on filter paper to remove the excess material and allowed to dry in a desiccator. The average particle size was determined by counting approximately 300 particles using ImageJ software.46
1, v/v), and was accompanied by a color change from red to purple. AuNP-PAH–LAC was used in the construction of the proposed biosensor. This nanomaterial was characterized by spectrophotometry and TEM analysis. The samples were prepared for the TEM analysis by depositing dispersions onto a carbon-coated copper grid. The grids were placed on filter paper to remove the excess material and allowed to dry in a desiccator. The average particle size was determined by counting approximately 300 particles using ImageJ software.46
2.4. Obtainment of the LAC solution and measurement of activity
The solution of the LAC enzyme was obtained with the following methodology: 5.0 g of Denilite BASE II microcapsules were weighed and macerated for 30 min in a mortar. This material was transferred to a beaker containing 50.0 mL of acetate buffer (0.1 mol L−1, pH 5.0) and left under magnetic stirring for 25 min at room temperature (25 °C). The mixture was then filtered with fluted filter paper (porosity 14.0 mM) and stored in an amber vial under refrigeration at low temperatures (4 °C) to preserve the enzymatic activity.One unit of laccase activity is defined as the amount of enzyme which oxidizes 1 μmol substrate per min. The enzymatic activity of LAC was determined in triplicate by spectrophotometry. The measurements were taken as the absorbance at 420 nm of the product formed in the reaction between 2.8 mL of 0.05 mol L−1 ABTS solution and 0.2 mL of LAC in 0.1 mol L−1 acetate buffer (pH 5.0) at 25 °C.47,48
2.5. Biosensor preparation
The proposed biosensor is based on the modification of a carbon paste electrode (CPE), constructed as follows: first, 50 μL of AuNP-PAH–LAC were mixed (1![[thin space (1/6-em)]](https://www.rsc.org/images/entities/char_2009.gif) :
:![[thin space (1/6-em)]](https://www.rsc.org/images/entities/char_2009.gif) 1, v/v) with 150 mg of graphite for the adsorption of the nanomaterial. This material was left on a desiccator under vacuum for 30 min for drying. In the next step, 50 mg of mineral oil were added followed by mixing in a small mortar for 10 min to form a homogeneous mixture. The modified paste was then tightly packed into a plastic syringe (1.0 mm internal diameter) and a copper wire was inserted to establish the external electrical contact. The biosensor obtained was stored at room temperature when not in use. Other sensors (CPE unmodified, PAH/CPE, AuNP-PAH/CPE and CPE modified with free LAC) were constructed similarly to the AuNP-PAH–LAC/CPE biosensor, to evaluate the contribution of each modifier employed in this study.
1, v/v) with 150 mg of graphite for the adsorption of the nanomaterial. This material was left on a desiccator under vacuum for 30 min for drying. In the next step, 50 mg of mineral oil were added followed by mixing in a small mortar for 10 min to form a homogeneous mixture. The modified paste was then tightly packed into a plastic syringe (1.0 mm internal diameter) and a copper wire was inserted to establish the external electrical contact. The biosensor obtained was stored at room temperature when not in use. Other sensors (CPE unmodified, PAH/CPE, AuNP-PAH/CPE and CPE modified with free LAC) were constructed similarly to the AuNP-PAH–LAC/CPE biosensor, to evaluate the contribution of each modifier employed in this study.
2.6. Electrochemical measurements
The voltammetry experiments were carried out at room temperature (≈25 °C) in an electrochemical cell containing 10.0 mL of phosphate buffer (0.1 mol L−1, pH 6.0) and the required volume of the analyte (standard solution or dopamine sample). The SWV measurements were performed scanning the potential from +0.4 to −0.1 V at a frequency of 10 Hz, a pulse amplitude of 60 mV and a scan increment of 5 mV, after successive additions of the analyte. All potential measurements are reported vs. Ag/AgCl (3.0 mol L−1 KCl) and a stirring time of 60 s was used to homogenize the solutions. The peak currents obtained in the electrochemical reduction of dopamine on the proposed biosensor surface are proportional to the dopamine concentrations in solution, and were used for the determination of this analyte.2.7. Preparation of pharmaceutical samples and determination of dopamine
Samples of dopamine hydrochloride injection (A and B) were supplied by the University Hospital of the Federal University of Santa Catarina (Santa Catarina, Brazil) and applied in the determination of dopamine using the proposed biosensor and a reference method (United States Pharmacopoeia).49The standard addition method was used for the determination of dopamine using the biosensor. Aliquots of the samples previously prepared and diluted were transferred to an electrochemical cell containing a supporting electrolyte (phosphate buffer 0.1 mol L−1; pH 6.0) and the dopamine content was quantified, using SWV, after successive additions of a standard solution of dopamine. All measurements were performed in triplicate and the quantification was based on the resulting currents (at a potential of approximately +0.17 V vs. Ag/AgCl), using the optimized parameters (frequency of 10 Hz, amplitude of 60 mV and increment of 5 mV). For comparison purposes, the samples were also analyzed, in triplicate, by a standard (spectrophotometric) method for dopamine determination recommended in the United States Pharmacopoeia.49
3. Results and discussion
3.1. Characterization of AuNP-PAH and AuNP-PAH–LAC
The characterization of the AuNP-PAH and AuNP-PAH–LAC samples was performed by TEM analysis. The TEM micrograph (Fig. 1A) reveals that the NPs are roughly spherical and the dispersion in the grid shows no signs of aggregation. The average diameter of the AuNP-PAH particles was estimated as approximately 17.8 ± 0.3 nm, from ensembles of 300 particles found in arbitrarily chosen areas of the enlarged TEM micrographs. On the other hand, the TEM of AuNP-PAH–LAC (Fig. 1B) shows aggregations (diameter approximately 57.4 ± 0.2 nm) of the NPs in the presence of the enzyme. This increase in particle size can be attributed to strong electrostatic interactions between the positively charged polyelectrolyte PAH (pKa ∼ 8–9) on the surface of the nanoparticle and the anionic LAC (pI < 4)50 under the conditions used for the immobilization (pH ≈ 6.0). This hypothesis is supported by the positive zeta potential (56.5 ± 2.1 mV; n = 3) found for AuNP-PAH and is corroborated by the fact that the activity of the bound enzyme is not completely lost. The histograms show the size distributions of the particles obtained, which can be reasonably well fitted by a Gaussian curve. Other data for the characterization of the nanoparticles, such as UV-Vis spectrometry measurements and zeta potential values, have been reported by Silva et al. (2015).45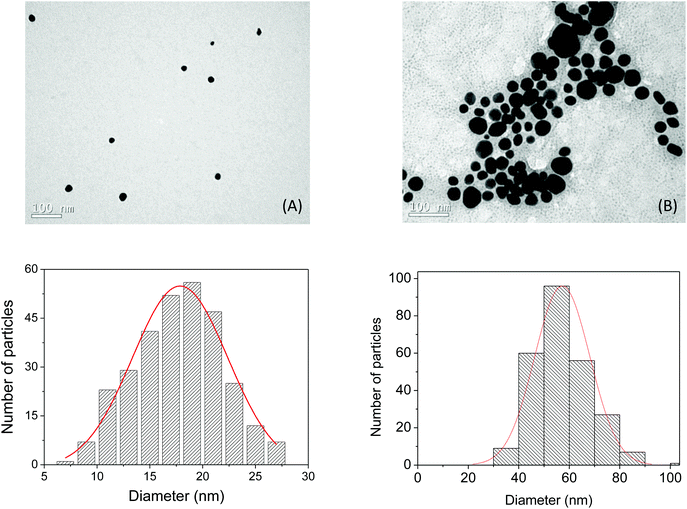 | ||
| Fig. 1 (A) TEM micrograph of the AuNP-PAH. (B) TEM micrograph of the AuNP-PAH–LAC. Insert: particle size histogram based on approximately 300 particles. | ||
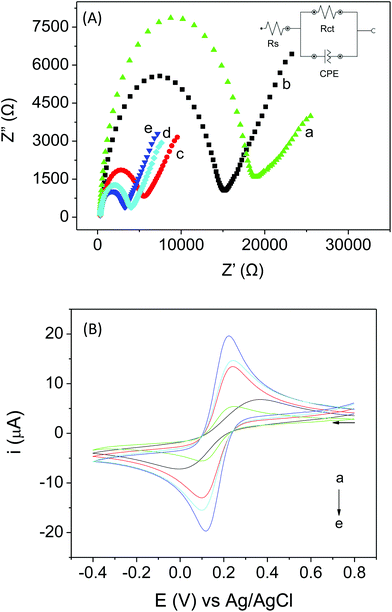
3.2. Electrochemical characterization of AuNP-PAH–LAC/CPE
The electrochemical characterization of the proposed biosensor was performed by EIS and CV. EIS was employed to investigate the impedance changes caused by the presence of different modifiers on the electrode surface. This technique aids the evaluation of the properties of the modified electrode interface, especially with respect to the electron transfer kinetics. In the Nyquist diagrams, the charge transfer resistance (Rct) corresponds to the semicircular part and can be calculated from the diameter of the semicircle, while the linear part represents the diffusion processes. The smaller the Rct, the better will be the transfer of the charge and the better the control of the electron transfer kinetics at the biosensor interface will be.51,52Fig. 2A shows the electrochemical impedance spectra obtained using the different sensors in the presence of a redox probe [Fe(CN)6]3−/4−. It can be observed that only the addition of protein to the electrode (free LAC/CPE) causes an increase in Rct (18.8 kΩ) compared to the unmodified CPE (Rct 15.1 kΩ), as expected because, in general, macromolecules can block the surfaces of the electrodes. One can also observe that the presence of AuNP-PAH in the electrode caused a significant decrease in Rct (3.05 kΩ), due to the high conductivity of the metal NPs. The presence of an immobilized enzyme in the material (AuNP-PAH–LAC) caused a small increase in Rct (3.74 kΩ) compared to the AuNP-PAH/CPE, as expected; however, the Rct was much lower compared with the bare CPE and free LAC/CPE, due to the presence of the nanomaterial. A fast electron transfer was observed for AuNP-PAH–LAC/CPE, indicating that the nanomaterial (AuNP-PAH) employed for the immobilization of LAC can facilitate the charge transfer process. The sensor containing only PAH also decreased the Rct (5.02 kΩ), since this polymer has high conductivity due to the presence of charges in its structure.
Fig. 2B shows the cyclic voltammograms obtained using different sensors in 0.1 mol L−1 KCl solution containing 5 mmol L−1 Fe(CN)63−/4− at a scan rate of 40 mV s−1. A pair of well-defined redox peaks related to Fe(CN)63−/4− can be observed by employing the electrodes (c) PAH/CPE, (d) AuNP-PAH–LAC/CPE and (e) AuNP-PAH/CPE. An increase in the peak currents and a decrease in the distance between the peak potentials (ΔEp) were observed for these electrodes, indicating that the electron transfer reaction was kinetically and thermodynamically favored, reinforcing the results obtained by EIS. It was also observed that the AuNP-PAH/CPE has a higher peak current in the Fe(CN)63−/4− system compared with the proposed biosensor. This is because the laccase enzyme present in AuNP-PAH–LAC/CPE can catalyze redox reactions involving phenolic compounds and thus it does not contribute to the electron transfer kinetics in this case.
3.3. Study on the contribution of the modifiers used in the biosensor construction
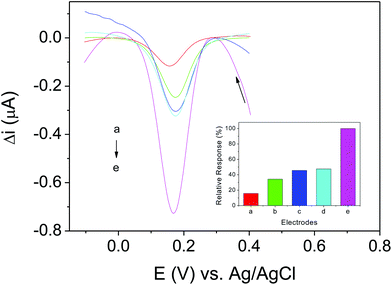
Different sensors were prepared to assess the contribution of each modifier employed in this study. The sensors investigated were: (a) CPE, (b) PAH/CPE, (c) free LAC/CPE (d) AuNP-PAH/CPE and (e) AuNP-PAH–LAC/CPE (proposed biosensor). Fig. 3 shows the square-wave voltammograms obtained using each electrode in phosphate buffer solution (0.1 mol L−1, pH 6.0) containing 19.6 μmol L−1 of dopamine.As can be seen, all electrodes showed higher responses than the bare CPE. The presence of PAH in sensor (b) increased, by almost 2-fold, the current peak for dopamine in relation to CPE (electrode (a)), and it promotes a pre-concentration of the analyte on the electrode surface, possibly due to hydrogen interactions between the amino groups of the polymer and hydroxyl groups of the dopamine molecule. The presence of LAC in electrode (c) causes an increase in the current peak for dopamine, which was almost 3 times greater than that for CPE. This can be explained by the enzyme acting as a catalyst in the oxidation of phenolic compounds. The presence of AuNP-PAH (electrode (d)) led to a current gain approximately equal to that of the electrode containing the free enzyme. This could be attributed to the high conductivity and catalytic properties of the AuNPs. The highest response (almost 7 times greater than that for the CPE) was obtained using a combination of the LAC enzyme immobilized in an AuNP-PAH support in the biosensor construction (electrode (e)), confirming that the use of this material is highly promising. This can be attributed to the good immobilization of the enzyme by the nanomaterial, promoting a biocompatible microenvironment by increasing the stability, without affecting the enzymatic activity.
3.4. Principle of the proposed biosensor functioning
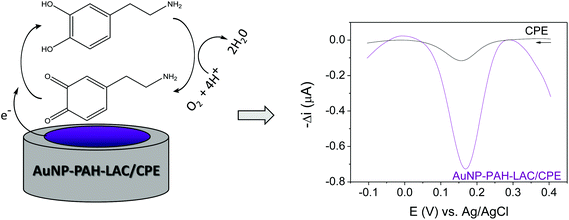
Fig. 4 shows the principle of the biosensor functioning. The proposed mechanism for the enzymatic immobilization is based on electrostatic interactions between the positively-charged PAH on the surfaces of the nanoparticles and the anionic LAC and, most importantly, the presence of AuNP improves the electron transfer between the electroactive center of LAC and the electrode surface. The nanomaterial also provides an appropriate environment for the immobilization on LAC without denaturation of this biomolecule.The principle of the enzymatic process on which the proposed sensing mechanism is based is shown schematically in Fig. 4. In this process, the dopamine in contact with LAC (immobilized on the AuNP-PAH), in the presence of molecular oxygen, is oxidized to its corresponding o-quinone. Subsequently, this quinone is electrochemically reduced on the biosensor surface at a potential of +0.17 V vs. Ag/AgCl. The resulting current obtained in the electrochemical reduction of o-quinone is proportional to the dopamine concentration and was used for the quantification of the analyte.
3.5. Effect of nature and pH of supporting electrolyte on the electrochemical behavior of dopamine
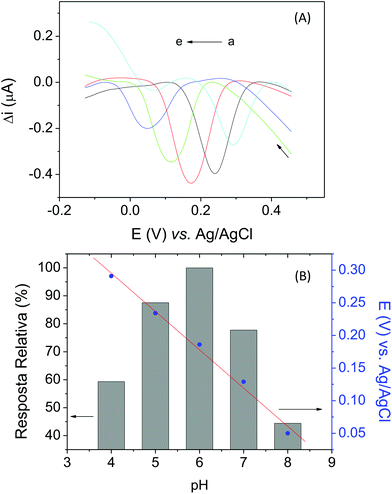
The choice of an appropriate supporting electrolyte and its pH are essential to obtaining good biosensor sensitivity, because these factors have a significant influence on the electrochemical behavior of dopamine, in terms of both the peak current and peak potential. After the optimization of the biosensor construction, the effect of the nature and the pH of the supporting electrolyte on the analytical response for dopamine was also investigated by SWV, using 0.1 mol L−1 phosphate buffer solutions within the pH range of 6.0 to 8.0 and 0.1 mol L−1 acetate buffer solutions at pH 4.0 and 5.0, containing 11.9 μmol L−1 of dopamine. Fig. 5A shows that the peak potential and current of dopamine are pH-dependent. According to the results, the highest peak current for dopamine was obtained with phosphate buffer at pH 6.0. Therefore, this pH value was used in all subsequent studies. In addition, Fig. 5B shows the linear relationship between the peak potential and the pH of the electrolyte support, according to the following equation: Epc = 0.530–0.0587 pH (r2 = 0.997). The reduction peak potential (Epc) of dopamine shifted in the negative direction with increasing pH, which indicates that protons were directly involved in the dopamine reduction process. The slope of 58.7 mV pH−1 indicates that the numbers of electrons and protons transferred in the electrochemical dopamine reaction were the same (according to Nernstian systems 59 mV n−1).53,543.6. Optimization of the biosensor construction and experimental conditions
In order to optimize the biosensor construction and the experimental conditions of the proposed method, some parameters were investigated in triplicate using SWV. Initially, the effect of the AuNP-PAH–LAC concentration was investigated in the range of 25.0 to 100.0 μL (1![[thin space (1/6-em)]](https://www.rsc.org/images/entities/char_2009.gif) :
:![[thin space (1/6-em)]](https://www.rsc.org/images/entities/char_2009.gif) 1, AuNP-PAH
1, AuNP-PAH![[thin space (1/6-em)]](https://www.rsc.org/images/entities/char_2009.gif) :
:![[thin space (1/6-em)]](https://www.rsc.org/images/entities/char_2009.gif) LAC) and the best analytic result was observed at 50.0 μL. This corresponds to 0.796 units of LAC (immobilized in AuNP-PAH) per electrode and this value was used for the construction of the biosensors.
LAC) and the best analytic result was observed at 50.0 μL. This corresponds to 0.796 units of LAC (immobilized in AuNP-PAH) per electrode and this value was used for the construction of the biosensors.
After the optimization of the biosensor construction, the SWV parameters were studied with the aim of obtaining better sensitivity and peak definition in the dopamine determination. The frequency (10–100 Hz), pulse amplitude (10–100 mV) and scan increment (1–10 mV) were investigated. The best analytical response was obtained with a frequency of 10 Hz, a pulse amplitude of 60 mV and a scan increment of 5 mV. Thus, these instrumental conditions were selected to improve the performance of the biosensor. The effect of the pH of the supporting electrolyte on the analytical response for dopamine was also investigated by SWV, using 0.1 mol L−1 acetate buffer (4.0 and 5.0) and phosphate buffer (pH range of 6.0 to 8.0). The highest peak current for dopamine was obtained at phosphate buffer pH 6.0, as previously observed by SWV.
3.7. Analytical performance of the biosensor
Table 1 shows a comparison of AuNP-PAH–LAC/CPE with other modified electrodes for dopamine determination, based on data recently published in the literature35–40 indicating that the proposed biosensor has one of the lowest LOD values.
| Electrode | Linear range (μmol L−1) | LOD (μmol L−1) | Ref. |
|---|---|---|---|
| HRP: horseradish peroxidase; MWCNTs: multiwalled carbon nanotubes; SiSG: silica sol–gel; Poly(Gly): polymerized film of glycine; RGO: reduced graphene oxide; CSHMs: chitosan/silica sol–gel hybrid membranes; GCE: glass carbon electrode; SiO2-PA: phytic acid functionalized silica; MAO: monoamine oxidase; PANI: polyaniline; CS: core–shell nanocomposites; IL: ionic liquid. | |||
| HRP-MWCNTs–SiSG/Poly(Gly)/CPE | 15–865 | 0.6 | 39 |
| RGO–AuNPs CSHMs/GCE | 1.0–200 | 0.3 | 40 |
| Laccase/SiO2-PA/GCE | 0.99–103.1 | 0.26 | 41 |
| MAO/GCE | 5–400 | 20.00 | 42 |
| AuNPs@PANI/CS/GCE | 10–1700 | 5.0 | 43 |
| IL-CPE | 1–800 | 0.7 | 44 |
| AuNP-PAH–LAC/CPE | 0.49–23.0 | 0.26 | This study |
![[thin space (1/6-em)]](https://www.rsc.org/images/entities/char_2009.gif) :
:![[thin space (1/6-em)]](https://www.rsc.org/images/entities/char_2009.gif) 1, 1
1, 1![[thin space (1/6-em)]](https://www.rsc.org/images/entities/char_2009.gif) :
:![[thin space (1/6-em)]](https://www.rsc.org/images/entities/char_2009.gif) 5 and 1
5 and 1![[thin space (1/6-em)]](https://www.rsc.org/images/entities/char_2009.gif) :
:![[thin space (1/6-em)]](https://www.rsc.org/images/entities/char_2009.gif) 10 ([dopamine]
10 ([dopamine]![[thin space (1/6-em)]](https://www.rsc.org/images/entities/char_2009.gif) :
:![[thin space (1/6-em)]](https://www.rsc.org/images/entities/char_2009.gif) [interferent]). The studies demonstrated that these substances do not interfere significantly in the performance of the sensor (signal change <10% for the highest concentrations). Therefore, this biosensor can be used for the determination of dopamine in the presence of these potentially interfering compounds without significant interference in the analytical response.
[interferent]). The studies demonstrated that these substances do not interfere significantly in the performance of the sensor (signal change <10% for the highest concentrations). Therefore, this biosensor can be used for the determination of dopamine in the presence of these potentially interfering compounds without significant interference in the analytical response.
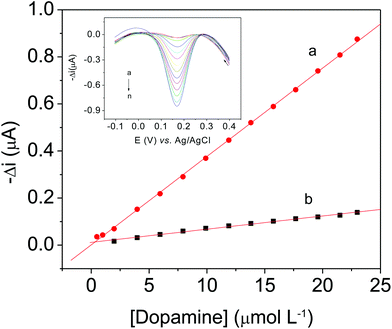
Intra-day and inter-day repeatability tests were carried out with AuNP-PAH–LAC/CPE using 19.6 and 9.9 μmol L−1 dopamine solutions, respectively, under optimized conditions. The relative standard deviation (RSD) values obtained for the intra-day and inter-day repeatability were 4.95% (n = 10) and 4.82% (n = 10), respectively, showing good accuracy for the measurements. In addition, the biosensor-to-biosensor repeatability was determined from the response of three biosensors prepared independently using the same procedure, in order to evaluate the biosensor construction process. This study was performed using a 9.9 μmol L−1 dopamine solution and applying the SWV technique, in triplicate, and an acceptable RSD (4.21%) was obtained. The storage stability of the proposed biosensor was also examined. It was found that after storage at 4 °C for 60 days the sensor retained 95.0% of its initial current response. These results are considered to be acceptable and can be attributed to the conservation of the enzymatic activity, due to the effective immobilization of LAC on a biocompatible support.
3.8. Analytical application of the proposed method
The proposed biosensor was applied in the determination of dopamine in two samples of dopamine hydrochloride injection (A and B). A recovery study and the determination were performed with the standard addition method, in triplicate, using these pharmaceutical samples. Four different dopamine solutions (2.9, 5.9, 8.8 and 10.8 μmol L−1) were used for each sample in the recovery studies. The percentage recovery values were calculated by comparing the added and recovered concentrations of the dopamine standard solution. The percent recovery obtained for these samples ranged from 97.6 to 105.5%, demonstrating the satisfactory accuracy of the proposed biosensor (Table 2).| Sample | Dopamine (μmol L−1) | Recoveryb (%) | |
|---|---|---|---|
| Added | Founda | ||
| a Mean ± standard deviation; n = 3. b Recovery = (mean found value/added value) × 100. | |||
| 2.9 | 2.9 ± 0.2 | 97.7 | |
| 5.9 | 6.1 ± 0.2 | 105.5 | |
| A | 8.8 | 8.7 ± 0.1 | 99.7 |
| 10.8 | 10.7 ± 0.2 | 98.3 | |
| 2.9 | 2.8 ± 0.1 | 97.6 | |
| B | 5.9 | 5.9 ± 0.2 | 100.6 |
| 8.8 | 8.7 ± 0.1 | 99.8 | |
| 10.8 | 10.8 ± 0.1 | 101.5 | |
In addition, to verify the efficiency of the proposed method these samples were also used in dopamine quantification applying the electroanalytical method developed and the standard method (spectrophotometry)49 for comparison purposes. The results for the dopamine quantification were compared with label values (shown in Table 3). For both pharmaceutical samples, the dopamine content determined using the biosensor is consistent with the content specified on the label, with a relative error of less than −1.4%, indicating that the proposed method is suitable for the determination of dopamine in pharmaceuticals.
4. Conclusions
The proposed electrochemical biosensor (AuNP-PAH–LAC/CPE) exhibited good analytical performance in the determination of dopamine, providing high sensitivity and a low LOD. The promising results obtained in this study suggest that the excellent analytical performance of the proposed method is due to the efficient immobilization of the LAC in the nanomaterial, and the facilitation of electron transfer between the protein and the electrode surface due to the presence of AuNP-PAH. Also, the modifiers used provide a suitable microenvironment for the enzyme stabilization. The good performance of the proposed biosensor can also be attributed to the high conductivity and catalytic properties of the AuNPs, as well as possible hydrogen interactions between the amino groups of the PAH polymer and the hydroxyl groups of the dopamine molecule, promoting pre-concentration of the analyte on the electrode surface. The proposed biosensor showed good stability and adequate selectivity as well as good intra-day and inter-day repeatability and electrode-to-electrode repeatability. This biosensor was used for the quantification of dopamine in pharmaceutical samples and the results were in agreement with those obtained using a comparative method, indicating that the proposed biosensor is appropriate for the quantification of dopamine in other types of samples, for instance, biological samples.Acknowledgements
Financial support from FAPESC/CNPq (Process 2807/2012 – PRONEM), CNPq (Process 442609/2014-0) and also the scholarship granted by CNPq to TRS are acknowledged. This research was supported by the Central Laboratory of Electron Microscopy, Federal University of Santa Catarina (Florianópolis, SC, Brazil).References
- S. A. Ansari and Q. Husain, Biotechnol. Adv., 2012, 30, 512–523 CrossRef CAS PubMed.
- M. T. Castañeda, S. Alegret and A. Merkoçi, Electroanalysis, 2007, 19, 743–753 CrossRef.
- P. Zhao, N. Li and D. Astruc, Coord. Chem. Rev., 2013, 257, 638–665 CrossRef CAS.
- C. Jianrong, M. Yuqing, H. Nongyue, W. Xiaohua and L. Sijiao, Biotechnol. Adv., 2004, 22, 505–518 CrossRef PubMed.
- S. Tokonami, Y. Yamamoto, H. Shiigi and T. Nagaoka, Anal. Chim. Acta, 2012, 716, 76–91 CrossRef CAS PubMed.
- V. Cebrián, F. Martín-Saavedra, C. Yagüe, M. Arruebo, J. Santamaría and N. Vilaboa, Acta Biomater., 2011, 7, 3645–3655 CrossRef PubMed.
- M. Pumera, S. Sánchez, I. Ichinose and J. Tang, Sens. Actuators, B, 2007, 123, 1195–1205 CrossRef CAS.
- X. Zhang, Q. Guo and D. Cui, Sensors, 2009, 9, 1033–1053 CrossRef CAS PubMed.
- F. W. Campbell and R. G. Compton, Anal. Bioanal. Chem., 2010, 396, 241–259 CrossRef CAS PubMed.
- D. Brondani, B. Souza, B. S. Souza, A. Neves and I. C. Vieira, Biosens. Bioelectron., 2013, 42, 242–247 CrossRef CAS PubMed.
- S. C. Fernandes, D. M. P. O. Santos and I. C. Vieira, Electroanalysis, 2013, 25, 557–566 CrossRef CAS.
- E. Zapp, D. Brondani, I. C. Vieira, J. Dupont and C. W. Scheeren, Electroanalysis, 2011, 23, 1124–1133 CrossRef CAS.
- Z. Wang, Y. Cai, X. Liao, F. Zhang, D. Zhang and Z. Li, Appl. Biochem. Biotechnol., 2010, 162, 280–294 CrossRef CAS PubMed.
- A. Jarosz-Wilkołazka, T. Ruzgas and L. Gorton, Talanta, 2005, 66, 1219–1224 CrossRef PubMed.
- O. V. Morozova, G. P. Shumakovich, M. A. Gorbacheva, S. V. Shleev and A. l. Yaropolov, J. Biochem., 2007, 72, 1136–1150 CAS.
- S. Riva, Trends Biotechnol., 2006, 24, 219–226 CrossRef CAS PubMed.
- X. Chen, D. Li, G. Li, L. Luo, N. Ullah, Q. Wei and F. Hunag, Appl. Surf. Sci., 2015, 328, 44–452 Search PubMed.
- R. Rawal, S. Chawla and C. S. Pundir, Anal. Biochem., 2011, 419, 196–204 CrossRef CAS PubMed.
- S. Chawla, R. Rawal, S. Sharma and C. S. Pundir, Biochem. Eng. J., 2012, 68, 76–84 CrossRef CAS.
- C. Lanzellotto, G. Favero, M. L. Antonelli, C. Tortolini, S. Cannistraro, E. Coppari and F. Mazzei, Biosens. Bioelectron., 2014, 55, 430–437 CrossRef CAS PubMed.
- P. Solich, C. K. Polydorou, M. A. Koupparis and C. E. Efstathiou, J. Pharm. Biomed. Anal., 2000, 22, 781–789 CrossRef CAS PubMed.
- S. M. Chen and M. I. Liu, J. Electrochim. Chem., 2005, 579, 153–162 CrossRef CAS.
- R. N. Goyal and S. Bishnoi, Talanta, 2011, 84, 78–83 CrossRef CAS PubMed.
- J. N. Oak, J. Oldenhof and H. H. M. Van Tol, Eur. J. Pharmacol., 2000, 405, 303–327 CrossRef CAS PubMed.
- A. S. Adekunle, B. O. Agboola, J. Pillay and K. I. Ozoemena, Sens. Actuators, B, 2010, 148, 93–102 CrossRef CAS.
- S. K. Moccelini, S. C. Fernandes and I. C. Vieira, Sens. Actuators, B, 2008, 133, 364–369 CrossRef CAS.
- M. Noroozifar, M. Khorasani-Motlagh, M. B. Parizi and R. Akbari, Ionics, 2013, 19, 1317–1327 CrossRef CAS.
- P. E. Bermejo, R. Dorado, M. A. Zea-Sevilla and V. S. Menendez, Neurologia, 2011, 26, 173–181 CrossRef CAS PubMed.
- M. Moniruzzaman, K. Nakashima, N. Kamiya and M. Goto, Biochem. Eng. J., 2011, 48, 295–314 CrossRef.
- M. R. Moghadam, S. Dadfarnia, A. M. H. Shabani and P. Shahbazikhah, Anal. Biochem., 2011, 410, 289–295 CrossRef CAS PubMed.
- Q. M. Li, J. Li and Z. J. Yang, Anal. Chim. Acta, 2007, 583, 147–152 CrossRef CAS PubMed.
- L. Lin, P. H. Qiu, L. Z. Yang, X. N. Cao and L. T. Jin, Anal. Bioanal. Chem., 2006, 384, 1308–1313 CrossRef CAS PubMed.
- M. Tsunoda, C. Aoyama, H. Nomura, T. Toyoda, N. Matsuki and T. Funatsu, J. Pharm. Biomed. Anal., 2010, 51, 712–715 CrossRef CAS PubMed.
- C. A. Heidbreder, L. Lacroix, A. R. Atkins, A. J. Organ, S. Murray, A. West and A. J. Shah, J. Neurosci. Methods, 2001, 112, 135–144 CrossRef CAS PubMed.
- F. D. P. Ferreira, L. I. B. Silva, A. C. Freitas, T. A. P. Rocha-Santos and A. C. Duarte, J. Chromatogr., A, 2009, 1216, 7049–7054 CrossRef CAS PubMed.
- H. Liu, L. Zhang, J. Zhou, Y. Hao, P. He and Y. Fang, Anal. Chim. Acta, 2005, 541, 125–129 CAS.
- K. Vuorensola, H. Sirén and U. Karjalainen, J. Chromatogr., B: Biomed. Appl., 2003, 788, 277–289 CrossRef CAS.
- S. Wei, G. Song and J. M. Lin, J. Chromatogr., A, 2005, 1098, 166–171 CrossRef CAS PubMed.
- P. Raghu, T. Madhussudana Reddy, P. Gopal, K. Reddaiah and N. Y. Sreedhar, Enzyme Microb. Technol., 2014, 57, 8–15 CrossRef CAS PubMed.
- X. Lui, L. Xie and H. Li, J. Electroanal. Chem., 2012, 682, 158–163 CrossRef.
- K. Wang, P. Liu, Y. Ye, J. Li, W. Zhao and X. Huang, Sens. Actuators, B, 2014, 197, 292–299 CrossRef CAS.
- P. Joshi, H. C. Joshi, S. K. Sanghi and S. Kundu, Microchim. Acta, 2012, 169, 383–388 CrossRef.
- L. M. Yang, S. F. Liu, Q. X. Zhang and F. Li, Talanta, 2012, 89, 136–141 CrossRef CAS PubMed.
- W. Sun, M. X. Yang and K. Jiao, Anal. Bioanal. Chem., 2007, 389, 1283–1291 CrossRef CAS PubMed.
- T. R. Silva, D. Brondani, E. Zapp and I. C. Vieira, Electroanalysis, 2015, 27, 465–472 CrossRef CAS.
- C. A. Schneider, W. S. Rasbanda and K. W. Eliceiri, Nat. Methods, 2012, 9, 671–675 CrossRef CAS PubMed.
- S. R. Couto and J. L. T. Herrera, Biotechnol. Adv., 2006, 24, 500–513 CrossRef PubMed.
- R. C. Minussi, G. M. Pastore and N. Duran, Trends Food Sci. Technol., 2003, 13, 205–216 CrossRef.
- United States Pharmacopeia National Formulary XXIII, US Pharmacopeia Convention, Rockville, MD, 1995, p. 473 Search PubMed.
- G. Hublik and F. Schinner, Enzyme Microb. Technol., 2000, 27, 330–336 CrossRef CAS PubMed.
- J.-J. Feng, G. Zhao, J.-J. Xu and H.-Y. Chen, Anal. Biochem., 2005, 342, 280–286 CrossRef CAS PubMed.
- X. Zhao, Z. Mai, X. Kang and X. Zou, Biosens. Bioelectron., 2008, 23, 1032–1038 CrossRef CAS PubMed.
- C. Giacomelli, K. Ckless, D. Galato, F. S. Miranda and A. Spinelli, J. Braz. Chem. Soc., 2002, 13, 332–338 CrossRef CAS.
- T. R. Silva, E. Westphal, H. Gallardo and I. C. Vieira, Electroanalysis, 2014, 26, 1801–1809 CrossRef CAS.
| This journal is © The Royal Society of Chemistry 2016 |

