Design, fabrication and test of a pneumatically controlled, renewable, microfluidic bead trapping device for sequential injection analysis applications
Guocheng
Shao
ab,
Donglai
Lu
b,
Zhifeng
Fu
b,
Dan
Du
bc,
Richard M.
Ozanich
b,
Wanjun
Wang
*a and
Yuehe
Lin
*bc
aDepartment of Mechanical Engineering, Louisiana State University, Baton Rouge, LA 70803, USA. E-mail: wang@me.lsu.edu; yuehe.lin@wsu.edu
bPacific Northwest National Laboratory, Richland, WA 99352, USA
cSchool of Mechanical and Material Engineering, Washington State University, Pullman, WA 99164, USA
First published on 3rd November 2015
Abstract
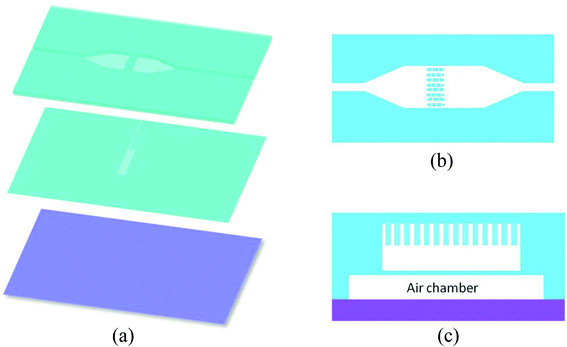
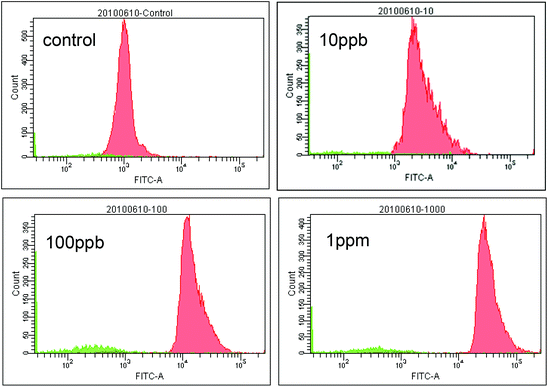
This paper describes the design, fabrication, and testing of a pneumatically controlled, renewable, microfluidic device for conducting bead-based assays in an automated sequential injection analysis system. The device used a “brick wall”-like pillar array (pillar size: 20 μm length × 50 μm width × 45 μm height) with 5 μm gaps between the pillars serving as the micro filter. The flow channel where bead trapping occurred is 500 μm wide × 75 μm deep. An elastomeric membrane and an air chamber were located underneath the flow channel. By applying pressure to the air chamber, the membrane is deformed and pushed upward against the filter structure. This effectively traps beads larger than 5 μm and creates a “bed” or micro column of beads that can be perfused and washed with liquid samples and reagents. Upon completion of the assay process, the pressure is released and the beads are flushed out from underneath the filter structure to renew the device. Mouse IgG was used as a model analyte to test the feasibility of using the proposed device for immunoassay applications. Resulting microbeads from an on-chip fluorescent immunoassay were individually examined using flow cytometry. The results show that the fluorescence signal intensity distribution is fairly narrow indicating high chemical reaction uniformity among the beads population. Electrochemical on-chip assay was also conducted. A detection limit of 1 ppb was achieved and good device reliability and repeatability were demonstrated. The novel microfluidic-based beads-trapping device thus opens up a new pathway to design micro-bead based immunoassays for various applications.
1 Introduction
In the past decade, microbeads, as versatile solid phase carriers for various chemical reactions, have been used in a wide spectrum of applications in the analytical chemistry field. Some of the typical applications include drug discovery,1,2 disease screening,3,4 toxin detection5 and DNA study,6etc. Comparing with conventional microplate based titration methods, micro bead-based assays possess several unique advantages. First, microbeads provide ultra-high surface-to-volume ratio that is vital for achieving high chemical reaction efficiency. It was calculated by Kawaguchi7 that 1 gram of micro beads with a diameter of 0.1 μm has a surface area as large as about 60 m2. Other than high surface-to-volume ratio, the reduced analyte transportation length, which is limited by the short distance between adjacent beads in a packed microbead column, is also advantageous for improving chemical reaction efficiency. In addition, the wide range of functional groups available for commercial beads has made it very convenient to conjugate beads with various types of antibodies, oligonucleotides, and other target analyte capture probes. As the result, microbeads have been an ideal platform for multiplexed assay applications.8 Bead-based assays are typically conducted in a “bench top” mode using microfuge tubes or microwell plates and tedious sample and solution manipulations are often required (e.g., pipetting, centrifugation). In recent years, with the advancement in microfabrication, the idea of utilizing microfabricated structures or microfluidic chips to conduct microbead-based assays has attracted significant interests.4,9–11 Bead-trapping mechanisms in microfluidic chips fall into two main categories: (1) magnetic bead trapping and (2) mechanical bead trapping. Magnetic bead trapping requires the on-chip integration of an electromagnet10 or a permanent magnet and only magnetic beads can be used.Mechanical bead trapping, on the other hand, is much simpler to realize and versatile for various bead types ranging from silica, to polymer to agarose beads. The simplest structure that can be used for bead trapping is a micro-weir with “leaking” gaps on top so that microbeads can be trapped by the weir while fluid can freely pass through the “leaking gaps”.12 A drawback for this design is that the reagents do not flow through the bead column; instead, they only pass above the bead column. This may potentially limit the reaction efficiency. To achieve better reaction efficiency, microfilter consisting of a pillar array with micron size gaps between adjacent pillars may be preferred. Andersson et al.9 reported a filter structure fabricated using silicon as material and Jeong et al.4 reported a similar device fabricated using PDMS as structural material. Microbeads with sizes greater than the pillar gap can be trapped by the microfilter while liquid solution (sample and reagents) and washing buffer can still pass through the bead column and the “filter”. With this design, uniform column packing and improved reaction efficiency were reported.4,8
Sequential Injection Analysis (SIA) systems and variants (e.g., “lab-on-a-valve” systems), have been developed as important chemical analytical tools13 and microbeads are often used in these assays.14 In an SIA system, the introduction and delivery of microbeads, as well as various reagents, can be accomplished by the bi-directional movements (forward and reverse) of the carrier stream and the multi-position valve. However, the beads-trapping component is often attached as an external unit and not included in the valve system.
An ideal beads-trapping device should provide high bead trapping efficiency, ease of attachment to existing SIA systems, the potential to include detection function into the unit, and also renewable (i.e., with effective bead releasing mechanism). Ruzicka and co-workers15 reported the first renewable beads-trapping component suitable for SIA applications – the “jet ring cell”. In their design, a capillary tube was placed against a flat surface; beads were trapped at the end of the capillary while fluid could pass through the small gap between the capillary end and the flat surface. The site of bead trapping could be renewable by reversing fluid flow or displacing the flat surface to remove the trapped beads. Solid rods with slightly smaller diameter tips than the flow channel were also inserted into flow cells for bead trapping purposes.6,16–18 Among these rod-based bead trapping designs, a particularly interesting one was reported by Bruckner-Lea et al.6 where a 0.89 mm diameter nickel rod with one end machined to 45° was inserted into a flow cell and the trapping site formed by the flow cell wall and the beveled rod tip was switched between “trap” and “release” positions by rotating the rod by 180 degrees. Although this design has been used in various analytical applications,5,6,17–19 it also showed certain limitations during experiments. First of all, since the outlet channel is only at one side of the flow cell, reagents passing through the flow cell may only perfuse through those beads close to the outlet channel. Thus non-uniform reaction efficiency among trapped beads may be caused which can result in higher assay variance. In addition, the rod and flow cell are fabricated using precision machining equipment and techniques, which can increase time and cost of device fabrication. It is also possible to make some of the newly report microchip based beads trapping devices “renewable” by introducing reverse flow to flush beads out after each use,12,20 however, since the flow direction is reversed and toward upstream channels, those designs not only require more flow control components, but also have high risk of contaminating upper stream channels, even the test samples.
In this paper, we report a pneumatically controlled, renewable, microfluidic beads-trapping device that can provide efficient bead packing/releasing and achieve uniform chemical reaction among packed beads. The device was fabricated by taking advantage of low-cost polydimethylsiloxane (PDMS) soft lithography technology. In our design, a pillar array spread across the fluid channel is employed for beads-trapping and a pneumatically driven flexible membrane underneath the microfilter pattern is used as the bead releasing mechanism. Flow cytometry fluorescence detection was performed using the micro beads collected from the prototype microfluidic device and fluorescence results confirmed the reaction uniformity among packed beads. Electrochemical detection was also tested to demonstrate the versatility of the reported design. With mouse IgG as the model analyte, it was proved that microbeads trapped and prepared in the proposed device could provide reproducible immunoassay results using both detection methods. Other on-chip detection scheme, such as chemilluminescence,21 is also being pursued using the same chip design. This paper focuses specifically on the chip design, fabrication and initial validation of its feasibility.
2 Materials and methods
2.1 Reagents and materials
Mouse IgG, goat anti-moue IgG conjugated with Fluorescein isothiocyanate (FITC), goat anti-mouse IgG conjugated with horseradish peroxidase (HRP), o-phenylenediamine dihydrochloride (OPD), hydrogen peroxide, bovine serum albumin (BSA), phosphate buffered saline (PBS), N-hydroxysulfosuccinimide (NHS) and hexamethyldisilazane (HMDS) were all purchased from Sigma-Aldrich (St. Louis, MO). Carboxyl functionalized polystyrene microbeads (9.77 μm nominal diameter) and PolyLink protein coupling kits (includes coupling buffer, wash/storage buffer and 1-ethyl-3-(3-dimethylaminopropyl) carbodiimide (EDAC)) were purchased from Bangs Laboratories, Inc. (Fishers, IN). PDMS elastomer kit (Sylgard 184) was obtained from Dow Corning (Midland, MI). Negative-tone photoresist SU-8 25 and SU-8 developer were purchased from Microchem Corp. (Newton, MA). Various tubing and blunt needles were purchased from Small Parts Inc. (Miami, FL). Distilled water generated from a Nanopure water purification system was used for all stock and buffer solution preparation. Other reagents used were of analytical grade.2.2 Apparatus
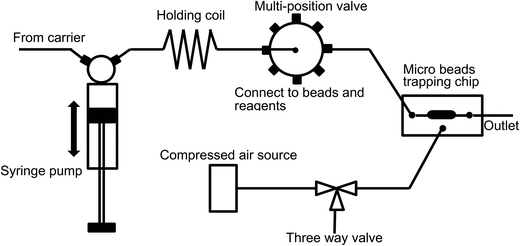
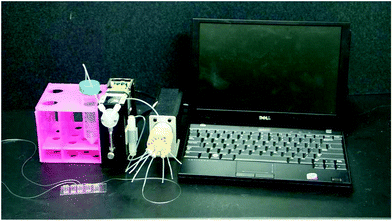
Micro beads and various reagents were aspirated and dispensed automatically using an in-house built SIA system5 as illustrated in Fig. 1. Fluid movement is accomplished using an XP3000 syringe pump with a 500 μL syringe (Cavro Scientific Instruments Inc., Sunnyvale, CA). Reagent selection is achieved using a 10-port multi-position valve (Valco Instrument Co. Inc., Houston, TX). The valve is connected to the syringe pump through a 1 mL holding coil comprised of coiled 0.7 mm ID Teflon™ tubing. The holding coil is also used to separate the “clean” side of the system from the reagent/reaction side of the system and ensures that the syringe barrel does not become contaminated. The inlet of the microfluidic chip is connected to one of the multi-position valve outlet ports. Compressed air is connected to the microfluidic chip through a three-way valve. By controlling the three-way valve, high pressure (bead trap position) or atmospheric pressure (bead release position) can be applied to the micro-pneumatic control chamber in the microchip, and thus the beads trapping mechanism can be switched “on” and “off”. The whole SIA system is controlled automatically using in-house software written in LabWindows CVI (National Instruments, Austin, TX). The three-way valve was operated manually in this study.A Nikon TE-300 inverted fluorescence microscope with integrated CCD camera was used to obtain fluorescence images. An electrochemical analyzer CHI 660A (CH Instrument, Austin, TX) and disposable Screen-Printed Electrodes (SPEs) consisting of a carbon working electrode, a carbon counter electrode, and an Ag/AgCl reference electrode (Alderon Biosciences Inc., Durham, NC) were employed for electrochemical detection. A BD FACSAria flow cytometer (BD Biosciences, San Jose, CA) was used to measure the fluorescence intensity of individual beads and thus obtain information about the reaction homogeneity among the bead population.
2.3 Renewable microfluidic bead trapping device
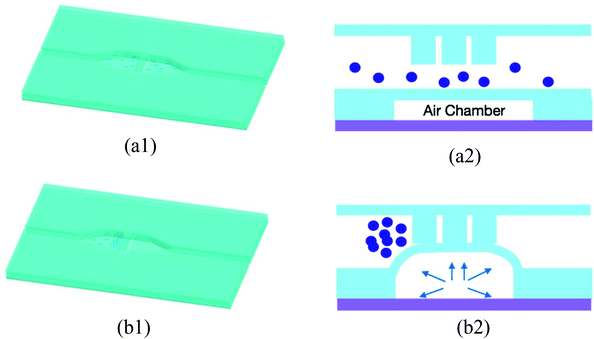
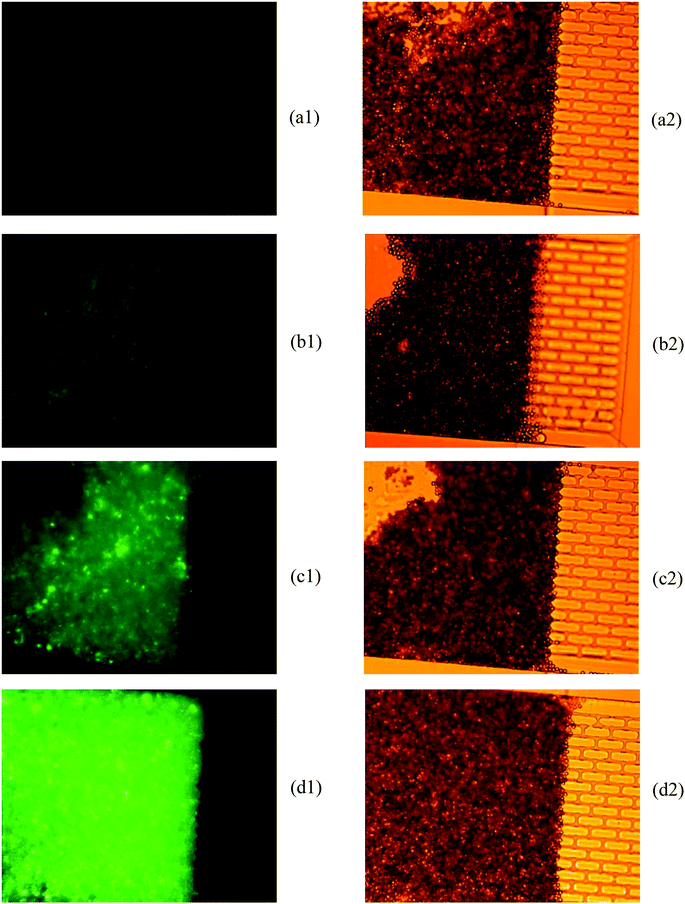
If no air pressure is applied, the membrane is relaxed to its equilibrium position, and micro beads can pass the whole bead chamber through the gap between the micro filter and the chamber bottom (as shown in Fig. 3(a1) and (a2)). When an adequate pressure is applied to the air chamber, the thin membrane deforms until it reaches the bottom of the micro filter structure. With the membrane deformed, micro beads with diameter greater than the gap in the brick pattern cannot pass through the “brick wall” and thus are retained in the inlet side of the micro filter structure, while the various reagent solutions can flow through the bead column and filter structure (Fig. 3(b1) and (b2)). Once the assay process is finished, the pneumatic pressure is released and the beads are flushed out by buffer fluid, the device is thus renewed.
![[thin space (1/6-em)]](https://www.rsc.org/images/entities/char_2009.gif) :
:![[thin space (1/6-em)]](https://www.rsc.org/images/entities/char_2009.gif) 1 (base
1 (base![[thin space (1/6-em)]](https://www.rsc.org/images/entities/char_2009.gif) :
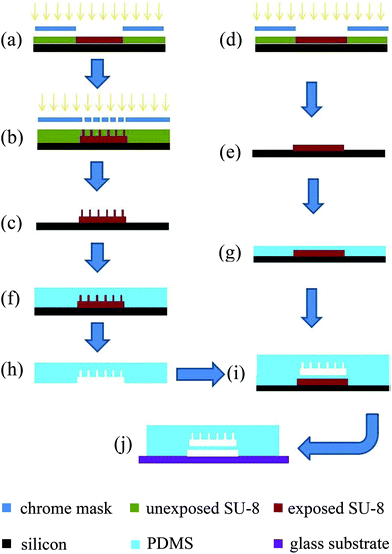
:![[thin space (1/6-em)]](https://www.rsc.org/images/entities/char_2009.gif) curing agent). For the SU-8 master mold for bead chamber and micro filter layer, the PDMS prepolymer was directly poured onto the mold to form an approximately 10 mm thick PDMS layer (Fig. 4(f)). For the air chamber layer, PDMS prepolymer was spincoated on the master mold at 2000 rpm for 30 seconds with a resulting thickness of approximately 50 μm (so the active membrane was approximately 20 μm) (Fig. 4(g)). Both PDMS prepolymer layers were thermally cured at 75 °C for 2 hours. The bead chamber and micro filter layer were then peeled off from the master molds and cut into individual pieces (Fig. 4(h)). The outlet and inlet fluid access holes were punched using a blunt needle (gauge 18, inner diameter = 0.84 mm). Individual PDMS slabs and the air chamber layer which was still on its master mold were then treated in oxygen plasma for a short time (50 watts, 30 seconds). Right after the plasma treatment, the PDMS slabs with bead chamber and micro filter were aligned onto the air chamber layer under a stereomicroscope (Fig. 4(i)). After curing at 75 °C for another 20 minutes, the resulting double layer PDMS device could be peeled off from the master mold. After pneumatic access hole was punched, the PDMS device and a glass slide were treated in oxygen plasma for another 30 seconds and then irreversibly bound together to form the final device as shown in Fig. 4(j).
curing agent). For the SU-8 master mold for bead chamber and micro filter layer, the PDMS prepolymer was directly poured onto the mold to form an approximately 10 mm thick PDMS layer (Fig. 4(f)). For the air chamber layer, PDMS prepolymer was spincoated on the master mold at 2000 rpm for 30 seconds with a resulting thickness of approximately 50 μm (so the active membrane was approximately 20 μm) (Fig. 4(g)). Both PDMS prepolymer layers were thermally cured at 75 °C for 2 hours. The bead chamber and micro filter layer were then peeled off from the master molds and cut into individual pieces (Fig. 4(h)). The outlet and inlet fluid access holes were punched using a blunt needle (gauge 18, inner diameter = 0.84 mm). Individual PDMS slabs and the air chamber layer which was still on its master mold were then treated in oxygen plasma for a short time (50 watts, 30 seconds). Right after the plasma treatment, the PDMS slabs with bead chamber and micro filter were aligned onto the air chamber layer under a stereomicroscope (Fig. 4(i)). After curing at 75 °C for another 20 minutes, the resulting double layer PDMS device could be peeled off from the master mold. After pneumatic access hole was punched, the PDMS device and a glass slide were treated in oxygen plasma for another 30 seconds and then irreversibly bound together to form the final device as shown in Fig. 4(j).
2.4 Bead coupling
A classic EDAC/NHS protein conjugation process was performed to covalently link mouse IgG onto the carboxyl-modified micro beads.19 First, 125 μL of micro bead solution (solid content 10%, nominal diameter 9.77 μm) was added to 400 μL PolyLink Coupling Buffer (50 mM 2-(N-morpholino)ethanesulfonic acid (MES), pH 5.2; 0.05% Proclin® 300) and centrifuged for 3 minutes at 13![[thin space (1/6-em)]](https://www.rsc.org/images/entities/char_2009.gif) 000 rpm. Then the excessive buffer was removed and another 400 μL of fresh PolyLink Coupling Buffer was added to the bead pellet for another washing, centrifugation and decanting process. The same washing process was repeated three times. Then the resulting bead pellet was resuspended in 170 μL PolyLink Coupling Buffer. In a separate vial, 10 mg EDAC and 5 mg NHS were dissolved in 50 μL PolyLink Coupling Buffer to make the activation buffer. Immediately after solution preparation, 20 μL of this activation buffer was added to the bead suspension and reacted for 30 minutes with gentle vortex mixing. After activation, the micro beads were washed for three times. The activated beads were then resuspended in 100 μL PolyLink Coupling Buffer. FITC labeled anti-mouse IgG (1 mg mL−1, 180 μL) was then added to the bead suspension and reacted for 2.5 hours with gentle vortex mixing. The antibody conjugated beads were then pelleted and washed for three times using PolyLink Wash/Storage Buffer (10 mM Tris, pH 8.0; 0.05% BSA; 0.05% Proclin 300). Finally, the sample beads were suspended in 375 μL PolyLink Wash/Storage Buffer (1 × 10⁸ beads per mL) and stored at 2–4 °C in an opaque box.
000 rpm. Then the excessive buffer was removed and another 400 μL of fresh PolyLink Coupling Buffer was added to the bead pellet for another washing, centrifugation and decanting process. The same washing process was repeated three times. Then the resulting bead pellet was resuspended in 170 μL PolyLink Coupling Buffer. In a separate vial, 10 mg EDAC and 5 mg NHS were dissolved in 50 μL PolyLink Coupling Buffer to make the activation buffer. Immediately after solution preparation, 20 μL of this activation buffer was added to the bead suspension and reacted for 30 minutes with gentle vortex mixing. After activation, the micro beads were washed for three times. The activated beads were then resuspended in 100 μL PolyLink Coupling Buffer. FITC labeled anti-mouse IgG (1 mg mL−1, 180 μL) was then added to the bead suspension and reacted for 2.5 hours with gentle vortex mixing. The antibody conjugated beads were then pelleted and washed for three times using PolyLink Wash/Storage Buffer (10 mM Tris, pH 8.0; 0.05% BSA; 0.05% Proclin 300). Finally, the sample beads were suspended in 375 μL PolyLink Wash/Storage Buffer (1 × 10⁸ beads per mL) and stored at 2–4 °C in an opaque box.
2.5 Fluidic assay protocol
The microbead immunoassay was automatically controlled using the SIA system illustrated in Fig. 1 with an in-house written software. The actuation of the trapping mechanism was manually controlled. Before starting the assay, 5% BSA in PBS solution was injected into the microfluidic chip and allowed for 30 minutes of contacting time to block the non-specific binding sites on the PDMS surface. The main steps of the immunoassay process are listed in Table 1. First, the three-way switch was set so that 40 psi of pressure was applied to the air chamber and the microfluidic device was set to “trap” position. Then 2 μl of the diluted microbeads (100× diluted in 2% BSA in 1× PBS solution) were aspirated and delivered to the bead-trapping site. Once the bead column was packed, the FITC labeled (or HRP labeled) anti-mouse IgG was then aspirated and perfused through the bead column. To ensure good reaction efficiency, every second of sample perfusion was followed by 9 seconds of stop-flow time. The total sample perfusion time was 10 minutes. After the immuno-reaction, the bead column was washed using 1× PBS buffer for 10 minutes to remove unbound antibody. To collect microbeads for signal detection, the air pressure was released and the device was set to the “release” state. Then the PBS buffer was injected into the bead chamber to flush out all prepared microbeads. Details about the assay process are shown in Table 1. To prevent compressed air from leaking through the membrane and forming air bubbles in the fluidic channel, the air control chamber was first filled with water and it was this water that pushed the membrane up when pressure was applied. The total assay time was less than 25 minutes.| Step | Action | Last time (s) | Flow rate (μL min−1) |
|---|---|---|---|
| 1 | Set the microfluidic chip to “trap” state, aspirate micro beads | Aspirate for 1 s | 2400 |
| 2 | Deliver the beads into the microfluidic chip and retain beads in the chamber | Perfuse beads for 2 minutes | 20 |
| 3 | Aspirate anti-mouse IgG coupled with FITC label (or blank) | Aspirate for 30 s | 20 |
| 4 | Deliver anti-mouse IgG to the bead chamber | Perfuse for 1 s and wait for 9 s then repeat (total time 10 min) | 10 |
| 5 | Wash | Perfuse PBS solution for 10 minutes | 10 |
| 6 | Set the microfluidic chip to “release” and collect beads for detection | Perfuse for 2 minutes | 20 |
| 7 | Wash and get ready for the next assay | Perfuse PBS solution for 10 minutes | 20 |
3 Results and discussion
3.1 In-chip bead trapping and releasing
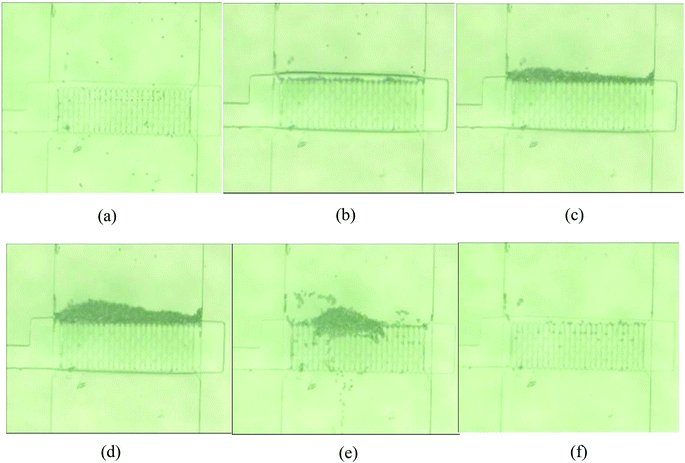
As shown in Fig. 5, the microfluidic chip was successfully fabricated by the aforementioned microfabrication process and connected to the SIA system. For the ease of observation and image acquisition, the bead trapping experiment was conducted under a microscope and a precision syringe pump was used for fluid and bead injection. A 10 μl min−1 flow rate was used for bead injection and 20 μl min−1 was used for the bead flushing step. The pneumatic actuation of the membrane was controlled by manually switching a three-way valve as described in the Experimental section. The beads-trapping and releasing processes are illustrated in Fig. 6. With no pressured air supplied in the control chamber, the micro beads (nominal diameter 9.77 μm) can pass underneath the filter array and no bead was retained by the filter structure (Fig. 6(a)). Once pressured air was applied to the control chamber, the membrane was deformed and pushed against the “brick wall”, and the micro beads start to be retained in front of the “brick wall” while fluid continues to pass through freely (Fig. 6(b)). After 20 seconds of trapping, a clearly visible amount of beads were trapped (Fig. 6(c)), and after 60 seconds, a bead column with length of about 100 μm was formed (Fig. 6(d)). The resulting bead column is quite uniform in length across the 500 μm wide fluid channel. To test the release mechanism, the air pressure was turned off while washing buffer continued to flow. Initially, the bead column was disrupted by the washing buffer flow and most of the micro beads were flushed away (Fig. 6(e)). After 60 seconds of flushing, the device was cleaned and ready for the next assay (Fig. 6(f)). While not all of the beads were flushed away, the very few residual beads would have a minimal effect on subsequent assays since the number of beads used for each assay is around 10![[thin space (1/6-em)]](https://www.rsc.org/images/entities/char_2009.gif) 000. It is counted that after 60 seconds of washing, less than 0.5% of beads are left. While it is ok for the detection schemes used in this work since beads are characterized as a population, longer and more aggressive washing steps maybe required for applications that are ultra-sensitive to cross-contamination. For those applications, another alternative method is to use larger but smaller number of beads, larger beads are generally easier to clean out.
000. It is counted that after 60 seconds of washing, less than 0.5% of beads are left. While it is ok for the detection schemes used in this work since beads are characterized as a population, longer and more aggressive washing steps maybe required for applications that are ultra-sensitive to cross-contamination. For those applications, another alternative method is to use larger but smaller number of beads, larger beads are generally easier to clean out.
3.2 Immunoassay using trapped micro beads as solid phase carriers
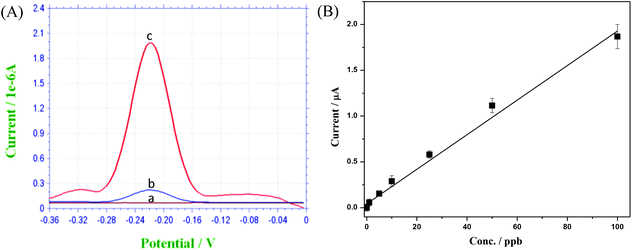
Our next goal was to demonstrate the feasibility of using trapped micro beads as solid phase carriers for immunoassay applications. A basic “one-side” immunoassay experiment was conducted using the procedure described in the Experimental section. Instead of forming “coating antibody + antigen + reporter antibody” sandwich format immuno-conjugate, only “antigen + reporter antibody” conjugate was utilized in “one-side” format immunoassay. In our experiment, “one-side” format is adequate for testing some key aspects in an immunoassay experiment. These aspects include: (1) the efficiency of the blocking protocol for achieving low signal background, (2) the correlation between the signal generated by the reporter antibody and the antigen concentration, and (3) the repeatability of the experimental results.The concentration of HRP was detected by measuring the SWV (square wave voltammetry) response generated by the oxidation product of o-phenylenediamine (OPD) substrate.22 The SWV experiments were carried out under the following conditions: the scanning potential was from 0 to −0.4 V, with increments of 4 mV, amplitude of 25 mV, and a frequency of 15 Hz. Baseline corrections was carried out using CHI software.
Since HRP can catalyze the oxidation of OPD in the present of H2O2, its concentration closely correlates to the amplitude of the voltametric response peak. As shown in Fig. 9(A), only a slight peak is visible for the control experiment due to the spontaneous oxidation of OPD by H2O2 without the presence of HRP. With increasing HRP concentration, the peak amplitude is consequently increased. Fig. 9(B) shows the calibration curve resulting from the electrochemical immunoassay experiment. Based on the background signal from control experiment (shown in Fig. 9(A)) and a minimum signal to noise ratio of 3, the limit of detection (LOD) was calculated to be 0.1 ppb. Good linearity and repeatability were also observed using the described device and beads as the immunoassay platform.
4 Conclusions
A novel microbead trapping and releasing device was designed, fabricated and tested. This device can be readily used in an automated sequential injection analysis system as a microbead manipulation device. A thin elastomeric membrane driven by pneumatic pressure was used to switch the device between “beads-trapping” and “beads-releasing” states. Different detection approaches including fluorescent microscopy, electrochemistry and flow cytometry have been successfully tested with the proposed microfluidic device. These encouraging results not only demonstrated the versatility of our design, but also show good chemical reaction uniformity among the beads population. Although only mouse IgG was tested as the model analyte in our experiment, the proposed device could be widely used in disease diagnosis, DNA screening and cell-based assays. The low fabrication cost, high performance and flexibility to be used with different detection methods make this device an attractive approach to conducting bead-based assays.Acknowledgements
The work was partly supported by a LDRD program at Pacific Northwest National Laboratory. Part of the research described in this paper was performed using EMSL, a national scientific user facility sponsored by the Department of Energy's Office of Biological and Environmental Research and located at PNNL. PNNL is operated for DOE by Battelle under Contract DE-AC05-76RL01830. DD and YL acknowledge the financial support by Centers for Disease Control and Prevention/National Institute for Occupational Safety and Health (CDC/NIOSH) Grant No. R21OH010768. The contents are solely the responsibility of the authors and do not necessarily represent the official views of the CDC. We would like to thank Dr Jun Wang for helpful discussion.References
- M. B. Meza, Bead-based HTS applications in drug discovery, Drug Discovery Today, 2000, 5, 38–41 CrossRef.
- J. P. Nolan, S. Lauer, E. R. Prossnitz and L. A. Sklar, Flow cytometry: A versatile tool for all phases of drug discovery, Drug Discovery Today, 1999, 4, 173–180 CrossRef CAS PubMed.
- K. Sato, M. Tokeshi, H. Kimura and T. Kitamori, Determination of Carcinoembryonic Antigen in Human Sera by Integrated Bead-Bed Immunoasay in a Microchip for Cancer Diagnosis, Anal. Chem., 2001, 73, 1213–1218 CrossRef CAS PubMed.
- Y. Jeong, K. Choi, J. Kim, D. S. Chung, B. Kim, H. C. Kim and K. Chun, PDMS micro bead cage reactor for the detection of alpha feto protein (AFP), Sens. Actuators, B, 2008, 128, 349–358 CrossRef CAS.
- R. M. Ozanich, C. J. Bruckner-Lea, M. G. Warner, K. Miller, K. C. Antolick, J. D. Marks, J. Lou and J. W. Grate, Rapid Multiplexed Flow Cytometric Assay for Botulinum Neurotoxin Detection Using an Automated Fluidic Microbead-Trapping Flow Cell for Enhanced Sensitivity, Anal. Chem., 2009, 81, 5783–5793 CrossRef CAS PubMed.
- C. J. Bruckner-Lea, M. S. Stottlemyre, D. A. Holman, J. W. Grate, F. J. Brockman and D. P. Chandler, Rotating Rod Renewable Microcolumns for Automated, Solid-Phase DNA Hybridization Studies, Anal. Chem., 2000, 72, 4135–4141 CrossRef CAS PubMed.
- H. Kawaguchi, Functional polymer microspheres, Prog. Polym. Sci., 2000, 25, 1171–1210 CrossRef CAS.
- D. A. A. Vignali, Multiplexed particle-based flow cytometric assays, J. Immunol. Methods, 2000, 243, 243–255 CrossRef CAS PubMed.
- H. Andersson, W. v. d. Wijngaart and G. Stemme, Micromachined filter-chamber array with passive valves for biochemical assays on beads, Electrophoresis, 2001, 22, 249–257 CrossRef CAS PubMed.
- J.-W. Choi, K. W. Oh, J. H. Thomas, W. R. Heineman, H. B. Halsall, J. H. Nevin, A. J. Helmicki, H. T. Henderson and C. H. Ahn, An integrated microfluidic biochemical detection system for protein analysis with magnetic bead-based sampling capabilities, Lab Chip, 2002, 2, 27–30 RSC.
- T. Lilliehorn, M. Nilsson, U. Simu, S. Johansson, M. Almqvist, J. Nilsson and T. Laurell, Dynamic arraying of microbeads for bioassays in microfluidic channels, Sens. Actuators, B, 2005, 106, 851–858 CrossRef CAS.
- K. Sato, M. Tokeshi, T. Odake, H. Kimura, T. Ooi, M. Nakao and T. Kitamori, Integration of an Immunosorbent Assay System: Analysis of Secretory Human Immunoglobulin A on Polystyrene Beads in a Microchip, Anal. Chem., 2000, 72, 1144–1147 CrossRef CAS PubMed.
- (a) J. Ruzicka, Lab-on-valve: universal microflow analyzer based on sequential and bead injection, Analyst, 2000, 125, 1053–1060 RSC; (b) W. Yantasee, C. Timchalk, G. E. Fryxell, B. P. Dockendorff and Y. H. Lin, Automated portable analyzer for lead (II) based on sequential flow injection and nanostructured electrochemical sensors, Talanta, 2005, 68, 256–261 CrossRef CAS PubMed; (c) G. Liu, S. L. Riechers, C. Timchalk and Y. H. Lin, Sequential injection/electrochemical immunoassay for quantifying the pesticide metabolite 3, 5, 6-trichloro-2-pyridinol, Electrochem. Commun., 2005, 7, 1463–1470 CrossRef CAS.
- J. Ruzicka and E. H. Hansen, Flow injection analysis. principles, applications and trends, Anal. Chim. Acta, 1980, 114, 19–44 CrossRef CAS.
- J. Ruzicka, C. H. Pollema and K. M. Scudder, Jet ring cell: a tool for flow injection spectroscopy and microscopy on a renewable solid support, Anal. Chem., 1993, 65, 3566–3570 CrossRef CAS PubMed.
- D. A. Holman, G. D. Christian and J. Ruzicka, Titration without Mixing or Dilution: Sequential Injection of Chemical Sensing Membranes, Anal. Chem., 1997, 69, 1763–1765 CrossRef CAS PubMed.
- C. J. Bruckner-Lea, T. Tsukuda, B. Dockendorff, J. C. Follansbee, M. T. Kingsley, C. Ocampo, J. R. Stults and D. P. Chandler, Renewable microcolumns for automated DNA purification and flow-through amplification: from sediment samples through polymerase chain reaction, Anal. Chim. Acta, 2002, 469, 129–140 CrossRef CAS.
- M. G. Warner, J. W. Grate, A. Tyler, R. M. Ozanich, K. D. Miller, J. Lou, J. D. Marks and C. J. Bruckner-Lea, Quantum dot immunoassays in renewable surface column and 96-well plate formats for the fluorescence detection of botulinum neurotoxin using high-affinity antibodies, Biosens. Bioelectron., 2009, 25, 179–184 CrossRef CAS PubMed.
- G. T. Hermanson, Preparation of Liposome Conjugates and Derivatives, in Bioconjugate Techniques, Academic Press, San Diego, 1996, pp. 528–569 Search PubMed.
- T. Ohashi, K. Mawatari, K. Sato, M. Tokeshi and T. Kitamori, A Micro-ELISA System for the Rapid and Sensitive Measurement of Total and Specific Immunoglobulin E and Clinical Application to Allergy Diagnosis, Lab Chip, 2009, 9, 991–995 RSC.
- Z. Fu, G. Shao, J. Wang, D. Lu, W. Wang and Y. Lin, Microfabricated Renewable Beads-Trapping/Releasing Flow Cell for Rapid Antigen–Antibody Reaction in Chemiluminescent Immunoassay, Anal. Chem., 2011, 83, 2685–2690 CrossRef CAS PubMed.
- H. Ju, G. Yan, F. Chen and H. Chen, Enzyme-Linked Immunoassay of α-1-Fetoprotein in Serum by Differential Pulse Voltammetry, Electroanalysis, 1999, 11, 124–128 CrossRef CAS.
| This journal is © The Royal Society of Chemistry 2016 |

