Analysis of cobalt phosphide (CoP) nanorods designed for non-enzyme glucose detection
Qiang-Qiang
Sun
,
Min
Wang
*,
Shu-Juan
Bao
*,
Yu Chen
Wang
and
Shuang
Gu
Institute for Clean Energy & Advanced Materials, Faculty of Materials and Energy, Southwest University, Chongqing, 400715, P. R. China. E-mail: minwang@swu.edu.cn; baoshj@swu.edu.cn
First published on 6th November 2015
Abstract
The nanorods of cobalt phosphide have been prepared and evaluated as an electrocatalyst for non-enzyme glucose detection. The nanorods were used to modify the surface of an electrode and detect glucose without the help of an enzyme for the first time. The crystal structure and composition of cobalt phosphide were identified by XRD and XPS, respectively, and the morphology of the as-prepared samples was observed by FESEM and TEM. The electrochemical measurement results indicate that the CoP-based sensor exhibits excellent catalytic activity and a far lower detection potential compared to bare GCE. Specifically, the electrocatalytic mechanism of CoP in the detection of glucose was proposed based on a series of physical characterization methods, electrochemical measurements, and theoretical calculations.
Introduction
The development of a fast and reliable method for glucose determination is immensely important in many fields, including clinical diagnostics, the food industry, and in the preparation of biological and chemical samples. Throughout the past few decades, a great deal of effort has been devoted to exploring reliable glucose sensing techniques, such as fluorescence,1 optical,2 electro-chemiluminescence,3 surface plasmon resonance,4 and electrochemical methods.5 Among these techniques, the electrochemical method has become the most highly desirable for sensor research. Electrochemical methods can be classified into glucose oxidase-based sensing and non-enzymatic glucose sensing. Glucose oxidase is a type of bio-enzyme that possesses high sensitivity and selectivity to glucose and has been widely used to construct various amperometric biosensors for glucose detection. However, due to the intrinsic properties of the enzyme, glucose oxidase-based biosensors suffer from instability. Therefore, it is of great importance to develop sensitive and selective non-enzymatic sensors for glucose detection. The enzymeless detection of glucose by conventional electrochemical methods is not just of recent interest; continued efforts have been made since early studies.6–8 However, the electrocatalytic oxidation process of glucose on bare platinum or a carbon surface illustrates that the overall kinetics of glucose oxidation is too slow to produce a significant faradaic current, which is important for collecting the signal of glucose. Hence, searching for excellent catalyst materials to reduce the activation energy and to understand the mechanisms of electrocatalytic glucose is very important for designing a good enzyme-free glucose sensor. With the development of nanoscience and nanotechnology, an increasing amount of nanomaterials, including various metals (e.g., Au, Pd, Pt, and Cu9–12) and transition metal oxides (e.g., CuO, NiO, Co3O4, MnO2, etc.13–16), have been used to modify enzyme-free biosensor electrodes. While such research has boosted the development of enzyme-free bioelectroanalysis, studies on the mechanism still require further investigation.Cobalt phosphides have recently received increasing attention due to their catalytic and magnetic properties as well as their potential as a promising electrode material.17–19 The valency of Co is changeable, and Co can be easily exposed in the orthorhombic crystal of CoP; thus, CoP can be used in catalytic oxidation to reduce substances like glucose. However, to the best of our knowledge, the use of CoP for enzyme-free bioelectroanalysis of glucose remains unexplored.
In this featured work, we present the fundamental study of CoP nanorods used in glucose sensing. The designed biosensor should exhibit a typical amperometric response in an alkaline solution without the help of an enzyme; this behavior satisfies the requirements for an electrocatalytic material of a glucose biosensor. Furthermore, the mechanism of glucose oxidation on the CoP surface is discussed in detail, which is meaningful for searching for excellent catalyst materials for an enzyme-free glucose sensor.
Experiment
Reagents
Cobalt nitrate (Co(NO3)2·6H2O), urea (CO(NH2)2) and Nafion were purchased from Sigma-Aldrich. Sodium hypophosphite (NaH2PO2) was purchased from Aladdin Industrial. All chemical reagents were used as received without further purification.Synthesis of materials
In 80 mL of deionized water, 2.3 g of Co(NO3)2·6H2O and 2.4 g of urea were added to form a pink solution under stirring. The solution was kept at 90 °C for 12 h to produce a precipitate, which was considered as the precursor for the next reaction. The as-obtained precipitate was filtered and washed with deionized water. Successively, the precursor was dried at 60 °C for 10 h. Finally, cobalt phosphide was fabricated by low-temperature phosphidation of the obtained Co-based precursor as follows: annealing 0.2 g of the as-prepared precursor in a tubular furnace at 350 °C for 1.5 h with 2.5 g of NaH2PO2 under Ar flow. Noticeably, NaH2PO2 was placed in front of the precursor separately in the Ar flow direction.Characterization of the materials
The morphologies of the precursor and the final product were characterized by using a field emission scanning electron microscope (FESEM, JSM-7800F, Japan) and a transmission electron microscope (TEM, JEM-2100, Japan). Their crystal structure was determined by powder X-ray diffraction (XRD, XRD-7000). The X-ray photoelectron spectroscopy (XPS) data were obtained by using a spectrometer (Escalab 250xi, Thermo Scientific).Electrochemical measurements
CoP was dispersed in deionized water to form a 10 mg ml−1 CoP suspension. A glass carbon electrode (GCE) with a diameter of 3 mm was polished with 0.3 and 0.05 μm alumina powder, followed by rinsing with deionised water. Then the electrode was dried at room temperature. Next, 5 μL of the above suspension was dropped on the center of GCE and dried naturally. Finally, 10 μL of 0.5 wt% Nafion solution was placed on the whole plate of GCEs to form a Nafion membrane. The as-fabricated working electrode was named CoP/GCE. The electrochemical measurements were carried out using a three-electrode system, which employed a platinum wire as a counter electrode, and an Hg/HgO electrode as a reference, and a 0.1 M NaOH solution was used as the electrolyte.Calculation methods
The theoretical density functional theory (DFT)20 calculations are performed with the CASTEP package. CASTEP is available as part of Materials Studio, Accelrys Inc., Suite 100 San Diego, CA 92121, USA. Generalized gradient approximation (GGA) with Perdew–Burke–Ernzerhof (PBE) functional21 was used for exchange and correlation. The double numerical basis with polarization functions (DNP) was used as the atomic basis set. The tolerance of density convergence in the self-consistent field (SCF) was set to 1 × 10⁻⁵ eV per atom. The energy tolerance was 5 × 10⁻⁵ eV per atom. The force tolerance was chosen as 0.1 eV Å−1 for full relaxation of the structure.Results and discussion
The crystal structure of the as-prepared samples was determined by XRD. Fig. 1A(a) shows the XRD pattern of the cobalt salt precursor whose peaks matched well with that of orthorhombic basic cobalt carbonate hydroxide Co(OH)2(CO)2 (JCPDS 48-0083). All of the diffraction peaks in Fig. 1A(b) are from CoP (JCPDS 27-0497), which indicates that crystalline CoP was prepared after low-temperature phosphidation. As seen in Fig. 1A(a), the main peaks of CoP appearing at 31.6°, 36.3°, 46.2°, 48.1°, and 56.8° correspond to the (011), (111), (112), (211), and (301) crystal faces of CoP, respectively. Fig. 1B illustrates the molecular stick model of CoP, which is orthorhombic. In the monophosphide CoP, the metal atoms form triangular prisms, where the metal atoms surround the nonmetal atoms. Thus, Co has a greater chance to be exposed to the outside and permits more access to the active corner and edge sites on the crystallite surfaces. The lattice plane of (011) is marked in Fig. 1B.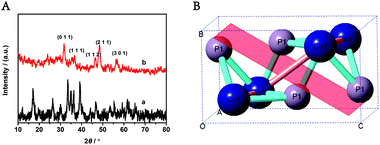 | ||
| Fig. 1 (A) The XRD patterns of the cobalt precursor (a) and the final product CoP (b); (B) the crystal structure of CoP. | ||
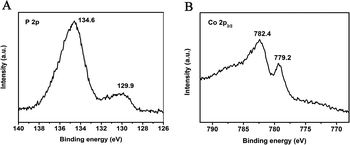
The X-ray photoelectron spectra (XPS) in the P (2p) and Co (2p3/2) regions for CoP nanorods are shown in Fig. 2. Two peaks are apparent in the Co (2p3/2) region at 779.2 and 782.4 eV, along with two peaks in the P (2p) region at 129.9 and 134.6 eV; the peaks are close to the binding energies (BEs) of Co and P in CoP, respectively. The P (2p) binding energy of 129.9 eV is negatively shifted from that of elemental P (130.2 eV), and the Co (2p) BE of 779.2 eV is positively shifted from that of the Co metal (778.1–778.2 eV). This suggests that the Co atom in CoP has a partial positive charge (Coδ+), while the P has a partial negative charge, implying the transfer of electron density from Co to P.22,23 When compared with Co3O4, the binding energy of the Co atom in CoP is lower than that in Co3O4 (779.58 eV).24 The average positive charge of the Co atom in CoP is below 3 (0 < δ < 3).
The morphologies of the cobalt salt precursor and the final product CoP (Fig. 3C) were further investigated by FESEM and TEM. As displayed in Fig. 3A and B, the precursor is constructed by nanorods. After low-temperature phosphidation, the obtained CoP kept the original morphology of its precursor, even though the nanorods became tougher. The TEM images in Fig. 3D and E further reveal that the surface of CoP nanorods is rough and porous. The high resolution TEM (HRTEM) image (Fig. 3F) of the CoP nanorods shows clear lattice fringes, which confirms single-crystallinity of the CoP. The lattice spacing is 0.28 nm between the adjacent lattice planes in the image and corresponds to the distance between the two (011) crystal planes. This loose and porous nanostructure is beneficial to the transfer of electrolytes and the adsorption of glucose on its surface. This makes it possible to obtain quick measurements of glucose in solution.
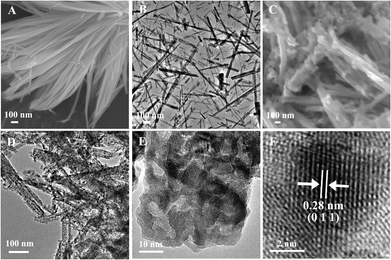 | ||
| Fig. 3 FESEM images of CoP (C) and its precursor (A); TEM images of the precursor (B); TEM images of CoP (D, E) and its high resolution (HRTEM) image (F). | ||
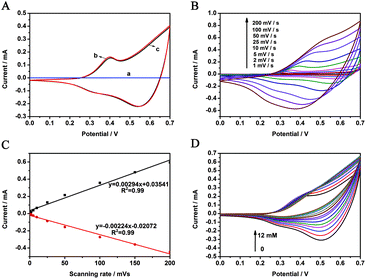
Fig. 4A shows the cyclic voltammograms (CVs) of the bare GCE and the CoP/GCE in 0.1 M NaOH solution at a scanning rate of 25 mV s−1. It is clear that no redox peak is observed for the bare electrode (Fig. 4A(a)), suggesting that it is electrochemically silent in the potential range. While a pair of obvious redox peaks can be seen at CoP/GCE, its redox peaks in N2-saturated (Fig. 4A(b)) and air-saturated (Fig. 4A(c)) NaOH solution are very similar, which suggests that CoP is not sensitive to oxygen. The two pairs of peaks shown in Fig. 4A are attributed to the redox reaction of CoP on the electrode surface in alkaline medium. The electrochemical reaction process of CoP in an alkaline electrolyte solution is still not very clear. However, according to XPS analysis, the valence state of the Co ion in CoP is below +3. The reaction properties of CoP are very similar to that of other Co3O4 reported in a previous study, which discovered two pairs of well-defined and symmetric redox peaks in an alkaline medium.25 The reaction equations of this process are described as follows:
| Coδ+ + nOH− + H2O ↔ CoOOH + ne− | (1) |
| CoOOH + H2O ↔ Co4+ + 3OH− + e− | (2) |
Fig. 4B presents the CVs of CoP/GCE at different scanning rates (1–200 mV s−1). The anodic peak shows a slight positive shift, while the cathodic peak moves negatively with the increase of the scan rate, indicating a quasi-reversible electron transfer reaction for the electrochemical reactions in eqn (1) and (2). Moreover, a continuous increase in anodic and cathodic peak currents occurs as the scanning rate is increased. The peak current for both the oxidation and the reduction is proportional to the scan rate, as depicted in Fig. 4C, implying that the electrochemical reaction on the surface of the CoP/GCE is a typical surface controlled process, which is ideal for electrochemical glucose sensing. Fig. 4D shows the CV change with successive additions of glucose to NaOH solution. After the addition of glucose to the test solution, the oxidation current of the test electrode increased, an indication that the reaction of glucose is catalyzed by the CoP-modified electrode.
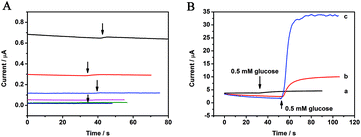
Fig. 5 displays the amperometric responses of 0.5 mM glucose on the bare GCE and the CoP-modified electrode at different applied potentials. It is clear that no response was observed below 0.8 V on the bare electrode. Only when the applied potential was higher than 0.9 V, a weak response current appeared, which indicated that the oxidation reaction of glucose on the bare electrode is a sluggish kinetic process with a large energy barrier. However, at the surface of the CoP-modified electrode, an obvious current response for 0.5 mM glucose was observed even at 0.3 V. With the increase of the test potential, the response current increased correspondingly. This suggests that CoP is a good electrochemical catalyst for the oxidation reaction of glucose. It is generally believed that nanomaterials act like an electron delivery system in the electrocatalytic process to accelerate the electron transfer and enhance the electrocatalytic ability of the biosensor. Further, the Coδ+ in CoP is easily self-oxidized to Co(III) in the electrochemical reaction process, and after the injection of glucose, the electrooxidation of glucose is mostly mediated by CoOOH/Co4+ in an alkaline solution (eqn (3) and (4)).
| CoOOH + OH− ↔ Co4+ + H2O + e− | (3) |
| Glucose + 2OH− → Gluconolactone + H2O + 2e− | (4) |
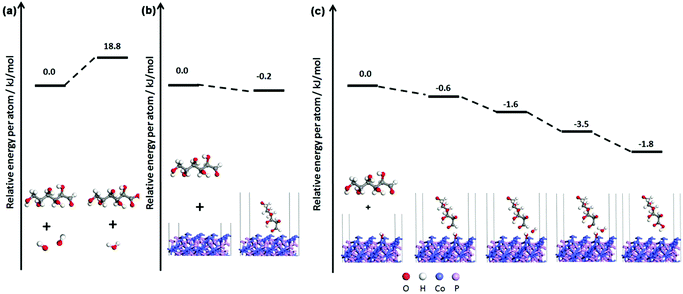
In order to better understand the electrocatalytic process of CoP to glucose, a theoretical study of the electrocatalytic process is carried out by density-functional theory (DFT) calculations. As observed from the XRD pattern and HRTEM of CoP in Fig. 1 and 3, respectively, the (011) crystal face is the lowest-index face of CoP that was observed. The exposed low-index facet with well-defined geometric and electronic structures could be well-exploited as the active spots for various types of reactions with enhanced catalytic activity. In NaOH solution, glucose, H2O, and OH− are considered as three reactive species on the CoP surface in the glucose electrocatalytic reaction process. According to the following calculated reaction energy diagram (shown in Scheme 1), the reaction of glucose with OH− is far easier than that of glucose with H2O. Additionally, the adsorption energy of glucose on the CoP surface is stronger than that on the OH-covered CoP surface. In NaOH solution, the surface of CoP would be negatively charged and easily covered by OH−. Hence, we proposed that the main electrocatalytic reaction was controlled by the adsorbed structure of glucose on the OH-covered CoP (011) surface. The calculated reaction energy diagram is shown in Scheme 1c. In the reaction system, a hydrogen bond formed between glucose and OH-covered CoP and another OH− in the solution; the water molecule was formed by proton transfer from the –CHO group of glucose to OH− in the alkaline solution. The gluconic acid was produced by the transfer of OH− from the CoP surface without any transition states.26
The anti-interference performance towards other physiological species is one of the biggest concerns of the glucose electrochemical sensor. The test potential has a large influence on the anti-interference ability of the sensor. As shown in Fig. 6, the response currents of 0.05 mM ascorbic acid (AA), dopamine (DA), and uric acid (UA) did not increase and were far lower than that of glucose, especially when a low potential of 0.3 V was applied. This suggests that these species had no obvious interference in the oxidation of glucose in our designed biosensor. However, the response of glucose also weakened at 0.3 V, which suggests that 0.4 V is a suitable potential for CoP/GCE to detect glucose.
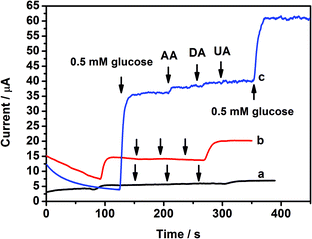 | ||
| Fig. 6 The current responses of CoP/GCE for glucose and the interfering species (a) at 0.3 V, (b) 0.4 V, and (c) 0.5 V. | ||
After analyzing the electrocatalytic mechanism and feasibility of CoP for detecting glucose, the biosensing performance of the CoP-based biosensor was further evaluated. Fig. 7A displays the amperometric responses of CoP/GCE for successive additions of 0.5 mM glucose to the electrolyte under stirring at an applied potential of 0.4 V. The calibration curves of response (Fig. 7B) show a linear response with a correlation coefficient of 0.98, and the linear range increased to 5.5 mM. Simultaneously, the sensitivity was about 116.8 μA (cm2 mM)−1, and the limit of detection was 9 μM.
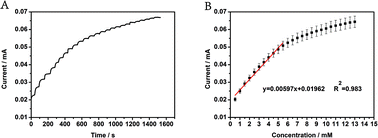 | ||
| Fig. 7 (A) The amperometric response of CoP/GCE for glucose at an applied potential of 0.4 V. (B) The linear fitting of the amperometric response. | ||
Conclusions
In this work, cobalt phosphide was analyzed as a new biosensing material for the detection of glucose. TEM characterization suggests that the surface of CoP is rough and porous, which causes more crystal faces to be exposed in electrolyte solution and benefits the diffusion of glucose in the electrode material. In order to thoroughly understand the electrocatalytic reaction mechanism, electrochemical measurements and theoretical calculations were carried out in detail. In an alkaline solution, the reaction barrier from the direct adsorption of glucose on the electrode surface was relatively high. The first transition state for OH− transfer from the electrode surface to the –CHO group of glucose is the rate-determining step. The electrochemical results indicate that CoP nanorods can accelerate the electron transfer to glucose and significantly enhance the electrocatalytic ability of a biosensing electrode.Acknowledgements
This work was financially supported by Fundamental Research Funds for the Central Universities (XDJK2015D030), the National Natural Science Foundation of China (21163021, 21203154, 31200700, 21375108), the Program for Excellent Talents in Chongqing (102060-20600218), and Chongqing Key Laboratory for Advanced Materials and Technologies of Clean Energies. Computational resources have been provided by HPC of Faculty of Materials and Energy in Southwest University.References
- F. Gao, F. Luo, X. Chen, W. Yao, J. Yin, Z. Yao and L. Wang, Talanta, 2009, 80, 202–206 CrossRef CAS PubMed
.
- V. Scognamiglio, Biosens. Bioelectron., 2013, 47, 12–25 CrossRef CAS PubMed
.
- C. A. Marquette and L. C. J. Blum, Anal. Chim. Acta, 1999, 381, 1–10 CrossRef CAS
.
- H. V. Hsieh, Z. A. Pfeiffer, T. J. Amiss, D. B. Sherman and J. B. Pitner, Biosens. Bioelectron., 2004, 19, 653–660 CrossRef CAS PubMed
.
- J. Wang, Chem. Rev., 2008, 108, 814–825 CrossRef CAS
.
- A. S. Kumar, P. Y. Chen, S. H. Chien and J. M. Zen, Electroanalysis, 2005, 17, 210–222 CrossRef CAS
.
- S. Park, H. Boo and T. D. Chung, Anal. Chim. Acta, 2006, 556, 46–57 CrossRef CAS PubMed
.
- A. Salimi and M. Roushani, Electrochem. Commun., 2005, 7, 879–887 CrossRef CAS
.
- Y. Xian, Y. Hu, F. Liu, Y. Xian, H. Wang and L. Jin, Biosens. Bioelectron., 2006, 21, 1996–2000 CrossRef CAS PubMed
.
- J.-S. Ye, C.-W. Chen and C.-L. Lee, Sens. Actuators, B, 2015, 208, 569–574 CrossRef CAS
.
- D. Zhai, B. Liu, Y. Shi, L. Pan, Y. Wang, W. Li, R. Zhang and G. Yu, ACS Nano, 2013, 7, 3540–3546 CrossRef CAS PubMed
.
- X. Kang, Z. Mai, X. Zou, P. Cai and J. Mo, Anal. Biochem., 2007, 363, 143–150 CrossRef CAS PubMed
.
- L.-C. Jiang and W.-D. Zhang, Biosens. Bioelectron., 2010, 25, 1402–1407 CrossRef CAS PubMed
.
- S. Ci, T. Huang, Z. Wen, S. Cui, S. Mao, D. A. Steeber and J. Chen, Biosens. Bioelectron., 2014, 54, 251–257 CrossRef CAS PubMed
.
- J. Wu, Q. Wang, A. Umar, S. Sun, Y. Gao, J. Wang, L. Huang and Z. Guo, Sens. Lett., 2014, 12, 69–74 CrossRef CAS
.
- J. Chen, W.-D. Zhang and J.-S. Ye, Electrochem. Commun., 2008, 10, 1268–1271 CrossRef CAS
.
- Q. Liu, J. Tian, W. Cui, P. Jiang, N. Cheng, A. M. Asiri and X. Sun, Angew. Chem., Int. Ed., 2014, 53, 6710–6714 CrossRef CAS PubMed
.
- J. Tian, Q. Liu, A. M. Asiri and X. Sun, J. Am. Chem. Soc., 2014, 136, 7587–7590 CrossRef CAS
.
- Z. Pu, Q. Liu, P. Jiang, A. M. Asiri, A. Y. Obaid and X. Sun, Chem. Mater., 2014, 26, 4326–4329 CrossRef CAS
.
- P. Hohenberg and W. Kohn, Phys. rev., 1964, 136, B864 CrossRef
.
- J. P. Perdew, K. Burke and M. Ernzerhof, Phys. Rev. Lett., 1996, 77, 3865 CrossRef CAS PubMed
.
- P. Jiang, Q. Liu, C. Ge, W. Cui, Z. Pu, A. M. Asiri and X. Sun, J. Mater. Chem. A, 2014, 2, 14634–14640 CAS
.
- Z. Huang, Z. Chen, Z. Chen, C. Lv, M. G. Humphrey and C. Zhang, Nano Energy, 2014, 9, 373–382 CrossRef CAS
.
- W. Hu, L. Wang, Q. Wu and H. Wu, Adv. Powder Technol., 2014, 25, 1780–1785 CrossRef CAS
.
- Y. Ding, Y. Wang, L. Su, M. Bellagamba, H. Zhang and Y. Lei, Biosens. Bioelectron., 2010, 26, 542–548 CrossRef CAS PubMed
.
- T. Ishimoto, H. Kazuno, T. Kishida and M. Koyama, Solid State Ionics, 2014, 262, 328–331 CrossRef CAS
.
| This journal is © The Royal Society of Chemistry 2016 |

