DOI:
10.1039/C5AN02019K
(Paper)
Analyst, 2016,
141, 311-318
A novel approach to the consecutive extraction of drugs with different properties via on chip electromembrane extraction
Received
30th September 2015
, Accepted 16th November 2015
First published on 17th November 2015
Abstract
In the present research, for the first time, a consecutive on chip electromembrane extraction coupled with high performance liquid chromatography was introduced for the analysis of betaxolol (Bet), naltrexone (Nalt) and nalmefene (Nalm) as model analytes with different chemical properties from biological samples. The chip consists of two polymethyl methacrylate (PMMA) parts where two microfluidic channels are carved in each part. These channels were used as a flow path for the sample solution and a thin compartment for the acceptor phase. A porous polypropylene sheet membrane impregnated with an organic solvent was placed between two parts of the chip device in order to separate the channels. Two platinum electrodes were bent at the bottom of these channels that are connected to a power supply providing the electrical driving force for migration of ionized analytes from the sample solution through the porous sheet membrane into the acceptor phase. The new setup provides effective and reproducible extractions by using a low volume of sample solution. Efficient parameters on consecutive electromembrane extraction of the model analytes were optimized by using the one variable at a time method. Under the optimized conditions, the new setup offered a good linearity in the range of 10.0–500 μg L−1 with coefficient of determination (R2) higher than 0.9932. The relative standard deviation (RSD%) and LOD values were less than 6.8% based on four replicate measurements and 10.0 μg L−1 for the model analytes, respectively. The preconcentration factors higher than 15.6-fold were obtained. Finally, the proposed method was successfully applied for determination and quantification of the model analytes in biological samples.
Introduction
Sample preparation has a unique meaning and special importance in the field of analytical chemistry. For several decades, liquid–liquid extraction (LLE) has been employed for sample preparation prior to analysis by high performance liquid chromatography and gas chromatography.1–5 Recent developments in sample preparation are directed toward down scaling and automation of conventional extraction methods by decreasing the acceptor-to-donor ratio in order to reduce organic solvent, sample solution and chemical reagent consumption.6 Liquid phase microextraction (LPME) is a miniaturization of the traditional LLE that performed in several modes such as single drop microextraction, dispersive liquid–liquid microextraction, porous membrane based LPME and solidification of floating organic droplet.7–13 Electromembrane extraction (EME) is one of the LPME methods that was introduced by Pedersen-Bjergaard and coworkers in 2006.14 In this method, the mass transfer is carried out through an organic solvent immobilized within the pores of a porous membrane by applying an electrical potential difference, as the driving force, between two platinum electrodes placed on both sides of the porous membrane in the donor and acceptor phases. EME has numerous advantages in comparison with other liquid phase microextraction and provides more efficient, fast, very selective extractions and excellent sample cleanup.15
In addition to miniaturization of extraction techniques, downscaling of extraction devices has an important role in decrease of the organic solvent, sample solution and chemical reagent consumption. Miniaturization of analytical methods and instruments for extraction research is an area of burgeoning interest. In many cases, the reduction in the size of the analytical procedure or technique often translates to a reduction in analysis time and costs. Miniaturized devices integrate sample preparation, separation and detection on a single small chip.16–18 A miniaturized and portable device is more preferable for the on-site and rapid analysis application.
The combination of microfluidic technologies and EME would be suitable for such applications. For the first time, on chip electromembrane extraction (EME) as one type of miniaturized membrane based LPME techniques was introduced by Petersen and coworkers in 2010.19 In this technique, a piece of porous membrane is used as the support for the water–immiscible organic solvent. Afterwards, several reports have been emerged on implementation of EME as chip based devices to affect more developments in this field.20–23
In all of the reported papers using chip devices, one extraction chamber has been used for extraction. Therefore, analytes with different properties including hydrophilicity, polarity and functional groups cannot be extracted with these devices. By considering the polarity of various analytes, different supported liquid membrane (SLM) compositions are required to extract the target analytes. Addition of a carrier into the SLM composition has different effects on the extraction of analytes. It has been demonstrated that the use of carriers in the SLM composition has a strong negative effect on the extraction of nonpolar drugs such as betaxolol (Bet).24,25 However, the presence of di-(2-ethylhexyl)phosphate (DEHP) as an anionic ion pairing reagent is necessary for the extraction of compounds such as naltrexone (Nalt) and nalmefene (Nalm).26 Therefore, Bet could be extracted by the use of only pure 2-nitrophenyl octyl ether (NPOE) as the SLM, whereas for the extraction of Nalm and Nalt a mixture of NPOE and DEHP is required. Consequently, the simultaneous extraction of these analytes is impossible.
In the current paper, a consecutive electromembrane extraction chip as a new on chip EME setup was introduced for the extraction and determination of Nalt, Nalm and Bet from biological samples. The used analytes were selected as model compounds with different physicochemical properties to show the ability of the proposed technique for simultaneous extraction of analytes with different chemical properties. In fact, the physicochemical properties of analytes are important keys for the selection of membrane organic solvents so that with the selection of a specific composition of membrane organic solvent selective extraction can be achieved in EME.24 The proposed method provides the possibility of using different compositions of membrane organic solvent and thus simultaneous extraction of different analytes with different chemical properties. As is well known, many combination drugs, used today, which are a mixture of two or more drugs, are used by patients. On the other hand a patient may use several drugs, simultaneously. The proposed method can be used as an efficient sample preparation method because it provides the simultaneous analysis possibility of all drugs by a little volume of a biological sample whereas by other techniques separated samples, and consequently larger volumes of biological samples, should be used for analysis of analytes with different physicochemical properties. Here, two extraction chambers were employed in which anode and cathode electrodes embedded at the bottom of the microfluidic extraction channels, and SLMs were separately optimized for each class of analytes. As a result, the proposed system offers suitable conditions for the consecutive extraction of Bet, Nalt and Nalm as model analytes and can be applied for the extraction of other compounds with similar properties. Effects of different variables on the extraction efficiency of the analytes were studied and optimized. After optimization, the method followed by high-performance liquid chromatography-ultraviolet detection (HPLC-UV) was applied for the extraction and determination of Bet, Nalt and Nalm in human urine and plasma samples.
Experimental
Chemicals and reagents
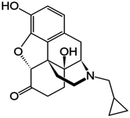
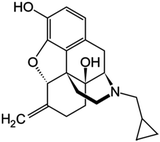
Betaxolol was kindly donated by Sina Darou (Tehran, Iran). Nalmefene and naltrexone were obtained from Parand Darou (Tehran, Iran). Chemical structures, pKa and log![[thin space (1/6-em)]](https://www.rsc.org/images/entities/char_2009.gif) P, where P is the octanol–water partition coefficient, of the analytes, are reported in Table 1. 2-Nitrophenyl octyl ether (NPOE), 2-nitrophenyl phenylether (NPPE), tris-(2-ethylhexyl)phosphate (TEHP) and di-(2-ethylhexyl)phosphate (DEHP) were purchased from Fluka (Buchs, Switzerland). All of the chemicals used were analytical-reagent grade. The Accurel 2E HF (R/P) polypropylene membrane sheet was supplied by Membrana (Wuppertal, Germany) with a thickness of 150 μm, and pore size of 0.2 μm. Ultrapure water was prepared by using a Younglin 370 series aqua MAX purification instrument (Kyounggi-do, Korea).
P, where P is the octanol–water partition coefficient, of the analytes, are reported in Table 1. 2-Nitrophenyl octyl ether (NPOE), 2-nitrophenyl phenylether (NPPE), tris-(2-ethylhexyl)phosphate (TEHP) and di-(2-ethylhexyl)phosphate (DEHP) were purchased from Fluka (Buchs, Switzerland). All of the chemicals used were analytical-reagent grade. The Accurel 2E HF (R/P) polypropylene membrane sheet was supplied by Membrana (Wuppertal, Germany) with a thickness of 150 μm, and pore size of 0.2 μm. Ultrapure water was prepared by using a Younglin 370 series aqua MAX purification instrument (Kyounggi-do, Korea).
Table 1 Chemical structures, pKa and log![[thin space (1/6-em)]](https://www.rsc.org/images/entities/char_2009.gif) P of the model analytes
P of the model analytes
| Name |
Chemical structure |
pKa |
Log![[thin space (1/6-em)]](https://www.rsc.org/images/entities/char_2009.gif) P P |
|
Ref. 34. |
| Betaxolol |

|
9.67 |
2.54 |
| Naltrexone |
|
8.88 |
1.36 |
| Nalmefene |
|
9.57 |
1.95 |
A stock solution containing 2.0 mg mL−1 of Bet, Nalt and Nalm was prepared in methanol. All standard solutions were stored at 4 °C which is protected from light. Working standard solutions were prepared daily by dilution of the stock solutions with ultrapure water.
Real samples
Urine sample.
To plot the calibration curves and to obtain figures of merit, a human urine sample was collected from a 29-year-old healthy adult male volunteer. The sampling procedure was performed according to the guidelines for research ethics. The protocol was approved by an Internal Review Board. Moreover, written consent was obtained from volunteers prior to the experiment. The sample was filtered through a 0.45 μm pore size cellulose acetate filter from Millipore (Madrid, Spain). The filtrate was collected in a glass vial, which was carefully cleaned with hydrochloric acid and washed with deionized water and stored at 4 °C to prevent bacterial growth and proteolysis. The urine sample was diluted 1![[thin space (1/6-em)]](https://www.rsc.org/images/entities/char_2009.gif) :
:![[thin space (1/6-em)]](https://www.rsc.org/images/entities/char_2009.gif) 4 with ultra-pure water and the pH value was adjusted to 7.00 by adding appropriate amounts of hydrochloric acid (100 mM) and/or sodium hydroxide (100 mM) solutions. Then, the urine sample was spiked with a mixed standard solution to obtain the desired concentration. One milliliter of the sample solution was subsequently subjected to the on chip EME procedure. A further urine sample was obtained from a healthy volunteer (29-year-old).
4 with ultra-pure water and the pH value was adjusted to 7.00 by adding appropriate amounts of hydrochloric acid (100 mM) and/or sodium hydroxide (100 mM) solutions. Then, the urine sample was spiked with a mixed standard solution to obtain the desired concentration. One milliliter of the sample solution was subsequently subjected to the on chip EME procedure. A further urine sample was obtained from a healthy volunteer (29-year-old).
Plasma sample.
A frozen drug-free human plasma sample (blood group B+) was obtained from the Iranian Blood Transfusion Organization (Tehran, Iran). Prior to use, the plasma sample was allowed to thaw at room temperature. According to the literature, trifluoroacetic acid (TFA) is a suitable reagent for protein precipitation and decreasing the matrix effect of real samples such as human plasma.27 To this end, four drops of concentrated TFA (99 w/w%) were added into 10 mL of each plasma sample and centrifuged for 5 minutes at 3000 rpm, afterwards. Finally, the supernatant sample solutions were transferred to a glass container and stored at 4 °C for subsequent experiments. The pH of 5-fold diluted human plasma samples with ultra-pure water was adjusted to 7.0 using the appropriate amounts of hydrochloric acid (100 mM) and/or sodium hydroxide (100 mM) solutions. Then, the plasma sample was spiked with a mixed standard solution to obtain the desired concentration. One milliliter of the sample solution was subsequently subjected to the on chip EME procedure.
Chromatographic apparatus
The chromatographic equipment consisted of an Agilent 1260 HPLC system, including a quaternary pump, degasser, and UV-Vis detector (Waldbronn, Germany). Chromatographic data were recorded and analyzed by using ChemStation for LC systems software (version B.04.03). The separations were performed on an ODS-3 column (150 mm × 4.6 mm, with a particle size of 5 μm) from MZ-Analysentechnik (Mainz, Germany) via an isocratic elution at a flow rate of 1.0 mL min−1. For Bet, Nalt and Nalm, the mobile phase consisted of 10 mM phosphate buffer (pH = 8.0) and acetonitrile (55![[thin space (1/6-em)]](https://www.rsc.org/images/entities/char_2009.gif) :
:![[thin space (1/6-em)]](https://www.rsc.org/images/entities/char_2009.gif) 45) respectively for 15 minutes. The detector wavelength was set at 215 nm.
45) respectively for 15 minutes. The detector wavelength was set at 215 nm.
Manufacture of the on chip EME device
The structure of the consecutive chip device for electromembrane extraction is shown in Fig. 1. The chip consists of two polymethyl methacrylate (PMMA) parts. In each part two long channels with a length of 30 mm, depth of 200 μm and width of 1.0 mm was carved. As shown in Fig. 1, the channels, which were carved in the upper part, acted as acceptor phase channels, whereas the other two channels located in the lower part are a flow path for the donor solution. Moreover, in each part of the consecutive chip device, six individual holes (with an I.D. of 0.5 mm) were drilled. The holes “a” and “f” were connected to inlet and outlet tubes whereas the holes “b” and “d” were used for the entrance of platinum electrodes. Holes “c” and “e” were connected together to deliver extraction solutions from one extraction chamber to the other one. In each part of the consecutive chip device, two platinum electrodes were bent and mounted at the bottom of each channel along with its length after passing through the holes “b” and “d”. All channels and holes were milled using a CNC micromilling machine model SMG-302 CNC milling from Sadrafan Gostar Industries (Tehran, Iran). The channels of the sample solution and acceptor phase were separated with two separated small pieces of porous polypropylene sheet membrane during extraction which was impregnated with suitable organic solvents with regard to the physicochemical properties of the model analytes. The sheet membranes were located between the two parts along the lengths of the channels and fixed using four bolts and nuts during the extraction procedure. After each extraction step, the porous sheet membrane was replaced with a new one. The sample solution was flowed toward the inlet of the sample channel by using a syringe pump. In addition, a microsyringe was used for introducing and withdrawing of a microliter volume of acceptor solution into the acceptor phase channel.
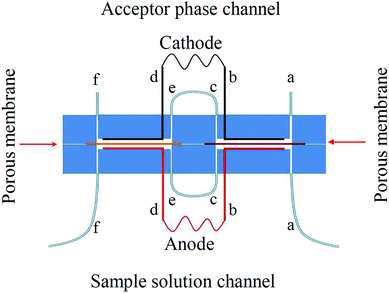 |
| | Fig. 1 Schematic illustration of a consecutive on chip EME extraction cell with two extraction chambers. | |
Consecutive on chip EME procedure
One milliliter of the sample solution containing the target analytes was filled into a Hamilton syringe and then the syringe was mounted on a syringe pump. To impregnate the organic solvent into the pores of the sheet membrane, two 3 mm × 4 cm pieces of the porous membrane were cut and dipped into suitable organic solvents for 5 s and then the excess organic solution was gently wiped away by using a piece of Kleenex. Then, the membranes were carefully placed between two parts of the chip device. The upper and lower parts of the chip were fixed together using bolts and nuts. Thirty microliters of 100 mM HCl (acceptor solution) were introduced into the acceptor channel by a using microsyringe. The donor phase was pumped through the donor channel using a syringe pump. When the extraction was completed, the acceptor solution was collected by using a microsyringe and injected into the HPLC injection loop. After each extraction, the channels of the sample solution and acceptor phase were washed by ultrapure water and a new porous membrane impregnated with suitable organic solvent was located and fixed between the two parts of the extraction chip device for subsequent experiment. Fig. 2 illustrates the extraction process, schematically.
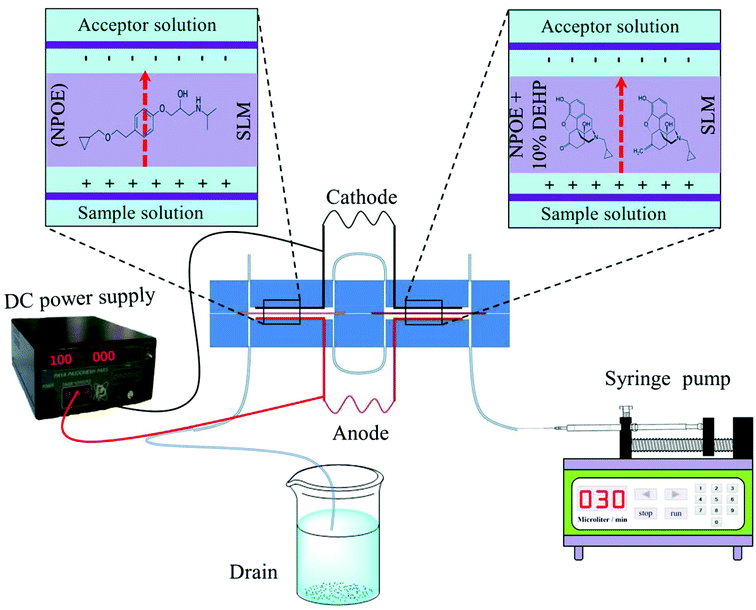 |
| | Fig. 2 Schematic illustration of consecutive on chip EME procedure. | |
Calculation of preconcentration factor, extraction recovery, and relative recovery
The preconcentration factor (PF) was defined as the ratio of the final analyte concentration in the acceptor phase (Cf,a) and the initial concentration of the analyte (Ci,s) in the sample solution:| |  | (1) |
where Cf,a was calculated from a calibration graph obtained from direct injection of standard solutions of the analytes. The extraction recovery (ER%) was defined as the percentage of the number of moles of the analyte extracted into the acceptor phase (nf,a) with respect to the number of moles originally present into the sample solution (ni,s):| |  | (2) |
| |  | (3) |
where Vf,a and Vi,s are the volumes of the acceptor phase and sample solution, respectively. The relative recovery (RR%) was calculated by the following equation:| |  | (4) |
where Cfound, Creal, and Cadded are the concentrations (μg L−1) of analyte after adding a known amount of standard into the real sample, the concentration of analyte in the real sample, and the concentration of a known amount of standard, which was spiked into the real sample, respectively.
Results and discussion
Selection of supported liquid membrane
Composition of the organic solvent which was used as the SLM has an important role in EME. A suitable liquid membrane enhances the extraction efficiency and selectivity. The composition of membrane affects the diffusion coefficient of analyte. Furthermore, the range of applied voltage is determined by the nature of SLM composition. Considering the above points, some organic solvents such as 2-nitrophenyl octyl ether (NPOE), NPOE containing 5, 10 and 15% (v/v) di-(2-ethylhexyl)phosphate (DEHP), NPOE containing 5, 10 and 15% (v/v) tris-(2-ethylhexyl)phosphate (TEHP) and NPOE containing 5% TEHP and 5% DEHP were investigated as SLM for the consecutive on chip EME. As shown in Fig. 3A, NPOE containing 10% DEHP represented higher extraction efficiency for Nalt and Nalm where suitable extraction efficiency for Bet was provided when pure NPOE was used as SLM. Thus, NPOE containing 10% DEHP and NPOE were selected as the optimum SLM compositions for the subsequent experiments.
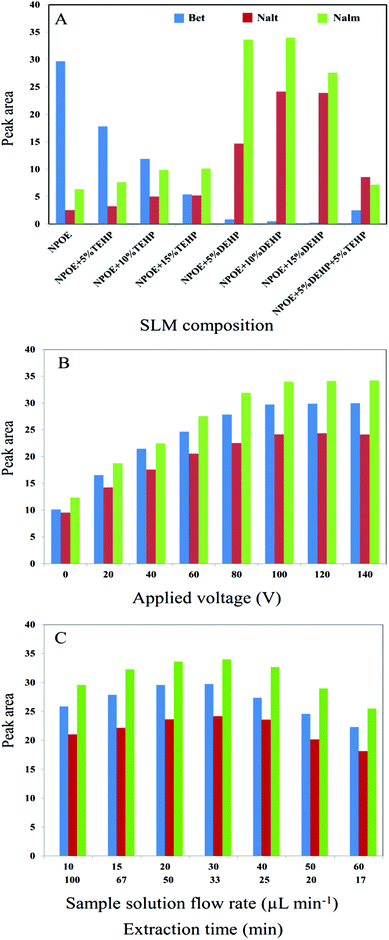 |
| | Fig. 3 Optimization of (A) SLM composition, (B) applied voltage, (C) sample solution flow rate and extraction time for Bet, Nalt and Nalm using consecutive on chip EME. | |
Effect of sample solution and acceptor phase compositions
The pH levels of the sample solution and acceptor phase are critical parameters in the extraction efficiency of consecutive on chip EME. In EME, the electrokinetic migration of the analytes across the SLM into the acceptor solution is affected by ion balance which is defined as the ratio of the total ionic concentration in the sample solution to that in the acceptor solution.28 In EME, for basic analytes, ion balance is mainly considered as the ratio of HCl concentration in the sample solution to the acceptor phase.29 Based on previous studies on the role of ion balance, it was anticipated that decrease of ion balance leads to an increase in the flux of ions through SLM. Therefore, for a basic drug, the extraction efficiency is increased by increasing the HCl concentration in the acceptor phase and its decrease in the sample solution. It can be attributed to the fact that increase of the HCl concentration in the acceptor phase not only avoids partial deprotonation of the analyte and its back-diffusion into SLM but also, accelerates the analyte release from SLM into the acceptor solution. On the other hand, for extraction of the basic analytes into the acceptor phase, acidification of the sample solution is performed to keep the targeted compounds in their ionized form. However, there are some limitations for increasing HCl concentration in both the donor and acceptor phases. By applying an electrical field in EME, cations migrate toward the cathode and anions migrate toward the anode through the SLM. Increasing content of ions in each of the donor and acceptor phases results in increasing number of ions migrating through SLM at a given moment, it causes increase of the current level, increase of Joule heating and therefore instability of SLM. Increase of the current level between electrodes increases electrolysis reactions on the surfaces of electrodes and therefore bubble formation risk. Bubble formation increases uncertainties in the obtained data for EME. According to the previous EME studies that were carried out for extraction of these model analytes,24–26 10.0 mM and 100.0 mM of HCl were selected as donor and acceptor solutions, respectively.
Effect of applied voltage
In EME, the electrical field, which is provided by applying an electrical potential between two platinum electrodes, stimulates the transfer of analytes through the SLM into the acceptor phase. Therefore, mass transfer is greatly dependent on the electrical field so that it is expected that extraction efficiency can be increased by increasing the applied voltage. However, at high applied voltages, several problems such as bubble formation due to the electrolysis process, SLM punctuation, and sparking may occur.29 Therefore, selecting an optimum applied voltage is necessary to succeed in electromembrane extraction. Hence, a series of experiments with various extraction voltages in the range of 0–140 V were performed to determine the most suitable voltage while 10 mM HCl and 100 mM HCl were used as the donor and acceptor solutions, respectively, for 30 min. As shown in Fig. 3B, relatively high peak areas were obtained at a voltage of 100 V. Therefore, an electrical potential of 100 V was applied for future experiments.
Effect of sample volume
Sampling is one of the main problems related to the analysis of biological real samples. Except urine, preparing a sample with large volumes for other biological samples is difficult. The main purpose for design and construction of a consecutive on chip EME was low consumption of sample solution. In the current research, by considering the above reasons, 1.0 mL of sample solution was selected for the subsequent experiments.
Effect of sample solution flow rate and extraction time
A syringe pump was used to pump the sample solution into the on chip EME device. The flow rate of the sample solution plays an essential role in increasing the kinetics and efficiency of extraction by delivering a sample solution into the extraction chambers, increasing the mass transfer and decreasing the thickness of the double layer around SLM.30,31 Various sample flow rates in the range of 10–60 μL min−1 were examined. As shown in Fig. 3C, extraction efficiency increased by increasing the sample flow rate from 10 to 30 μL min−1, whereas a decrease was observed with further increase of the flow rate. When the sample flow rate is increased considerably, the target analysts do not have enough time to pass through the SLM into the acceptor phase. Also, perforation in the porous membrane as well as loss of impregnated organic solvents into the pores of porous membrane sheets were observed at high sample flow rates.
Fig. 3C also illustrates the effect of extraction time on the extraction efficiency. Extraction time depends on the sample flow rate, inversely. Therefore, extraction time and sample flow rate was investigated together. As can be seen, extraction time is increased by decrease of the sample flow rate. But, stability of SLM is decreased at long extraction durations. When the sample solution is pumped at low flow rates, accumulation of the ions around SLM is increased which leads to increase of the charge density of the double layer; increase of electrokinetic migration of ions through SLM; increased Joule heating and consequently instability of SLM. Therefore, 30 μL min−1 was selected as the optimum sample flow rate.
Method evaluation
To verify the practical applicability of the proposed technique, figures of merit of the proposed method were studied by using standard solutions of the analytes in drug-free plasma and urine samples. Optimal conditions were applied to find out linearity, repeatability, and LODs of this method that is summarized in Table 2. The calibration curves were linear in the range of 10.0–500 μg L−1 with a coefficient of determination (R2) more than 0.9932. The relative standard deviations (RSD%) for extraction and determination of the model analytes were less than 6.8% based on four replicate measurements. LODs less than 10.0 μg L−1 were observed for the target analytes. PF values higher than 15.6-fold were obtained for the extraction of Bet, Nalt and Nalm at a concentration level of 100 μg L−1. According to Clarke's analysis of drugs and poisons,32 the serum therapeutic concentration range for Bet is 5 to 50 μg L−1. After a single oral dose of 100 mg to four subjects, peak plasma concentrations of 10 to 60 (mean 40) μg L−1 of naltrexone were attained in 1 to 2 h. The peak plasma concentrations of 24 healthy males administrated with Nalt, aged between 19 and 46 years, were in the range of 12–110 μg L−1. Consequently, the proposed method can be applied for extraction and determination of low levels of Nalm, Nalt and Bet from biological fluids.
Table 2 Figures of merit of consecutive on chip EME for extraction of Bet, Nalt and Nalm
| Sample |
Analytes |
LOD (μg L−1) |
LOQ (μg L−1) |
Linearity (μg L−1) |
R
2
|
PFa |
RSD%b |
|
Preconcentration factor at 100 μg L−1.
Based on four-replicate measurements.
|
| Urine |
Bet |
3.0 |
10.0 |
10.0–500 |
0.9958 |
17.1 |
4.2 |
|
|
Nalt |
3.0 |
10.0 |
10.0–500 |
0.9997 |
18.9 |
5.4 |
|
|
Nalm |
2.0 |
5.0 |
5.0–500 |
0.9991 |
19.5 |
4.8 |
| |
| Plasma |
Bet |
5.0 |
10.0 |
10.0–500 |
0.9932 |
15.6 |
5.4 |
|
|
Nalt |
5.0 |
10.0 |
10.0–500 |
0.9974 |
17.5 |
5.6 |
|
|
Nalm |
3.0 |
10.0 |
10.0–500 |
0.9942 |
18.9 |
6.8 |
Application of the proposed method for analysis of real samples
In order to illustrate the performance of the consecutive on chip EME, the procedure was used for extraction and determination of Bet, Nalt and Nalm in urine and plasma samples. The obtained results are presented in Table 3. As can be seen, the model analytes were not found in the investigated urine and plasma samples. Therefore, urine and plasma samples were spiked with 100 μg L−1 of Bet, Nalt and Nalm. The relative errors for extraction and determination of the model analytes in urine and plasma samples were less than 5.2%. According to the literature, the mean recovery will be within 90 to 110% (or relative error% between −10% and +10%).33 Therefore, the results showed that this method is applicable for the real samples. Fig. 4 shows the typical chromatograms of the extracted model analytes from urine and plasma samples before and after spiking with 100 μg L−1 of Bet, Nalt and Nalm.
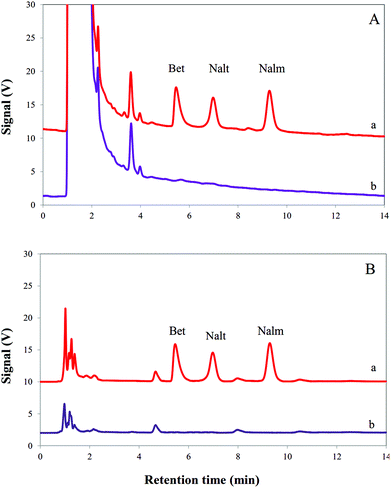 |
| | Fig. 4 Typical HPLC chromatograms obtained using the consecutive on chip EME procedure for (A) a urine sample and (B) a plasma sample after (a) and before (b) being spiked with Bet, Nalt and Nalm at a concentration level of 100 μg L−1. | |
Table 3 Determination of Bet, Nalt and Nalm in real samples using consecutive on chip EME
| Sample |
Analyte |
C
real (μg L−1) |
C
added (μg L−1) |
C
found (μg L−1) |
RSD% (n = 4) |
Error% |
|
Not detected.
|
| Urine |
Bet |
nda |
100.0 |
96.8 |
4.6 |
−3.2 |
|
|
Nalt |
nd |
100.0 |
96.1 |
5.1 |
−3.9 |
|
|
Nalm |
nd |
100.0 |
103.9 |
4.9 |
+3.9 |
| |
| Plasma |
Bet |
nd |
100.0 |
95.1 |
5.3 |
−4.9 |
|
|
Nalt |
nd |
100.0 |
94.8 |
6.2 |
−5.2 |
|
|
Nalm |
nd |
100.0 |
104.2 |
5.1 |
+4.2 |
Conclusions
In the present paper, for the first time, a consecutive on chip EME extraction device was introduced for the analysis of trace amounts of Bet, Nalt and Nalm as model analytes from low volumes of urine and plasma samples. The effect of various variables affecting the extraction efficiency of the on chip EME procedure was investigated and optimized. Making the extraction possible from low volumes of biological fluids, providing considerable sample cleanup and acceptable LODs are the advantages that can account for the use of the proposed method. The results indicated that the consecutive on chip EME may be a good alternative for drug analysis from biological samples.
References
- H. Ebrahimzadeh, Y. Yamini, F. Kamarei and S. Shariati, Anal. Chim. Acta, 2007, 594, 93–100 CrossRef CAS PubMed.
- M. Rezaee, Y. Yamini, M. Moradi, A. Saleh, M. Faraji and M. H. Naeeni, J. Supercrit. Fluids, 2010, 55, 161–168 CrossRef CAS.
- M. H. Naeeni, Y. Yamini and M. Rezaee, J. Supercrit. Fluids, 2011, 57, 219–226 CrossRef CAS.
- S. Seidi, Y. Yamini and M. Rezazadeh, J. Chromatogr., B: Biomed. Appl., 2013, 913–914, 138–146 CrossRef CAS PubMed.
- H. Chen, Q. Fang, X.-F. Yin and Z.-L. Fang, Lab Chip, 2005, 5, 719–725 RSC.
- A. Sarafraz-Yazdi and A. Amiri, TrAC, Trends Anal. Chem., 2010, 29, 1–14 CrossRef CAS.
- Y. Ke, W. Li, Y. Wang, X. Hao, R. Jiang, F. Zhu and G. Ouyang, Microchem. J., 2014, 117, 187–193 CrossRef CAS.
- H. Ebrahimzadeh, Y. Yamini, A. Gholizade, A. Sedighi and S. Kasraee, Anal. Chim. Acta, 2008, 626, 193–199 CrossRef CAS PubMed.
-
Y. Assadi, M. A. Farajzadeh and A. Bidari, in Comprehensive Sampling and Sample Preparation, ed. J. Pawliszyn, Academic Press, Oxford, 2012, pp. 181–212 Search PubMed.
- Y.-H. Jian, Y. Hu, T. Wang, J.-L. Liu, C. Zhang and Y. Li, Chin. J. Anal. Chem., 2010, 38, 62–66 CrossRef CAS.
- M.-I. Leong and S.-D. Huang, J. Chromatogr., A, 2009, 1216, 7645–7650 CrossRef CAS PubMed.
- M. R. Khalili Zanjani, Y. Yamini, S. Shariati and J. Å. Jönsson, Anal. Chim. Acta, 2007, 585, 286–293 CrossRef CAS PubMed.
- T. Honda, M. Miyazaki, Y. Yamaguchi, H. Nakamura and H. Maeda, Lab Chip, 2007, 7, 366–372 RSC.
- S. Pedersen-Bjergaard and K. E. Rasmussen, J. Chromatogr., A, 2006, 1109, 183–190 CrossRef CAS PubMed.
- Y. A. Asl, Y. Yamini, M. Rezazadeh and S. Seidi, Anal. Methods, 2015, 7, 197–204 RSC.
- Z.-X. Cai, Q. Fang, H.-W. Chen and Z.-L. Fang, Anal. Chim. Acta, 2006, 556, 151–156 CrossRef CAS PubMed.
- A. Berduque, J. O'Brien, J. Alderman and D. W. M. Arrigan, Electrochem. Commun., 2008, 10, 20–24 CrossRef CAS.
- H. Shen and Q. Fang, Talanta, 2008, 77, 269–272 CrossRef CAS PubMed.
- N. Petersen, H. Jensen, S. Hansen, S. Foss, D. Snakenborg and S. Pedersen-Bjergaard, Microfluid. Nanofluid., 2010, 9, 881–888 CrossRef CAS.
- N. J. Petersen, J. S. Pedersen, N. N. Poulsen, H. Jensen, C. Skonberg, S. H. Hansen and S. Pedersen-Bjergaard, Analyst, 2012, 137, 3321–3327 RSC.
- S. Seidi, M. Rezazadeh, Y. Yamini, N. Zamani and S. Esmaili, Analyst, 2014, 139, 5531–5537 RSC.
- B. Li, N. J. Petersen, M. D. R. Payán, S. H. Hansen and S. Pedersen-Bjergaard, Talanta, 2014, 120, 224–229 CrossRef CAS PubMed.
- M. D. Ramos Payán, H. Jensen, N. J. Petersen, S. H. Hansen and S. Pedersen-Bjergaard, Anal. Chim. Acta, 2012, 735, 46–53 CrossRef PubMed.
- S. Seidi, Y. Yamini and M. Rezazadeh, J. Pharm. Biomed. Anal., 2011, 56, 859–866 CrossRef CAS PubMed.
- L. Arjomandi-Behzad, Y. Yamini and M. Rezazadeh, Anal. Biochem., 2013, 438, 136–143 CrossRef CAS PubMed.
- M. Rezazadeh, Y. Yamini and S. Seidi, J. Chromatogr., B: Biomed. Appl., 2011, 879, 1143–1148 CrossRef CAS PubMed.
- M. Ghambarian, Y. Yamini and A. Esrafili, J. Chromatogr., A, 2012, 1222, 5–12 CrossRef CAS PubMed.
- T. M. Middelthon-Bruer, A. Gjelstad, K. E. Rasmussen and S. Pedersen-Bjergaard, J. Sep. Sci., 2008, 31, 753–759 CrossRef CAS PubMed.
- Y. Yamini, S. Seidi and M. Rezazadeh, Anal. Chim. Acta, 2014, 814, 1–22 CrossRef CAS PubMed.
- M. Rezazadeh, Y. Yamini and S. Seidi, J. Sep. Sci., 2012, 35, 571–579 CrossRef CAS PubMed.
- A. Gjelstad, K. E. Rasmussen and S. Pedersen-Bjergaard, J. Chromatogr., A, 2007, 1174, 104–111 CrossRef CAS PubMed.
-
A. C. Moffat, M. D. Osselton and B. Widdop, Clarke's analysis of drugs and poisons, Pharmaceutical Press, London, 2011 Search PubMed.
- G. A. Shabir, J. Validation Technol., 2005, 10, 314–325 Search PubMed.
- Guidance for Industry; Bioanalytical Method Validation, U.S. Department of Health and Human Services, Food and Drug Administration, Rockville, 2001.
|
| This journal is © The Royal Society of Chemistry 2016 |
Click here to see how this site uses Cookies. View our privacy policy here. ![[thin space (1/6-em)]](https://www.rsc.org/images/entities/char_2009.gif) P, where P is the octanol–water partition coefficient, of the analytes, are reported in Table 1. 2-Nitrophenyl octyl ether (NPOE), 2-nitrophenyl phenylether (NPPE), tris-(2-ethylhexyl)phosphate (TEHP) and di-(2-ethylhexyl)phosphate (DEHP) were purchased from Fluka (Buchs, Switzerland). All of the chemicals used were analytical-reagent grade. The Accurel 2E HF (R/P) polypropylene membrane sheet was supplied by Membrana (Wuppertal, Germany) with a thickness of 150 μm, and pore size of 0.2 μm. Ultrapure water was prepared by using a Younglin 370 series aqua MAX purification instrument (Kyounggi-do, Korea).
P, where P is the octanol–water partition coefficient, of the analytes, are reported in Table 1. 2-Nitrophenyl octyl ether (NPOE), 2-nitrophenyl phenylether (NPPE), tris-(2-ethylhexyl)phosphate (TEHP) and di-(2-ethylhexyl)phosphate (DEHP) were purchased from Fluka (Buchs, Switzerland). All of the chemicals used were analytical-reagent grade. The Accurel 2E HF (R/P) polypropylene membrane sheet was supplied by Membrana (Wuppertal, Germany) with a thickness of 150 μm, and pore size of 0.2 μm. Ultrapure water was prepared by using a Younglin 370 series aqua MAX purification instrument (Kyounggi-do, Korea).
![[thin space (1/6-em)]](https://www.rsc.org/images/entities/char_2009.gif) P of the model analytes
P of the model analytes
![[thin space (1/6-em)]](https://www.rsc.org/images/entities/char_2009.gif) P
P


![[thin space (1/6-em)]](https://www.rsc.org/images/entities/char_2009.gif) :
:![[thin space (1/6-em)]](https://www.rsc.org/images/entities/char_2009.gif) 4 with ultra-pure water and the pH value was adjusted to 7.00 by adding appropriate amounts of hydrochloric acid (100 mM) and/or sodium hydroxide (100 mM) solutions. Then, the urine sample was spiked with a mixed standard solution to obtain the desired concentration. One milliliter of the sample solution was subsequently subjected to the on chip EME procedure. A further urine sample was obtained from a healthy volunteer (29-year-old).
4 with ultra-pure water and the pH value was adjusted to 7.00 by adding appropriate amounts of hydrochloric acid (100 mM) and/or sodium hydroxide (100 mM) solutions. Then, the urine sample was spiked with a mixed standard solution to obtain the desired concentration. One milliliter of the sample solution was subsequently subjected to the on chip EME procedure. A further urine sample was obtained from a healthy volunteer (29-year-old).
![[thin space (1/6-em)]](https://www.rsc.org/images/entities/char_2009.gif) :
:![[thin space (1/6-em)]](https://www.rsc.org/images/entities/char_2009.gif) 45) respectively for 15 minutes. The detector wavelength was set at 215 nm.
45) respectively for 15 minutes. The detector wavelength was set at 215 nm.


