A method developed to fractionate intact proteins based on capillary electrophoresis
Xia
Fu
a,
Hongting
Xiao
a,
Shuang
Liang
a,
James J.
Bao
b,
Tianxiang
Li
c and
Yong
Zhang
*ab
aTianjin Key Laboratory for Modern Drug Delivery & High-Efficiency, School of Pharmaceutical Science and Technology, Tianjin University, Tianjin 300072, China
bCollaborative Innovation Center of Chemical Science and Engineering (Tianjin), Tianjin, 300072, China. E-mail: yongz@tju.edu.cn; Fax: +86-22-27409894; Tel: +86-22-27409894
cTianjin University of Traditional Chinese Medicine, Tianjin, 300193, China
First published on 9th November 2015
Abstract
Reduction in the sample complexity enables more thorough intact protein analysis using MS-based proteomics. A capillary electrophoresis method, namely the velocity gap mode of capillary electrophoresis (VGCE), is proposed to separate protein mixtures with high resolution. Although the separation mechanism of VGCE is also based on the difference of the mass-to-charge ratios of the proteins, it fractionates the sample zone into small pieces of subunits. In this way, the resolution can be dramatically improved due to less longitudinal dispersion of the sample. The effect of the new approach is evaluated by separation of three groups of reference protein mixtures, i.e. a mixture of lysozyme and BSA; a mixture of lysozyme, β-lactoglobulin, and ribonuclease A; and a mixture of cytochrome C, lysozyme, BSA, β-lactoglobulin, ribonuclease A, conalbumin, carbonic anhydrase, and hemoglobin. The results indicate that the new approach shows great potential to couple with MS for top-down analysis of complex mixtures.
1. Introduction
The study of proteomics based on mass spectrometry traditionally includes two strategies: the bottom-up approach and the top-down approach. The bottom up approach is a well-developed method for the routine identification of proteins in complex mixtures. It entails enzymatic digestion of proteins prior to their introduction to a mass spectrometer, thus it cannot achieve full characterization of a whole protein.1,2 The top-down approach is complementary to the bottom-up approach as it introduces intact proteins into a mass spectrometer, so 100% sequence coverage and post-translation modifications (PTMs) can be guaranteed.3,4 But the top-down approach cannot be performed at the proteomics scale owing to the lack of effective intact protein fractionation strategies.5,6Multidimensional separation techniques have been developed or implemented for intact protein fractionation.7 Two-dimensional (2D) electrophoresis is considered essential for proteomics research and it is still a method of choice in most biological laboratories.8 However, it suffers from some limitations, such as poor sensitivity, labour intensive operation, and low recovery rate, which gave rise to exploration of liquid phase-based alternatives.9 Chromatography methods are undoubtedly among the most promising alternatives, given that various techniques can be employed, i.e., reverse phase liquid chromatography.10–14 John C. Tran et al. developed a 4D separation technique which combined solution isoelectric focusing (sIEF), gel-eluted liquid fraction entrapment electrophoresis (GELFrEE), nanocapillary liquid chromatography and MS/MS to analyze human cells. The high resolution of the 4D technique led to the confident identification of 1043 gene products from human cells.15
However, proteins in low abundance can be easily overshadowed by abundant proteins in the sample, leading to difficulty in qualitative and quantitative analysis.16–18 To address this problem, the strategy is usually to enhance the resolution of the separation. We proposed the VG effect to enhance the resolution by enlarging the gap distance between two moving analytes.19,20 But there is a prerequisite, i.e., a gap must have been generated between two analytes before using the VG effect. This can lead to no resolution achieved in the mixed section if two peaks were partly overlapped, even though they had different charge-to-mass ratios. Fortunately, we found that a small amount of analytes contributed to a higher resolution in the separation due to less longitudinal dispersion.21 In other words, longitudinal dispersion was proportional to the amount of the sample. A smaller amount of the sample caused a better separation. In this paper, we proposed a method, i.e. the velocity gap mode of capillary electrophoresis (VGCE), to fractionate mixed proteins. By means of VGCE, it was possible to separate proteins in low abundance from abundant proteins. Moreover, partial peak overlap of two abundant proteins could be avoided. The feasibility of VGCE was confirmed by the separation of reference proteins.
2. Experimental
2.1 Chemicals and solutions
Formic acid, ammonium acetate and dimethyl sulfoxide (DMSO) were purchased from Tianjin Jiangtian Chemical Reagent Co., Ltd (Tianjin, China). Acetonitrile was purchased from Kangkede Company (Tianjin, China). Lysozyme, conalbumin (chicken egg) and β-lactoglobulin (bovine) were obtained from Sinopharm Chemical Reagent Co., Ltd (Shanghai, China). Cytochrome C (horse heart) was obtained from Wolsen (Xi'an, China). Ribonuclease A (bovine pancreas), carbonic anhydrase (bovine erythrocytes) and haemoglobin were obtained from Sigma (Steinheim, Germany). BSA was purchased from Huamaike Company (Beijing, China). Fused silica capillary (50 μm/375 μm, ID/OD) was from Yongnian Optic Fiber Plant (Handan, Hebei, China). All reference proteins were dissolved in deionized water with a stock concentration of 4 mg mL−1, and were stored in a fridge at −20 °C. Each of them was diluted with deionized water to a final concentration of 0.5 mg mL−1 before use.2.2 Apparatus of VGCE
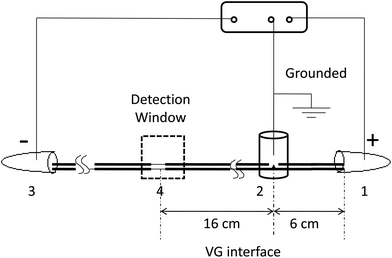
As shown in Fig. 1, all experiments are carried out on a custom-made CE system.21 Briefly, the separation channel is composed of two pieces of capillaries that are linked together through a joint (VG interface). A custom-made high-voltage DC power supply with three electrodes is used to form two consecutive electric fields along the two capillaries. Motion phase I is from the positive electrode (inlet) to the zero electrode (the VG interface). Motion phase II is from the zero electrode to the negative electrode (outlet). The effective separation length is 22 cm. The field strengths of the two electric fields are able to be adjusted independently. The detection window is made by burning off about 3 mm of polyimide coatings on the capillary. The analytes are monitored at 214 nm by using a UV detector (Spectra 100, for CE). The data are collected with a N2000 chromatographic workstation (Zhejiang University, Zhejiang, China).2.3 The manipulation of VGCE
The samples are injected into the capillary via gravitational effects. Sample injection is controlled by raising the inlet end to the same height (9 cm) at the same time (6 s) for each run. Before a new silica capillary was put into use, it is flushed with 1 M sodium hydroxide for 40 min, followed by deionized water for 10 min and a background electrolyte (BGE) for 10 min. Between two runs, the capillary is flushed with sodium hydroxide, deionized water and BGE for 10 min, 5 min and 5 min, respectively.As soon as the sample is injected, the field strengths of two motion phases are adjusted as E1 = E2 = 200 V cm−1. The proteins are sequenced in the sample zone according to their mass-to-charge ratios. VGCE is then implemented. Two steps are included in VGCE: step 1, E1 is adjusted to zero and E2 remains unchanged. The protein having the smallest mass-to-charge ratio will migrate in motion phase II. The other proteins remain stationary in motion phase I. In step 2, both the potentials of two motion phases are adjusted to 200 V cm−1 (E1 = E2 = 200 V cm−1). The remaining proteins in motion phase I continue to move into motion phase II. By repeating this two-step procedure, the sample zone can be fractionated into a series of peaks.
2.4 Theoretical basis of VGCE in fractionating intact proteins
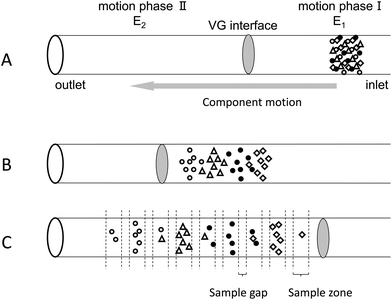
The samples are injected into the capillary via gravitational effects (Fig. 2A). When an electric field is applied along the separation channel, all intact proteins migrate from the anode to the VG interface because they are positively charged at pH 2.5. The proteins are sequenced in the sample zone according to their mass-to-charge ratios (Fig. 2B). VGCE is then implemented. Two steps are included in VGCE: step 1 functions as a “knife” to cut the sample zone into small pieces, which is realized by adjusting E1 to zero and keeping E2 unchanged. The protein samples which migrate faster will enter in motion phase II. Whilst the other proteins stay in motion phase I. In this way, the sample zone is “cut” into small pieces according to the mass-to-charge ratios of proteins. The duration of this step is named t1. The bigger the t1 is, the longer the distance between two adjoining peaks becomes. Step 2 functions as a “conveyor” to send the remaining sample to the “knife”, which is realized by adjusting E1 = E2 = 200 V cm−1. The duration of this step is named t2. The shorter the t2 is, the less sample molecules enter into motion phase II. By repeating this two-step procedure, the sample zone can be fractionated into a series of peaks. Since the sample zone is reordered according to the mass-to-charge ratios of the proteins, the complexity of each peak is reduced (Fig. 2C).3. Results and discussion
3.1. Suppressing EOF
As we mentioned in the section The manipulation of VGCE, the analytes in motion phase I should stop moving when E1 = 0. However, EOF may ruin VGCE by driving the analytes in motion phase I to motion phase II. As a result, EOF should be suppressed in VGCE. As we know, EOF is dependent on the zeta potential of the inner surface of the capillary, which is caused by the dissociation of the silanol group. The strategy adopted in this experiment is to suppress the dissociation of the silanol group. Therefore, acidic buffer (pH 2.50) is used as the BGE. To test the EOF, electrophoresis of neutral maker DMSO (1%, v/v) was performed. The experimental conditions: 100 mM formic acid–ammonium acetate, pH 2.50, 200 V cm−1. The capillary has 50 μm ID and 22 cm effective length. The analytes were monitored at 214 nm by using a UV detector. As we expected, no signal was detected in 150 min (data not shown). The result indicated that EOF was dramatically suppressed using low pH BGE, which was consistent with previous discovery.22,233.2. Study of reference proteins in CE
Eight reference proteins, namely cytochrome C, lysozyme, BSA, β-lactoglobulin, ribonuclease A, conalbumin, carbonic anhydrase and hemoglobin, were studied in CE, respectively (Table 1). It was found that protein samples were easily adsorbed on the inner surface of the pristine capillary such that none or irregular peaks were observed (data not shown). To suppress unspecific adsorption of proteins, the capillaries were flushed with a 1 M sodium hydroxide solution for 40 min, followed by deionized water for 10 min and BGE for 10 min. In addition, 20% (v/v) acetonitrile was added into the BGE to reduce the analyte–wall interaction. As is shown in Table 1, the RSDs were less than 3%, indicating that the reproducibility of the migration time was good and the reversible adsorption of reference proteins on the inner surface of the capillary was suppressed. The results were consistent with the previous research.24,25| Protein | pI | MW (kDa) | RSDa (%) |
|---|---|---|---|
| a n = 5. Experimental conditions: 100 mM formic acid–ammonium acetate, pH 2.50, acetonitrile 20% (v/v), 200 V cm−1, 15 cm/22 cm of effective length/total length and detection wavelength 214 nm. | |||
| Cytochrome C | 10.7 | 12.4 | 2.90 |
| Lysozyme | 11.0 | 14.0 | 2.89 |
| BSA | 4.7 | 68.0 | 1.68 |
| β-Lactoglobulin | 5.2 | 18.4 | 2.41 |
| Ribonuclease A | 9.5 | 13.7 | 1.81 |
| Conalbumin | 6.1 | 77.7 | 2.20 |
| Carbonic anhydrase | 5.9 | 30.0 | 1.82 |
| Hemoglobin | 6.8 | 67.0 | 2.11 |
3.3. The effect of VGCE on fractionation of the mixture of two reference proteins
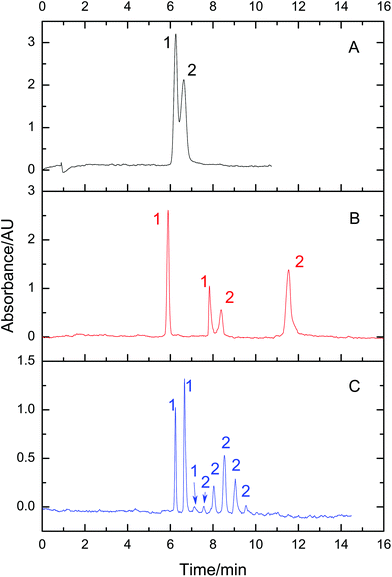
A mixture of BSA and lysozyme was used as the sample to prove the effect of VGCE on fractionation. Two proteins were partly resolved by conventional CE (Fig. 3A). Under the same experimental conditions, the mixture was then separated by VGCE (Fig. 3B and C). VGCE included two steps, i.e. step 1, E1 = 0 and E2 = 200 V cm−1; step 2, E1 = E2 = 200 V cm−1. Step 1 functioned as a cutting knife, pushing the component in motion phase II away from the components in motion phase I. Step 2 functioned as a conveyor, sending the components in motion phase I to motion phase II. By means of the two-step procedure, the sample zone was cut into subunits. The distance between two subunits was proportional to t1 and the width of subunits was proportional to t2. In Fig. 2B, the two-step procedure was carried out 2 times, i.e., t1 = 100 s, t2 = 49 s and t′1 = 128 s, t′2 = 44 s. The sample zone was cut into three sections at the VG interface, i.e., pure lysozyme section, mixed section and pure BSA section. As we expected, two proteins were baseline resolved when three sections migrated from the VG interface to the detection window. The whole sample zone was fractionated into two pure lysozyme zones and two pure BSA zones. The result indicated that a small amount of analyte led to higher resolution due to less dispersion. To further confirm this point, the two-step procedure was repeated 7 times. For each procedure, t1 = 14 s, and t2 = 15 s. The whole sample zone was fractionated into 8 subunits. Among them, three subunits were pure lysozyme zones, and 5 subunits were pure BSA zones (Fig. 3C).3.4. Fractionation of proteins in low abundance with VGCE
Many disease biomarkers in the serum are usually present at a relatively low concentration.17 They are easily submerged by high-abundance proteins. Therefore, detection and identification of low-abundance proteins is a challenging task. Proteins in high-abundance are usually deleted from the sample for further analysis. But sample loss may accompany the deletion process. Based on the fact that VGCE can substantially reduce the sample complexity, this problem can be easily solved via fractionating proteins in low-abundance from the protein mixture. To confirm this point, lysozyme and BSA were mixed at the ratio of 1![[thin space (1/6-em)]](https://www.rsc.org/images/entities/char_2009.gif) :
:![[thin space (1/6-em)]](https://www.rsc.org/images/entities/char_2009.gif) 150 to simulate low-abundance and high-abundance proteins. The peak of lysozyme was thoroughly subsumed by that of BSA and only the mixture peak was observed in conventional CE (Fig. 4A). The mixture was then analyzed by VGCE. The two-step procedure was carried out for one time, t1 = 202 s, t2 = 49 s. The whole sample zone was fractionated into a single pure lysozyme zone and two pure BSA zones (Fig. 4B). Enhanced resolution was achieved due to less dispersion. The result was consistent with our previous work.26 Two advantages of VGCE should be mentioned in the analysis of the protein in low abundance. VGCE fractionated the protein in low abundance from the protein in high abundance to avoid the ionization suppression in MS. The other advantage was that a higher resolution could be obtained.
150 to simulate low-abundance and high-abundance proteins. The peak of lysozyme was thoroughly subsumed by that of BSA and only the mixture peak was observed in conventional CE (Fig. 4A). The mixture was then analyzed by VGCE. The two-step procedure was carried out for one time, t1 = 202 s, t2 = 49 s. The whole sample zone was fractionated into a single pure lysozyme zone and two pure BSA zones (Fig. 4B). Enhanced resolution was achieved due to less dispersion. The result was consistent with our previous work.26 Two advantages of VGCE should be mentioned in the analysis of the protein in low abundance. VGCE fractionated the protein in low abundance from the protein in high abundance to avoid the ionization suppression in MS. The other advantage was that a higher resolution could be obtained.
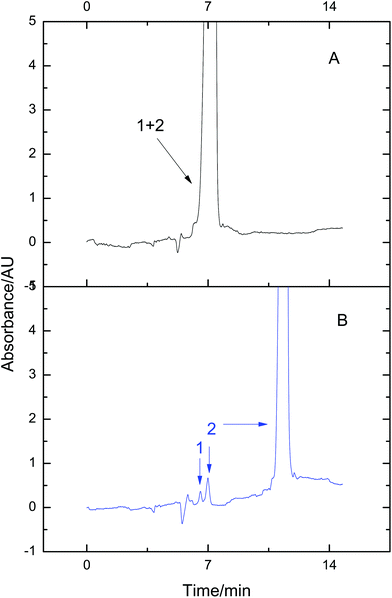 | ||
| Fig. 4 Fractionating low-abundance proteins from the mixture using VGCE. The mixture was composed of 1-lysozyme and 2-BSA. The concentrations of lysozyme and BSA were 0.19 mg mL−1 and 3.81 mg mL−1, respectively. The separation was performed in CE (A). The separation was performed in VGCE and the two-step procedure was repeated once (B). The experimental conditions were the same as those in Fig. 3. | ||
3.5. Enlarging the resolution by VGCE
Various restrictions limit the attempts to improve the resolution in CE, including high voltage, Joule heat, effective separation length, etc. However, VGCE is able to enlarge the resolution by simply adjusting t1. The bigger t1 was, the higher the resolution became. Separation of a protein mixture was carried out as an example. The mixture was composed of lysozyme, β-lactoglobulin and ribonuclease A. As shown in Fig. 5A, these three proteins were baseline separated in CE. The resolution between lysozyme and β-lactoglobulin was 1.91 (Rs1 = 1.91). The resolution between β-lactoglobulin and ribonuclease A was 2.24 (Rs2 = 2.24). When separations were carried out in VGCE, the resolutions were controllable. Adjusting t1 = 1.5 min, the resolutions R′s1 = 5.70 and R′s2 = 7.30 (Fig. 5B). Adjusting t1 = 5 min, the resolutions R′′s1 = 17.97 and R′′s2 = 25.54 (Fig. 5C). It was possible to further increase the resolutions if necessary. The enlarged resolutions may be useful when the separated components were analyzed by MS using off-line connection.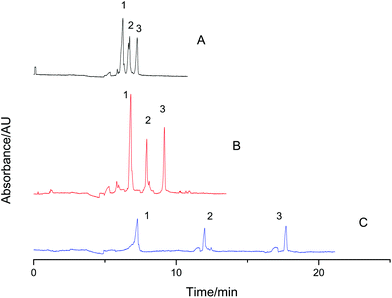 | ||
| Fig. 5 Enlarging the resolution of two reference proteins in VGCE. The sample mixture was composed of 1-lysozyme, 2-β-lactoglobulin and 3-ribonuclease A. The final concentration of all proteins was 0.5 mg mL−1. The separation was carried out in CE as a reference (A). The separations were carried out in VGCE as t1 = 1.5 min (B) and t1 = 5 min (C). The two-step procedure was repeated 2 times. The experimental conditions were the same as those in Fig. 3. | ||
3.6. Fractionating a mixture of 8 reference proteins using VGCE
Proteome samples are generally composed of many proteins. To test the feasibility of VGCE in the fractionation of proteomes, a mixture of eight reference proteins was separated as an example. The reference proteins had a wide range of isoelectric points, ranging from 4.6 to 11.0, and the molecular weight ranging from 12.4 kDa to 77.7 kDa (Table 1). All reference proteins were positively charged in the BGE with pH 2.5. They migrated from the anode to the cathode in the electric field. For comparison, the separation of the mixture was first carried out in CE (Fig. 6A). According to different charge-to-mass ratios, the reference proteins sequenced in the sample zone. The sample zone was then fractionated into peaks by VGCE (Fig. 6B). The distance between two adjacent peaks was proportional to t1, whilst the width of each peak was inversely proportional to t2. In principle, the more pieces of the sample zone were cut, the more purified protein peaks were obtained (it is proved in Fig. 3C). The number of peaks was correlated with the repetitions of the two-step procedure in VGCE. In this experiment, the two-step procedure was repeated 53 times and 54 peaks were obtained. In each two-step procedure, t1 = 25 s and t2 = 4 s. The number of fractionated peaks was more than the number of reference proteins because one reference protein zone may be cut into several pieces by VGCE.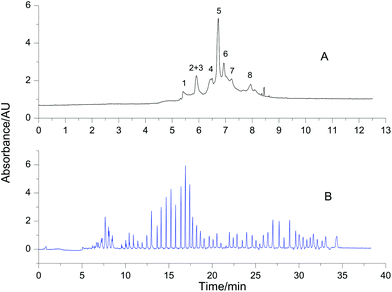 | ||
| Fig. 6 Fractionation of 8 reference proteins using VGCE. Reference proteins were 1-cytochrome C, 2-lysozyme, 3-BSA, 4-β-lactoglobulin, 5-ribonuclease A, 6-conalbumin, 7-carbonic anhydrase, and 8-hemoglobin. The concentration of each protein was 0.5 mg mL−1. The separation of the protein mixture was carried out in CE as a reference (A). The separation of the same sample was carried out in VGCE (B). The two-step procedure of VGCE was repeated 53 times. The experimental conditions were the same as Fig. 3. | ||
It was worth noting that the identification of each peak would depend on mass spectrometry (MS). Our future work will focus on VGCE tandem MS to analyse the proteome. Since VGCE can tremendously reduce the sample complexity, it will undoubtedly facilitate identification work.
4. Conclusions
A new approach, VGCE, is proposed to fractionate protein mixtures. In addition to the advantage of high resolution, VGCE offers three extra advantages. The first is that VGCE is able to reduce the complexity of the protein mixture. A small difference in the charge-to-mass ratios of two proteins leads to their different migration speeds. Consequently, the different proteins are arranged in order during the separation procedure. When the protein mixture is fractionated into a series of subunits, the complexity of each subunit is reduced. The second is that VGCE offers a promising strategy in the analysis of low-abundance proteins in proteomics. The third is that VGCE is a 1D separation technique, such that sample loss can be avoided, especially for precious proteins. The new approach will be run in tandem with MS for top-down analysis of intact proteins in our future work.Acknowledgements
This work was partly supported by 2011 project, Collaborative Innovation Center of Chemical Science and Engineering (Tianjin). We thank Prof. Kenneth Woycechowsky and Prof. Jay Siegel for their valuable discussion. We thank Prof. Kenneth Woycechowsky for his language correction.References
- B. Bogdanov and R. D. Smith, Mass Spectrom. Rev., 2005, 24, 168–200 CrossRef PubMed.
- D. R. Ahlf, P. M. Thomas and N. L. Kelleher, Curr. Opin. Chem. Biol., 2013, 17, 787–794 CrossRef CAS PubMed.
- N. Siuti and N. L. Kelleher, Nat. Methods, 2007, 4, 817–821 CrossRef CAS PubMed.
- M. Mann and O. N. Jensen, Nat. Biotechnol., 2003, 21, 255–261 CrossRef CAS PubMed.
- N. L. Kelleher, Anal. Chem., 2004, 76, 196A–203A CrossRef CAS.
- A. L. Capriotti, C. Cavaliere, P. Foglia, R. Samperi and A. Laganà, J. Chromatogr. A, 2011, 1218, 8760–8776 CrossRef CAS PubMed.
- L. Ly and V. C. Wasinger, Proteomics, 2011, 11, 513–534 CrossRef CAS PubMed.
- Z. Zhu, J. J. Lu and S. Liu, Anal. Chim. Acta, 2012, 709, 21–31 CrossRef CAS PubMed.
- F. Zhou, T. E. Hanson and M. V. Johnston, Anal. Chem., 2007, 79, 7145–7153 CrossRef PubMed.
- M. J. Gray, G. R. Dennis, P. J. Slonecker and R. A. Shalliker, J. Chromatogr. A, 2005, 1073, 3–9 CrossRef CAS PubMed.
- B. A. Parks, L. Jiang, P. M. Thomas, C. D. Wenger, M. J. Roth, M. T. Boyne, P. V. Burke, K. E. Kwast and N. L. Kelleher, Anal. Chem., 2007, 79, 7984–7991 CrossRef PubMed.
- B. Kukrer, V. Filipe, E. van Duijn, P. T. Kasper, R. J. Vreeken, A. J. Heck and W. Jiskoot, Pharm. Res., 2010, 27, 2197–2204 CrossRef PubMed.
- P. Cuatrecasas, J. Biol. Chem., 1970, 245, 3059–3065 CAS.
- S. Sheng, D. Chen and J. E. Van Eyk, Mol. Cell. Proteomics, 2006, 5, 26–34 CAS.
- J. C. Tran, L. Zamdborg, D. R. Ahlf, J. E. Lee, A. D. Catherman, K. R. Durbin, J. D. Tipton, A. Vellaichamy, J. F. Kellie, M. X. Li, C. Wu, S. M. M. Sweet, B. P. Early, N. Siuti, R. D. LeDuc, P. D. Compton, P. M. Thomas and N. L. Kelleher, Nature, 2011, 480, 254–258 CrossRef CAS PubMed.
- L. A. Echan, H. Y. Tang, N. Ali-Khan, K. Lee and D. W. Speicher, Proteomics, 2005, 5, 3292–3303 CrossRef CAS PubMed.
- R. S. Tirumalai, K. C. Chan, D. A. Prieto, H. J. Issaq, T. P. Conrads and T. D. Veenstra, Mol. Cell. Proteomics, 2003, 2, 1096–1103 CAS.
- Y. Zhao, L. Sun, M. M. Champion, M. D. Knierman and N. J. Dovichi, Anal. Chem., 2014, 86, 4873–4878 CrossRef CAS PubMed.
- Y. Zhang, J. Wang, Y. Okamoto, M. Tokeshi, N. Kaji and Y. Baba, Anal. Chem., 2009, 81, 2745–2750 CrossRef CAS PubMed.
- X. Li, Y. Li, L. Zhao, J. Shen, Y. Zhang and J. J. Bao, Electrophoresis, 2014, 35, 2778–2784 CrossRef CAS PubMed.
- H. Xiao, X. F. S. Liang, Y. Li, J. J. Bao and Y. Zhang, J. Chromatogr. A, 2015, 1408, 250–254 CrossRef CAS PubMed.
- W. J. Lambert and D. L. Middleton, Anal. Chem., 1990, 62, 1585–1587 CrossRef CAS.
- E. Olivieri, R. Sebastiano, A. Citterio, C. Gelfi and P. G. Righetti, J. Chromatogr. A, 2000, 894, 273–280 CrossRef CAS.
- A. Staub, S. Comte, S. Rudaz, J.-L. Veuthey and J. Schappler, Electrophoresis, 2010, 31, 3326–3333 CrossRef CAS PubMed.
- W. Kolch, C. Neususs, M. Pelzing and H. Mischak, Mass Spectrom. Rev., 2005, 24, 959–977 CrossRef CAS PubMed.
- H. Xiao, X. Fu, S. Liang, Y. Li, J. J. Bao and Y. Zhang, J. Chromatogr. A, 2015, 1408, 250–254 CrossRef CAS PubMed.
| This journal is © The Royal Society of Chemistry 2016 |

