Glycyrrhetinic acid-decorated and reduction-sensitive micelles to enhance the bioavailability and anti-hepatocellular carcinoma efficacy of tanshinone IIA†
Fengqian
Chen‡
a,
Jinming
Zhang‡
a,
Yao
He
b,
Xiefan
Fang
c,
Yitao
Wang
*a and
Meiwan
Chen
*a
aState Key Laboratory of Quality Research in Chinese Medicine, Institute of Chinese Medical Sciences, University of Macau, Macao 999078, China. E-mail: ytwang@umac.mo; mwchen@umac.mo
bPharmacy College, State Key Laboratory Breeding Base of Systematic Research, Development and Utilization of Chinese Medicine Resources, Chengdu University of Traditional Chinese Medicine, Chengdu, 610075, China
cDepartment of Pediatrics, College of Medicine, University of Florida, Gainesville, FL 32610, USA
First published on 20th October 2015
Abstract
It remains a challenge to increase drug tumor-specific accumulation as well as to achieve intracellular-controlled drug release for hepatocellular carcinoma (HCC) chemotherapy. Herein, we developed a dual-functional biodegradable micellar system constituted by glycyrrhetinic acid coupling poly(ethylene glycol)-disulfide linkage-poly(lactic-co-glycolic acid) (GA-PEG-SS-PLGA) to achieve both hepatoma-targeting and redox-responsive intracellular drug release. Tanshinone IIA (TAN IIA), an effective anti-HCC drug, was encapsulated. Notably, it exhibited rapid aggregation and faster drug release in 10 mM dithiothreitol compared with the redox-insensitive control. Furthermore, GA-decorated micelles revealed HCC-specific cellular uptake in human liver cancer HepG2 cells with an energy-dependent manner, in which micropinocytosis and caveolae-mediated endocytosis were demonstrated as the major cellular pathways. The enhanced cytotoxicity and pro-apoptotic effects against HepG2 cells in vitro were observed, mediated by up-regulation of the intracellular ROS level, the increased cell cycle arrest at S phase, enhanced necrocytosis and up-regulation of caspase 3/7, P38 protein expression. In addition, TAN IIA-loaded micelles had a significantly prolonged circulation time, improved bioavailability, and resulted in an increased accumulation of TAN IIA in the liver. With the synergistic effects of HCC-targeting and controlled drug release, TAN IIA-loaded GA-PEG-SS-PLGA micelles significantly inhibited tumor growth and increased survival time in a mouse HCC-xenograft model. Collectively, the GA-PEG-SS-PLGA micelles with HCC-targeting and redox-sensitive characters would provide a novel strategy to deliver TAN IIA effectively for HCC therapy.
Introduction
Hepatocellular carcinoma (HCC) is an increasingly prevalent cancer with a high mortality rate and few effective treatment options.1,2 Current chemotherapies for HCC have low bioavailability due to the first pass effect in the liver.3 Of the drugs that do accumulate in the liver, few of them are able to reach the malignant HCC cells.4 Thus, delivering anticancer drugs specifically and effectively to HCC tissues remains a great challenge.Polymeric micelles have become one of the most promising drug delivery vehicles because of their high drug loading capacity, narrow size distribution, and long-term circulation in vivo.5 In addition to their passive targeting ability due to enhanced permeability and retention (EPR),6 micelles are now further equipped with active targeting components that bind to the over-expressed asialoglycoprotein receptor,7 folic acid receptor,8 or other types of receptors9,10 in hepatocytes. Nevertheless, poor specificity11 and low biosafety still hinder the clinical usage of these micelles. Because a single targeting strategy is still not enough to effectively treat HCC that has a highly complicated tumor micro-environment, designing novel nano-delivery cargoes with dual or multiple functions would be a better therapeutic strategy for HCC treatment.
Glycyrrhetinic acid (GA) is a naturally occurring compound isolated from licorice and has a high affinity to the liver.12,13 Recently, GA has been incorporated into several HCC-targeted delivery systems, including GA-modified chitosan nanoparticles, liposomes, and micelles.14–17 The higher accumulation of GA-modified nanoparticles in liver tissue and liver tumor compared to that of non-GA-modified nanoparticles has been demonstrated.16,18,19 Moreover, based on the recognition between the GA ligand and its overexpressed binding site, protein kinase C (PKC) α in hepatocellular carcinoma cells, the enhanced cellular uptake of GA-modified nanoparticles in hepatocellular carcinoma cells is easily achieved, and is beneficial as it allows for discrimination between normal hepatocytes and hepatoma cells.20,21 Thus, the use of GA as a natural HCC-targeting ligand in micelles is a promising strategy for the improvement of the selectivity and effectiveness of HCC chemotherapies.
Typically, because of slow hydrolysis, drug release from micelles takes days to weeks,22 which is another hurdle for the clinical application of micelles to overcome in order to achieve rapid treatment. Overcoming such a disadvantage in micelles, stimuli-responsive drug controlled release systems have been developed.23 Recently, redox-sensitive micelles have been designed to achieve rapid and selective intracellular drug release in cancer cells, which have a much higher concentration of intracellular glutathione (GSH) (about 2–10 mM) than normal tissues.24–29 In fact, the GSH level in cancer cells is 100–1000 fold higher than in normal tissues or extracellular fluids (2–20 μM).30–32 In recent years, several redox-sensitive polymeric micelles using an intervening disulfide bond as the linker for hydrophilic and hydrophobic parts have been developed to improve the intracellular release and anticancer efficiency of hydrophobic drugs such as doxorubicin and paclitaxel.33–35
In this study, a novel polymeric micellar system with GA-mediated hepatoma-targeting ability and disulfide linkage-enabled redox-responsive drug release has been designed for HCC-targeted drug delivery. Tanshinone IIA (TAN IIA), a bioactive compound isolated from Radix Salviae Miltiorrhizae with potent pro-apoptotic and anticancer activities,36 was adopted as a model drug loaded into our novel micellar system. This dual-functional micellar system has the following advantages: (1) excellent biocompatibility and passive targeting due to the EPR effect of the (ethylene glycol)-poly(lactide-co-glycolide) (PEG-PLGA) copolymer; (2) active HCC targeting mediated by the interaction between GA and GA receptors that are highly expressed in HCC tissues; (3) redox-sensitive drug release in highly reductive microenvironments such as in HCC tissues. After synthesis of the TAN IIA-loaded dual-functional micelles, we examined redox-sensitive drug release, GA receptor-mediated cellular uptake, anticancer activity, pharmacokinetics, and in vivo bio-distribution of these micelles. We find this novel drug delivery system is a promising strategy to treat HCC.
Experimental section
Materials
Butyloxycarbonyl-amino-terminated poly(ethylene glycol) carboxylic acid (Boc-NH-PEG-COOH, MW 2000 Da) was purchased from JENKEM Tech (Beijing, China). Poly(lactic-co-glycolic acid) (PLGA, MW 5000 Da) and PEG-PLGA (PEG, MW 2000 Da; PLGA, MW 5000 Da) were purchased from Daigang BIO Engineer (Jinan, China). D-α-Tocopherol polyethylene glycol 1000 succinate (TPGS), cystamine dihydrochloride and dithiothreitol (DTT) were purchased from Sigma-Aldrich (St. Louis, MO, USA). 1-Ethyl-3-(3-dimethylamino propyl)carbodiiamide hydrochloride (EDC) and N-hydroxysuccinimide (NHS) were purchased from GL Biochem (Shanghai, China). Tanshinone IIA (TAN IIA) and 18α-glycyrrhetinic acid (GA) (purity ≥ 98% by HPLC) were obtained from MUST bio-technology (Chengdu, China). Dichloromethane was dried by refluxing over CaH2.Penicillin-streptomycin (PS), phosphate buffer saline (PBS), fetal bovine serum (FBS), Dulbecco's modified eagle medium (DMEM), Hoechst 33342, Annexin V-FITC, and 0.25% (w/v) trypsin/1 mM EDTA were purchased from Investigen (Life Technologies, Grand Island, NY, USA). 3-[4,5-Dimethyl-2-thiazolyl]-2,5-diphenyl tetrazolium bromide (MTT), phenylmethanesulfonyl fluoride (PMSF), protease inhibitor cocktail, and propidium iodide (PI) were purchased from Molecular Probes (Life Technologies). Primary antibodies against β-actin, P38, and PARP, and secondary antibodies were purchased from Cell Signaling Technology (Boston, MA, USA). 2′,7′-Dichlorodihydrofluorescein diacetate (DCFH-DA) was obtained from Sigma-Aldrich. All the other solvents were purchased from Aladdin Industrial (Shanghai, China).
Human hepatoma cell line (HepG2 cells) and human lung carcinoma cell line (A549 cells) were obtained from American Type Culture Collection (ATCC, Rockville, MD, USA). Cells were cultured in DMEM supplemented with 10% heat-inactivated FBS (v/v) and PS (100 units per mL penicillin and 100 μg mL−1 streptomycin) at 37 °C under 5% CO2. The medium was changed every other day.
Characterization
The 1H NMR spectra of the copolymers were obtained with a Varian Inova 400 spectrometer (Bruker Company, Billerica, MA) operating at 400 MHz using deuterated chloroform (CDCl3) as a solvent. The NMR data were analyzed with software Origin 8 (OriginLab Corporation, Northampton, USA). The size distribution and zeta potential of the micelles were detected by dynamic light scattering (DLS) at 25 °C using a Zetasizer Nano ZSP (Malvern Instruments, Malvern, UK). Measurements were performed at least in triplicate. Micelle morphology was observed under a JEOL JEM-2100 F transmission electron microscope (TEM, Tokyo, Japan) at an accelerating voltage of 200 kV.Synthesis of PLGA-SS-NH2 copolymer
The terminal-carboxyl PLGA was activated by NHS in anhydrous dichloromethane for 30 min under N2 protection. Then, cystamine dihydrochloride, EDC, and triethylamine in molar ratio of 1![[thin space (1/6-em)]](https://www.rsc.org/images/entities/char_2009.gif) :
:![[thin space (1/6-em)]](https://www.rsc.org/images/entities/char_2009.gif) 1
1![[thin space (1/6-em)]](https://www.rsc.org/images/entities/char_2009.gif) :
:![[thin space (1/6-em)]](https://www.rsc.org/images/entities/char_2009.gif) 1.2
1.2![[thin space (1/6-em)]](https://www.rsc.org/images/entities/char_2009.gif) :
:![[thin space (1/6-em)]](https://www.rsc.org/images/entities/char_2009.gif) 1.2 were added and stirred together at 40 °C for 24 h. To obtain pure PLGA-SS-NH2, the crude product was washed three times with an aqueous solution saturated with sodium chloride, followed by precipitation twice in cold diethyl ether and dried in vacuum at room temperature.
1.2 were added and stirred together at 40 °C for 24 h. To obtain pure PLGA-SS-NH2, the crude product was washed three times with an aqueous solution saturated with sodium chloride, followed by precipitation twice in cold diethyl ether and dried in vacuum at room temperature.
Synthesis of PLGA-SS-PEG-NH2 copolymer
PLGA-SS-NH2 was grafted with COOH-PEG-NH-Boc via an acylation reaction. Boc-NH-PEG-COOH and NHS were stirred in anhydrous dichloromethane for 30 min under N2 protection firstly. PLGA-SS-NH2 and EDC (molar ratio, 1![[thin space (1/6-em)]](https://www.rsc.org/images/entities/char_2009.gif) :
:![[thin space (1/6-em)]](https://www.rsc.org/images/entities/char_2009.gif) 1
1![[thin space (1/6-em)]](https://www.rsc.org/images/entities/char_2009.gif) :
:![[thin space (1/6-em)]](https://www.rsc.org/images/entities/char_2009.gif) 1.2) were added to the mixture and stirred for 24 h at 40 °C. At the end of the reaction, the crude product was precipitated in cold diethyl ether and dried in vacuum for 24 h. PLGA-SS-PEG-NH2 copolymer was obtained by acidolysis in 50% trifluoroacetic acid (TFA) for 1 h. The crude product was precipitated once more in cold diethyl ether and dried in vacuum for 24 h.
1.2) were added to the mixture and stirred for 24 h at 40 °C. At the end of the reaction, the crude product was precipitated in cold diethyl ether and dried in vacuum for 24 h. PLGA-SS-PEG-NH2 copolymer was obtained by acidolysis in 50% trifluoroacetic acid (TFA) for 1 h. The crude product was precipitated once more in cold diethyl ether and dried in vacuum for 24 h.
Synthesis of GA-PEG-SS-PLGA copolymer
PEG-SS-PLGA was decorated with GA through an amide reaction. GA, PLGA-SS-PEG-NH2, EDC and NHS with the molar ratio of 1![[thin space (1/6-em)]](https://www.rsc.org/images/entities/char_2009.gif) :
:![[thin space (1/6-em)]](https://www.rsc.org/images/entities/char_2009.gif) 1
1![[thin space (1/6-em)]](https://www.rsc.org/images/entities/char_2009.gif) :
:![[thin space (1/6-em)]](https://www.rsc.org/images/entities/char_2009.gif) 1.2
1.2![[thin space (1/6-em)]](https://www.rsc.org/images/entities/char_2009.gif) :
:![[thin space (1/6-em)]](https://www.rsc.org/images/entities/char_2009.gif) 1.2 were dissolved in anhydrous dichloromethane and stirred for 24 h at 40 °C under N2 protection. The product was washed with an aqueous solution saturated with sodium chloride and purified by precipitating in cold diethyl ether three times. The GA-PEG-SS-PLGA copolymer was dried in vacuum for at least 24 h.
1.2 were dissolved in anhydrous dichloromethane and stirred for 24 h at 40 °C under N2 protection. The product was washed with an aqueous solution saturated with sodium chloride and purified by precipitating in cold diethyl ether three times. The GA-PEG-SS-PLGA copolymer was dried in vacuum for at least 24 h.
Preparation of TAN IIA-loaded GA-PEG-SS-PLGA micelles
TAN IIA-loaded polymeric micelles were prepared by the solvent evaporation technique.37 Briefly, based on the preliminary experiment, GA-PEG-SS-PLGA copolymer and TAN IIA (weight ratio, 10![[thin space (1/6-em)]](https://www.rsc.org/images/entities/char_2009.gif) :
:![[thin space (1/6-em)]](https://www.rsc.org/images/entities/char_2009.gif) 1) were dissolved in 2 mL of acetone and added dropwise into a 0.01% (w/v) TPGS solution. The mixture was sonicated using a probe sonicator (Q700, Qsonica Co., Australia) for 10 min at 50 Hz and stirred for 2 h to obtain a nanoparticulate dispersion. The dispersion was evaporated in vacuum for 15 min to remove the organic phase and washed three times with distilled water to remove the surfactant. To remove unloaded drugs and maintain sterility, the TAN IIA-loaded micellar suspension was filtered with a 0.22 μm membrane.
1) were dissolved in 2 mL of acetone and added dropwise into a 0.01% (w/v) TPGS solution. The mixture was sonicated using a probe sonicator (Q700, Qsonica Co., Australia) for 10 min at 50 Hz and stirred for 2 h to obtain a nanoparticulate dispersion. The dispersion was evaporated in vacuum for 15 min to remove the organic phase and washed three times with distilled water to remove the surfactant. To remove unloaded drugs and maintain sterility, the TAN IIA-loaded micellar suspension was filtered with a 0.22 μm membrane.
The encapsulation efficiency (EE) and loading efficiency (LE) of the TAN IIA-loaded micelles were measured using HPLC (Waters e2695, Milford, MA, USA). The mobile phase was comprised of methanol and water (80![[thin space (1/6-em)]](https://www.rsc.org/images/entities/char_2009.gif) :
:![[thin space (1/6-em)]](https://www.rsc.org/images/entities/char_2009.gif) 20, v/v). The flow rate was 1.0 mL min−1 at a maximum absorption wavelength of 275 nm. After being dissolved in methanol to remove the polymeric shells, the TAN IIA content in the micelles was determined using the following equations:
20, v/v). The flow rate was 1.0 mL min−1 at a maximum absorption wavelength of 275 nm. After being dissolved in methanol to remove the polymeric shells, the TAN IIA content in the micelles was determined using the following equations:
Redox-triggered destabilization of micelles
The change in micelle size in 10 mM DTT was measured by DLS at 37 °C. Briefly, a GA-PEG-SS-PLGA micellar suspension (0.2 mg mL−1) was added to 1 ml of blank or DTT solution (10 mM). The samples were incubated in a 37 °C bath shaking at 100 rpm. At different time-points, the size distribution of the micelles was measured. A control experiment was done similarly with free TAN IIA or reduction-insensitive PEG-PLGA micelles (0.2 mg mL−1).In vitro drug release from redox-responsive TAN IIA micelles
The in vitro TAN IIA release profile from GA-PEG-SS-PLGA micelles was investigated with a dialysis tube (molecular weight cut-off (MWCO) at 3000 Da) at 37 °C in the presence or absence of 10 mM DTT. The tubes were placed in a 25 ml 0.5% Tween 80 solution and incubated in a 37 °C bath shaking at 100 rpm. At desired time-points, 1 mL of release medium was taken out and replaced with an equal volume of fresh PBS. TAN IIA in the release medium was measured using HPLC as mentioned above. Control experiments were carried out similarly with free TAN IIA or TAN IIA-loaded reduction-insensitive micelles (PEG-PLGA). The release experiments were performed in triplicate.In vitro hepatoma-targeted cellular uptake of micelles and the intracellular mechanism
![[thin space (1/6-em)]](https://www.rsc.org/images/entities/char_2009.gif) 000 events for each sample were measured to assess the cellular uptake of micelles.
000 events for each sample were measured to assess the cellular uptake of micelles.
Determination of the uptake pathway via endocytotic inhibition
HepG2 cells were seeded at a density of 1 × 10⁵ cells per well in a 12-well plate. After incubation for 24 h, the cells were preincubated in the presence of the inhibitors for 1 h before being treated with NR-labeled GA-PEG-SS-PLGA micelles at a NR concentration of 50 μg mL−1 for 4 h, during which time an inhibitor was also present. The pharmacological inhibitors were used at the following concentrations: free GA 10 μM, 2-deoxyglucose 20 mM, chlorpromazine 10 μM, hexamethylene amiloride 20 μM, wortmannin 10 μM, genistein 50 μM, and methyl-β-cyclodextrin 5 mM. After incubation, the cells were washed with cold PBS three times and collected, then determined using FCM. Approximately 10![[thin space (1/6-em)]](https://www.rsc.org/images/entities/char_2009.gif) 000 events for each sample were measured to assess the cellular uptake of the micelles.
000 events for each sample were measured to assess the cellular uptake of the micelles.
In vitro cytotoxicity measured by MTT assay
The cytotoxicity of free TAN IIA and TAN IIA-loaded micelles on HepG2 and A549 (as control) cells were determined using the MTT assay. Cells were seeded into 96-well plates at a density of 5 × 10³ cells per well and treated with various TAN IIA formulations at a series of concentrations for 48 h. Subsequently, MTT agent (5.0 mg mL−1) was added to the cells and they were incubated for 4 h. The medium was aspirated and replaced by 100 μL DMSO to dissolve the resulting purple crystals.38 The absorbance was measured at a wavelength of 570 nm by a multilabel counter (Wallac VICTOR3™V; Perkin Elmer, Waltham, MA, USA). Cell viability was expressed as a percentage of the untreated cells (control). All treatment groups had six replicates, and each replicate was measured three times.Pro-apoptotic effects and relevant mechanisms of micelles on HepG2 cells
For the fluorescence image assay, HepG2 cells were seeded at a density of 6 × 10³ cells per well in a 96-well plate. After incubation for 24 h, the cells were washed with PBS and incubated for another 24 h with TAN IIA-loaded micelles or free TAN IIA at an equivalent TAN IIA concentration of 5 μM. The cells incubated with serum-free DMEM culture medium served as a control. After incubation, the cells were washed twice with cold PBS and stained with JC-1 dyeing working solution following the manufacturer's protocol (Beyotime, China) for 30 min. Fluorescence images were taken using a fluorescence microscope (Olympus IX71, Tokyo, Japan) with a 60× objective.
Cell apoptosis observed by Hoechst 33342 staining
The apoptotic nuclear morphology of HepG2 cells treated with TAN IIA-loaded GA-PEG-SS-PLGA micelles was assessed by Hoechst 33342 staining.37 HepG2 cells were treated with TAN IIA-loaded micelles or free TAN IIA at an equivalent TAN IIA concentration of 5 μM for 48 h. The cells were washed with cold PBS three times, fixed with 100 μL 4% paraformaldehyde for 20 min at room temperature, and stained with 100 μL Hoechst 33342 (5 μg mL−1) for 30 min. Apoptotic nuclear morphology was observed with a fluorescence microscope (Olympus IX71, Tokyo, Japan).Annexin V-FITC/PI double staining
The Annexin V-FITC assay was used to detect apoptosis and necrosis of HepG2 cells treated with TAN IIA-loaded GA-PEG-SS-PLGA micelles. HepG2 cells were seeded in a 6-well plate at a density of 8 × 10⁵ cells per well and exposed to TAN IIA-loaded micelles or free TAN IIA at an equivalent TAN IIA concentration of 5 μM. Untreated cells acted as control. The cells were harvested, gently re-suspended in 200 μL of binding buffer, and stained with 5 μL of Annexin-FITC and 5 μL PI solutions for 20 min in the dark. The cells were analyzed immediately with FCM.Caspase-Glo 3/7 assay
To determine whether free TAN IIA and TAN IIA-micelles induce apoptosis through activation of caspases-3 and -7, the Caspase-GloTM 3/7 assay (Promega) was employed. HepG2 cells were seeded into a white-walled 96 well plate (to remove background fluorescence) at a density of 5 × 10³ cells per well and cultured overnight. The cells were incubated with TAN IIA-loaded micelles or free TAN IIA at an equivalent TAN IIA concentration of 5 μM for 24 h. Untreated cells acted as control. After incubation, the cells were washed with PBS three times. Caspase-GloTM 3/7 Reagent (100 μL) was added to each well in a 1![[thin space (1/6-em)]](https://www.rsc.org/images/entities/char_2009.gif) :
:![[thin space (1/6-em)]](https://www.rsc.org/images/entities/char_2009.gif) 1 ratio as per the protocol's instructions. The 96 well plate was incubated at 22 °C for 1 h. The luminescence of the samples was analyzed using a multilabel counter (Wallac VICTOR3™V; Perkin Elmer, Waltham, MA, USA). The data points were blank subtracted and each assay measurement was replicated 3 times.
1 ratio as per the protocol's instructions. The 96 well plate was incubated at 22 °C for 1 h. The luminescence of the samples was analyzed using a multilabel counter (Wallac VICTOR3™V; Perkin Elmer, Waltham, MA, USA). The data points were blank subtracted and each assay measurement was replicated 3 times.
Western blot analysis
Western blot analysis was employed to study the apoptotic mechanisms affected by different TAN IIA formulations.37 HepG2 cells were treated with TAN IIA-loaded micelles or free TAN IIA at an equivalent TAN IIA concentration of 5 μM for 48 h. The total protein was extracted with RIPA lysis buffer (Thermo Fisher Scientific) and the protein concentrations were measured by the BCA protein assay kit (Thermo Scientific Pierce, USA).31 The protein extracts (30 μg) were separated on an SDS-PAGE gel and transferred onto a PVDF membrane. After blocking with 5% skimmed milk for 1 h, the membrane was incubated with a specific primary antibody against p38 or PARP (1![[thin space (1/6-em)]](https://www.rsc.org/images/entities/char_2009.gif) :
:![[thin space (1/6-em)]](https://www.rsc.org/images/entities/char_2009.gif) 1000) overnight at 4 °C. β-Actin (1
1000) overnight at 4 °C. β-Actin (1![[thin space (1/6-em)]](https://www.rsc.org/images/entities/char_2009.gif) :
:![[thin space (1/6-em)]](https://www.rsc.org/images/entities/char_2009.gif) 2000) was used as an internal control. The PVDF membrane was washed and incubated with the corresponding secondary antibody (1
2000) was used as an internal control. The PVDF membrane was washed and incubated with the corresponding secondary antibody (1![[thin space (1/6-em)]](https://www.rsc.org/images/entities/char_2009.gif) :
:![[thin space (1/6-em)]](https://www.rsc.org/images/entities/char_2009.gif) 5000) for 2 h. Protein bands were visualized using the ECL advanced western blotting detection kit (GE healthcare, Amersham, UK). The density of the bands was quantified by Quantity One Software (Bio-Rad imaging systems, USA).
5000) for 2 h. Protein bands were visualized using the ECL advanced western blotting detection kit (GE healthcare, Amersham, UK). The density of the bands was quantified by Quantity One Software (Bio-Rad imaging systems, USA).
Pharmacokinetics and biodistribution of TAN IIA-loaded micelles
For pharmacokinetic study, wistar rats were randomly divided into three treatment groups: free TAN IIA, TAN IIA/PEG-PLGA, and TAN IIA/GA-PEG-SS-PLGA micelles. Free TAN IIA was dissolved in 1% DMSO solution (v/v). Free TAN IIA solution and TAN IIA-loaded micelles were administered at an equivalent TAN IIA dose of 5 mg kg−1via a single tail vain injection. At predetermined time-points (0.083, 0.25, 0.5, 1, 3, 5, 7, 12, 24, and 48 h), 0.3 mL of blood sample was collected from the suborbital vein and centrifuged at 3000 rpm for 10 min to obtain plasma. TAN IIA was extracted with methanol at 5-fold volume of plasma.Similarly, these above-mentioned samples were administered to KM mice at an equivalent TAN IIA dose of 5 mg kg−1via a single tail intravenous injection, to investigate its tissue distribution. Major organs including heart, liver, spleen, lung, and kidney were collected at 0.083, 3, and 12 h and homogenized in 0.1% SDS dissolved in PBS. Proteins in the homogenates were precipitated by acetonitrile.15
TAN IIA in the plasma and tissues was analyzed by liquid chromatography-mass spectrometry (LC/MS) analysis (Q-trap@5500, AB SCIEX, Framingham, MA, USA). The selective detection ion pair (m/z) for quantification was m/z 295.2 → m/z 249.2.29 Pharmacokinetic parameters were assessed by the software Winnonlin 5.2 (Pharsight, St. Louis, MO, USA).
In vivo antitumor activity
The in vivo antitumor efficacy of the TAN IIA formulations was assessed in female BALB/c nude mice (4–5 weeks) bearing HCC xenografts.39 2 × 10⁶ HepG2 cells per mouse were subcutaneously injected into its right flank. When the volume of transplanted tumor cells reached approximately 100 mm3, the mice were randomly divided into five groups (saline control, free TAN IIA, TAN IIA/PEG-PLGA, TAN IIA/PEG-SS-PLGA, and TAN IIA/GA-PEG-SS-PLGA), with seven mice in each group. Tumor bearing mice were tail vain-injected with different TAN IIA formulations at an equivalent dose of 5 mg kg−1 TAN IIA once every two days for 36 days. At predetermined time intervals, the tumor dimensions were measured using digital calipers, and the tumor volume was calculated using the following formula: tumor volume (mm3) = (length × width2)/2. Relative tumor volume (RTV) was determined as the ratio of tumor volume at t time interval to the initial tumor volume. Relative tumor growth inhibition rate (T/C) was calculated by the following formula: (T/C) = TRTV/CRTV × 100%, where TRTV was the RTV of the treated mice, and CRTV was the RTV of control mice. Survival rates of the mice during the 36 days were calculated. Finally, mice were sacrificed, and tumor organs were collected, weighed, and fixed in formalin for 24 h. These organs were processed for routine H&E staining.40Statistical analysis
The data were analyzed by one-way ANOVA followed by Tukey's Multiple Comparison Test using the GraphPad Prism 5.0 software (La Jolla, CA, USA). p < 0.05 was considered as statistically significant. The data are presented as mean ± standard deviation (SD).Results
Synthesis and characterization of GA-PEG-SS-PLGA copolymer
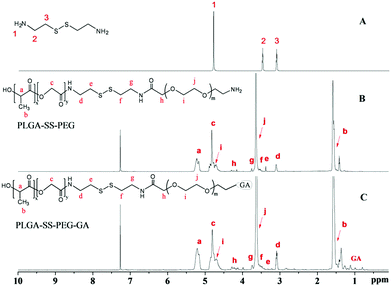
GA-PEG-SS-PLGA copolymer was synthesized by stem grafting of individual polymers via a three-step procedure. Successful synthesis of the GA-PEG-SS-PLGA copolymer was confirmed by 1H-NMR analysis (Fig. 1). Based on the cystamine spectrum in Fig. 1A, the grafting of PEG41,42 and PLGA43 could be identified in the spectrum of the synthesized PEG-SS-PLGA copolymer (Fig. 1B). The methyne (–CH) and methyl (–CH3) protons in the LA section of PLGA were observed at about 5.22 (a) and 1.61 ppm (b), respectively. The peak at about 4.8 ppm (c) gave the evidence of methylene (–CH2) in the GA section of PLGA. After coupling with PLGA, the shift of methylene (–CH2) in cystamine (peak 2 and 3, Fig. 1A) was reduced slightly, generating the peaks at 3.12 (d) and 3.34 ppm (e), in the spectrum of PEG-SS-PLGA (Fig. 1B). Additionally, the methylene protons in the –CH2 group of PEG and the terminal CH2 group of PEG peaked at about 3.64 (j) and 4.28 ppm (h), respectively. After grafting with GA, additional peaks at 0.7–1.4 ppm in the 1H NMR spectrum of GA-PEG-SS-PLGA were generated from the protons in CH3, CH2, and CH of GA (Fig. 1C), indicating that GA molecules were conjugated with the copolymer. Furthermore, GPC chromatogram data of GA-PEG-SS-PLGA polymer in Fig. S1† was determined with tetrahydrofuran as the elution phase, in which its number of mean molecular weight (Mn) and PDI was 7900 and 1.25, respectively. The signal peak of the GPC result indicated that the polymers were highly purified and few oligomers remained.Characterization of TAN IIA-loaded micelles
TAN IIA-loaded GA-PEG-SS-PLGA, PEG-SS-PLGA, and PEG-PLGA micelles were prepared using the solvent evaporation technique. Typically, for cancer treatment, the particle size should range from 70 to 200 nm in order to enhance the EPR effects for passive tumor targeting.44,45 The sizes of all TAN IIA-loaded micelles were within this range (Table 1), indicating that they are suitable to deliver drugs for cancer treatment. The size of the TAN IIA-loaded micelles was bigger than that of the blank micelles, probably due to the enlarged polymeric matrix after loading drugs. The zeta potential of the TAN IIA-loaded GA-PEG-SS-PLGA micelles was −37.6 mV, which is beneficial for its colloidal stability in aqueous solution. As expected, the TAN IIA loaded micelles exhibited good stability in both PBS and serum, without exhibiting significant particle size change over 24 h (Fig. S2†). TAN IIA was loaded into GA-PEG-SS-PLGA micelles at a polymer concentration of 1.0 mg mL−1 and the drug LE was 7.6%. Notably, the EE of TAN IIA was as high as 83.7%.| Samples | Average size (nm) | PDI | Zeta potential (mV) | EE (%) | LE (%) |
|---|---|---|---|---|---|
| Blank GA-PEG-SS-PLGA | 157.6 ± 1.3 | 0.18 ± 0.01 | −40.3 ± 1.3 | — | — |
| TAN IIA/GA-PEG-SS-PLGA | 185.1 ± 0.8 | 0.20 ± 0.02 | −37.6 ± 0.07 | 83.7 ± 1.2 | 7.6 ± 1.6 |
| TAN IIA/PEG-SS-PLGA | 154.1 ± 2.3 | 0.15 ± 0.01 | −33.8 ± 1.5 | 76.4 ± 2.4 | 6.9 ± 0.7 |
| TAN IIA/PEG-PLGA | 145.2 ± 2.4 | 0.19 ± 0.01 | −24.3 ± 2.1 | 74.1 ± 0.6 | 6.7 ± 0.1 |
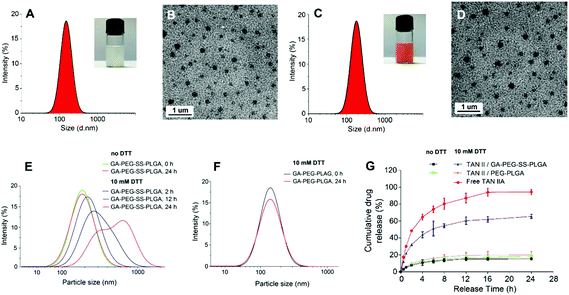
Both blank GA-PEG-SS-PLGA (Fig. 2A) and TAN IIA-loaded GA-PEG-SS-PLGA (Fig. 2B) micellar suspensions had homogeneous dispersibility. After negative staining with phosphotungstic acid, the surface morphology of the micelles was observed under a TEM. The micelles exhibited a spherical shape with vesicular structures and an average size similar to that measured by DLS.
Redox-induced size change of GA-PEG-SS-PLGA micelles
The change in micelle size in response to disulfide bond disassembly in 10 mM DTT was measured by DLS. Little change in size was observed in the non-redox sensitive GA-PEG-PLGA micelles in the absence of DTT after 24 h (Fig. 2F). After adding to 10 mM DTT for 12 and 24 h, the size of the GA-PEG-SS-PLGA micelles was significantly increased (Fig. 2E). These results indicated that the hydrophilic PEG micelles containing disulfide bonds are breakable in response to 10 mM DTT. This is consistent with the previous investigation on redox-responsive micelles.46Reduction-triggered drug release profile
We next obtained the release profiles of TAN IIA from redox-sensitive and reduction-insensitive micelles in the presence or absence of 10 mM DTT in PBS at 37 °C for 24 h (Fig. 2G). Primarily, the stability of TAN IIA in the presence of 10 mM DTT was observed by HPLC (Fig. S3†). Compared to free TAN IIA, TAN IIA-loaded micelles had a much slower drug release. Encapsulated TAN IIA was released at a similar rate for non-redox sensitive and GA-PEG-SS-PLGA micelles in the non-reductive medium. However, drug release in GA-PEG-SS-PLGA micelles was dramatically increased in 10 mM DTT. These results demonstrated that GA-PEG-SS-PLGA micelles were stable in a non-reductive environment, but drug release in these micelles is quickly triggered by a reductive environment.Hepatoma-targeted cellular uptake of micelles and intracellular mechanism
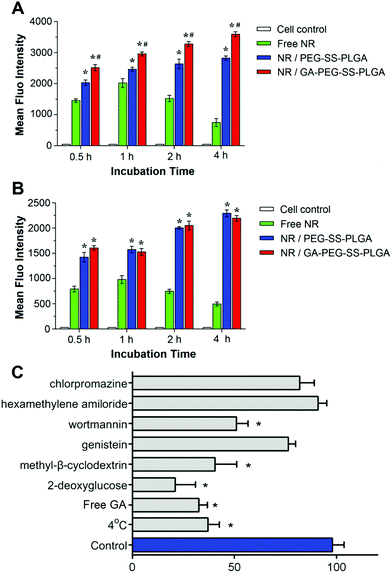
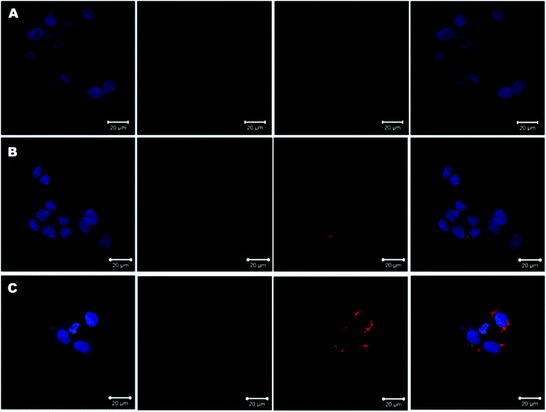
To determine whether the GA-decorated micelles specifically target hepatoma, we measured the uptake of NR-labeled micelles in HepG2 (high expression of GA receptors) and A549 (low expression of GA receptors) cells47 after being treated for 0.5, 1, 2, and 4 h. As shown in Fig. 3, cells without any treatment had little fluorescence. After incubation with free NR, intracellular accumulation of NR was increased within an hour and then declined, probably due to exocytosis (Fig. 3A and B). Compared to free NR treated cells, HepG2 (Fig. 3A) and A549 (Fig. 3B) cells treated with NR-loaded GA-decorated micelles (NR/GA-PEG-SS-PLGA) or NR-loaded non-GA-decorated micelles (NR/PEG-SS-PLGA) exhibited much stronger fluorescence. The enhanced cellular uptake of PEG-SS-PLGA micelles was contributed to the active transport in an energy-dependent manner, instead of the passive diffusion of free hydrophobic NR. Moreover, drugs encapsulated in micelles could avoid to be easily pumped out from cells. At each time-point, treatment with NR-loaded GA-decorated micelles resulted in a significantly higher intensity of fluorescence in HepG2 cells than that observed in cells treated with NR-loaded non-GA-decorated micelles. In comparison, such differences between GA and non-GA-decorated micelles were not observed in A549 cells. These results demonstrated that the affinity of micelles to hepatoma cells is enhanced by GA decoration.Next, CLSM was used to observe the cellular internalization of GA-decorated micelles in HepG2 cells. After incubation for 4 h, higher cellular internalization of NR was found in cells treated with NR/PEG-SS-PLGA (Fig. 4B) or NR/GA-PEG-SS-PLGA micelles (Fig. 4C) than in cells treated with free NR (Fig. 4A). The uptake of NR/GA-PEG-SS-PLGA micelles was higher than that of NR/PEG-SS-PLGA micelles in the cytoplasm and nucleus, indicating that GA guidance is effective to deliver drugs specifically to HepG2 cells that express a high level of GA receptors. Consistent with the FCM results, these data demonstrated that GA-modified micelles are efficiently and selectively taken up by HepG2 cells via receptor-mediated endocytosis,13 which may improve targeted delivery of drugs to HCC tissues.
We also probed the internalization pathways of GA-PEG-SS-PLGA micelles using various endocytic inhibitors. As shown in Fig. 3C, the significantly lower intracellular uptake at 4 °C indicates that it would be related to an energy-dependent process endocytosis. This result was in accordance with the uptake with 2-deoxyglucose exposure. 2-Deoxyglucose could significantly decrease the uptake of micelles, suggesting that micelles were internalized by energy-dependent endocytosis. Wortmannin and methyl-β-cyclodextrin exerted a significant inhibitory effect, suggesting that the internalization pathway was macropinocytosis and caveolae-mediated pathways. In contrast, no reduction in micelle uptake was observed when cells were pretreated with chlorpromazine related to specific clathrin-mediated pathways. Therefore, the internalization pathways of GA-PEG-SS-PLGA micelles were micropinocytosis and caveolae-mediated endocytosis in HepG2 cells. Moreover, pretreatment with free GA could remarkably reduce the cellular uptake of GA-modified micelles, due to the competitive inhibition on GA's binding site. The excessive free GA would saturate these receptors on the surface of the HepG2 cells, so that the GA-modified micelles could take advantage of these binding sites no longer. This competitive saturation test indicated that the enhanced cellular uptake of GA-modified micelles in liver cancer cells would rely on these GA's binding sites greatly.
In vitro anticancer activity of TAN IIA-loaded micelles
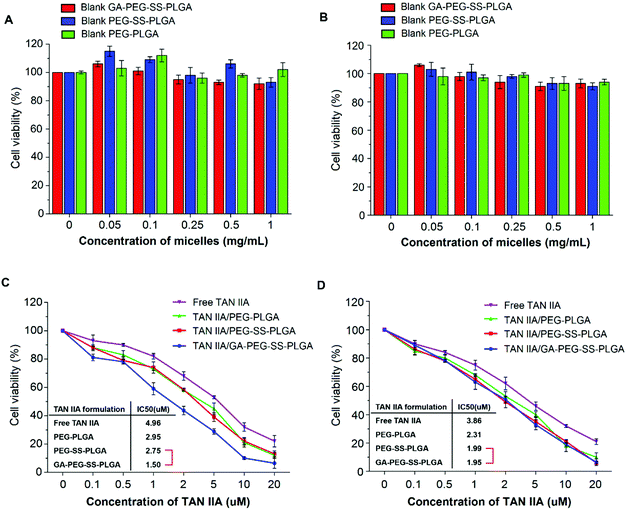
MTT assays were performed on HepG2 (with GA receptors) and A549 (without GA receptors) cells to evaluate the anticancer activity of TAN IIA-loaded GA-PEG-SS-PLGA micelles. TAN IIA/PEG-SS-PLGA, TAN IIA/PEG-PLGA micelles, and free TAN IIA were used as controls. Blank micelles had no cytotoxicity against HepG2 or A549 cells with a cell viability greater than 95% at the concentration of 1.0 mg mL−1 (Fig. 5A and B), indicating that these micelles have excellent biocompatibility. Free TAN IIA and TAN IIA-loaded micelles significantly suppressed the survival of HepG2 and A549 cells in a concentration-dependent manner. Using the IC50 value as an index for anticancer activity, the anticancer activity of different TAN IIA formulations in HepG2 cells followed an order of TAN IIA/GA-PEG-SS-PLGA (IC50 = 1.50 μM) > TAN IIA/PEG-SS-PLGA (IC50 = 2.75 μM) > TAN IIA/PEG-PLGA (IC50 = 2.95 μM) > Free TAN IIA (IC50 = 4.96 μM) (Fig. 5C). In A549 cells, the order for anticancer activity was TAN IIA/GA-PEG-SS-PLGA (IC50 = 1.95 μM) ≈ TAN IIA/PEG-SS-PLGA (IC50 = 1.99 μM) > TAN IIA/PEG-PLGA (IC50 = 2.31 μM) > Free TAN IIA (IC50 = 3.86 μM) (Fig. 5D). Therefore, among all formulations, TAN IIA-loaded GA-PEG-SS-PLGA micelles have the highest anticancer effects against HepG2 cells after incubation for 48 h, indicating that the strategy of combining hepatoma-targeting and redox-sensitive intracellular drug release efficiently improves the anticancer activity of micelles. However, although TAN IIA-loaded redox-sensitive micelles exhibited higher cytotoxicity than TAN IIA/PEG-PLGA micelles, there was no significant difference in cytotoxicity against A549 cells between TAN IIA/GA-PEG-SS-PLGA and TAN IIA/PEG-SS-PLGA micelles because no GA receptors are expressed in A549 cells. These results confirmed that GA-decorated micelles selectively target HepG2 cells that have overexpression of GA receptors.Pro-apoptotic effects of TAN IIA-loaded micelles on HepG2 cells and the potential mechanisms
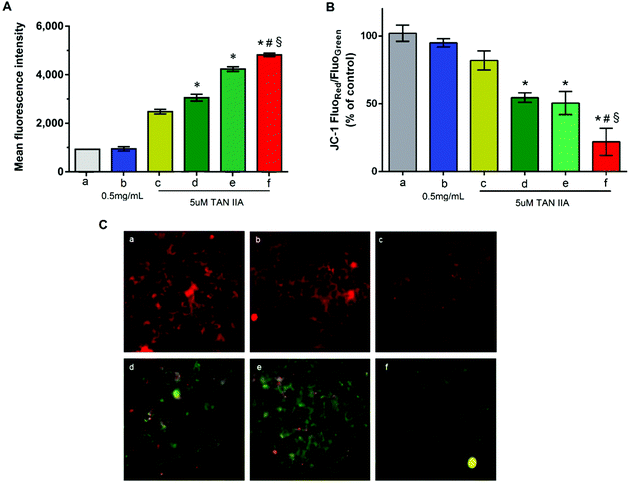
Cells were treated with different formulations containing 5 μM TAN IIA, which is close to the IC50 of free TAN IIA against HepG2 cells after incubation for 2 h. As shown in Fig. 6A, cells treated with blank GA-PEG-SS-PLGA micelles (0.5 mg mL−1) had no changes in intracellular ROS level compared to untreated cells, indicating good biocompatibility of the blank micelles. Compared to free TAN IIA, TAN IIA-loaded micelles induced a higher ROS level in HepG2 cells (Fig. 6A). In our testing conditions, the abilities of different formulations to induce ROS production in HepG2 cells followed this order: TAN IIA/GA-PEG-SS-PLGA micelles > TAN IIA/PEG-SS-PLGA micelles > TAN IIA/PEG-PLGA micelles. Because increased ROS levels lead to cell growth arrest and apoptosis,48,49 our results demonstrated that these dual-functional GA-PEG-SS-PLGA micelles are superior to single redox-responsive micelles or conventional micelles in generating oxidative damage in liver cancer cells.Mitochondrial membrane potential was an important parameter of mitochondria function and the loss of mitochondrial membrane potential was usually considered to be a pro-apoptotic effect. A decrease of the value of red and green fluorescence intensity ratio indicated the occurrence of mitochondrial depolarization. As shown in Fig. 6B, blank GA-PEG-SS-PLGA micelles had no influence on the mitochondrial membrane potential while the decrease of mitochondrial membrane potential was observed in HepG2 cells treated with various TAN IIA formulation. The values of JC-1 red/green significantly decreased after incubation with TAN IIA-loaded GA-PEG-SS-PLGA in the HepG2 cells as compared to the other group (Fig. 6B) (P < 0.05).
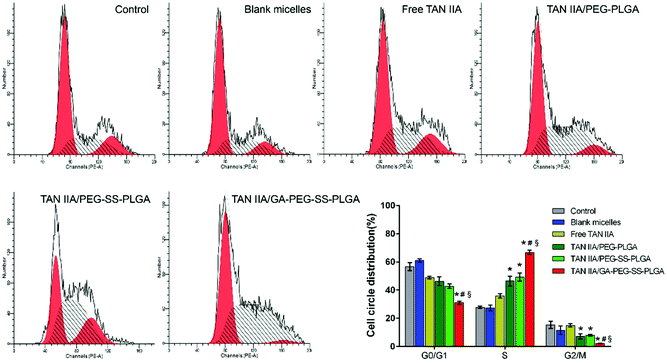
The effects of TAN IIA-loaded micelles on HepG2 cell cycle progression were examined by FCM. Compared to untreated or blank micelle groups, TAN IIA formulations induced cell cycle arrest in HepG2 cells (Fig. 7), which is consistent with a previous report.50 Notably, after treatment, cell distribution in the G0/G1 phase was reduced, whereas cell percentages in the S and G2/M phases were increased. Among all formulations, TAN IIA-loaded GA-PEG-SS-PLGA micelles exhibited the strongest effect on cell cycle arrest in the S phase, leading to very low number of cells in the G2/M phase (Fig. 7). Hence, TAN IIA-loaded GA-PEG-SS-PLGA micelles are a very potent inhibitor of cell proliferation in HepG2 cells.
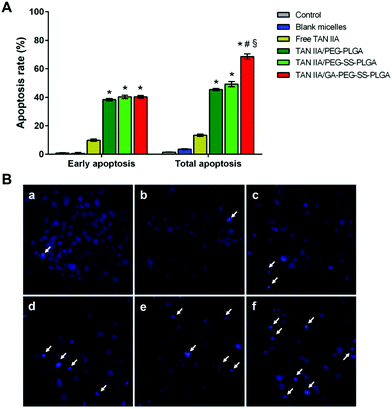
In addition to cell cycle analysis, we next assessed the effect of TAN IIA-loaded micelles on apoptosis in HepG2 cells. Annexin V-FITC and PI double-staining was used to evaluate cell apoptosis after treatment. TAN IIA-loaded micelles had a significantly stronger apoptotic effect on HepG2 cells than TAN IIA. As shown, HepG2 cells treated with TAN IIA/GA-PEG-SS-PLGA micelles exhibited the highest apoptosis rate compared with other counterparts (Fig. 8A, ESI Fig. 1†). These results indicated that TAN IIA/GA-PEG-SS-PLGA micelles have stronger apoptotic effects on HepG2 cells.
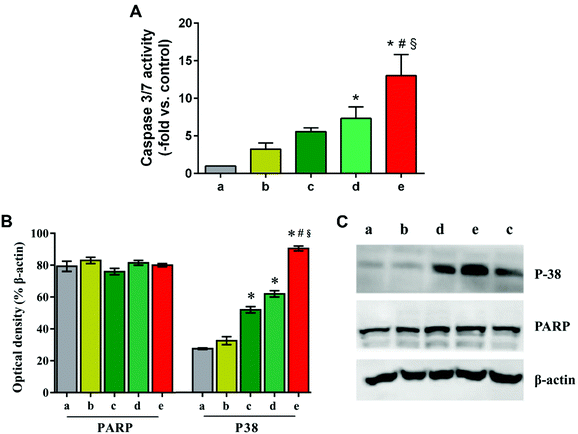
Next, HepG2 cells treated with TAN IIA-loaded micelles were stained with Hoechst 33342 to observe cell nuclei morphology. Compared to control and blank micelle groups, cells treated with free TAN IIA or TAN IIA-loaded micelles exhibited nucleus shrinkage and apoptotic bodies (Fig. 8B). TAN IIA-loaded GA-PEG-SS-PLGA micelle-treated cells had the highest number of apoptotic nuclei compared to other micellar counterparts. Again, these results demonstrated that TAN IIA-loaded GA-PEG-SS-PLGA micelles have potent pro-apoptotic effects on HepG2 cells. Moreover, the caspase-3/7 activity in HepG2 cells was significantly increased after the treatment of TAN IIA-loaded GA-PEG-SS-PLGA (Fig. 9A), which could be a potential for the induction of cell apoptosis. The result was similar with the finding in cell apoptosis test .
Next, western blot analysis was performed to reveal the internal apoptotic pathways induced by TAN IIA-loaded micelles in HepG2 cells. P38 regulates the cell cycle at different transition points and plays an important role in the development of many types of cancers.18,49 PARP is associated with cell death and is specifically and rapidly cleaved in apoptotic cells.16 Compared with their counterparts, TAN IIA-loaded GA-PEG-SS-PLGA micelles significantly up-regulated the expression of P38 in HepG2 cells, whereas they had no influence on the level of PARP (Fig. 9B and C). Because p38 MAPK is an important regulator of cell death by determining cell fate depending on the stimulus and cell types,51 increased cell apoptosis by TAN IIA-loaded GA-PEG-SS-PLGA micelles is probably mediated by the p38 MAP kinase pathway.
Pharmacokinetic study
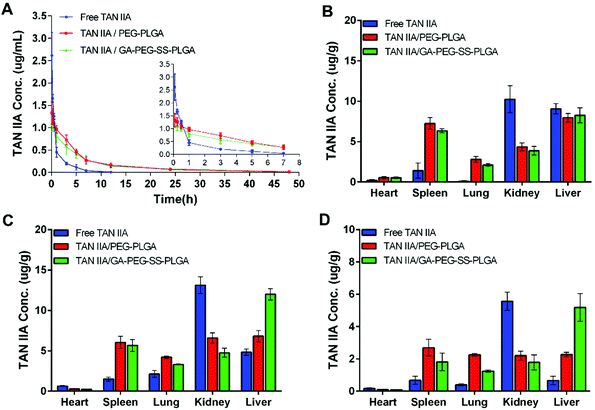
As shown in Fig. 10A, after administration of free TAN IIA, the plasma concentrations of TAN IIA decreased sharply; it could barely be detected with our LC/MS method at 12 h post injection. On the contrary, rats treated with TAN IIA-loaded micelles had a much longer circulation time for TAN IIA, with detectable plasma TAN IIA concentrations at 48 h post injection. The time-courses of plasma TAN IIA concentrations were similar for TAN IIA/PEG-PLGA micelles and TAN IIA/GA-PEG-SS-PLGA micelles, indicating that the PEG moiety prolongs blood circulation of micelles.The pharmacokinetic parameters of different TAN IIA formulations are summarized in Table 2. TAN IIA-loaded micelles had a significantly higher total area under the curve (AUC0–∞) value compared with free TAN IIA, indicating the enhanced bioavailability after encapsulation of TAN IIA in micelles. The higher AUC0–∞ values could be attributed to the prolonged mean retention time (MRT) and decreased elimination rate constant (Kel) of TAN IIA-loaded micelles. Interestingly, the pharmacokinetic parameters for TAN IIA/GA-PEG-SS-PLGA micelles were different from those of TAN IIA/PEG-PLGA micelles. Although the MRT of TAN IIA/GA-PEG-SS-PLGA was lower than that of TAN IIA/PEG-PLGA, the AUC0–∞ value of TAN IIA/GA-PEG-SS-PLGA was higher than that of the TAN IIA/PEG-PLGA group. This could be as a result of the liver-targeting property of TAN IIA/GA-PEG-SS-PLGA micelles, which facilitates liver accumulation and decreases blood circulation of TAN IIA.
| Groups | Parameters | |||
|---|---|---|---|---|
| AUC0–t (h μg mL−1) | AUC0–∞ (h μg mL−1) | MRT (h) | Kel | |
| *p < 0.05 vs. free TAN IIA. | ||||
| Free TAN IIA | 1.25 | 1.27 | 2.26 | 0.426 |
| TAN IIA/PEG-PLGA | 6.49* | 6.71* | 9.82* | 0.065* |
| TAN IIA/GA-PEG-SS-PLGA | 7.02* | 7.19* | 8.79* | 0.072* |
Furthermore, TAN IIA concentrations in unit mass of heart, spleen, lung, kidney, and liver were measured by LC/MS. Compared to TAN IIA-loaded micelles, free TAN IIA had higher drug levels in kidney at 0.083 h (Fig. 10B), 3 h (Fig. 10C), and 24 h (Fig. 10D) post injection, implying that free TAN IIA experienced a faster elimination rate in vivo. Although comparable levels of TAN IIA accumulated in liver at 0.083 h for the three groups, higher levels of TAN IIA had accumulated in the livers of the animals treated with TAN IIA-loaded micelles than those of animals treated with free TAN IIA at 3 and 24 h post injection. The liver concentration of TAN IIA in the TAN IIA/GA-PEG-SS-PLGA group was significantly higher than that in the TAN IIA/PEG-PLGA group (#p < 0.05), indicating that GA modification promotes the liver-targeting ability of the micelles. Moreover, TAN IIA-loaded micelles had higher levels in spleen compared with the control, indicating that they are selectively taken up by the mononuclear phagocyte system as well. In short, these results indicated that GA-PEG-SS-PLGA micelles prolong the retention time and enhance the liver distribution of TAN IIA.
In vivo antitumor activity
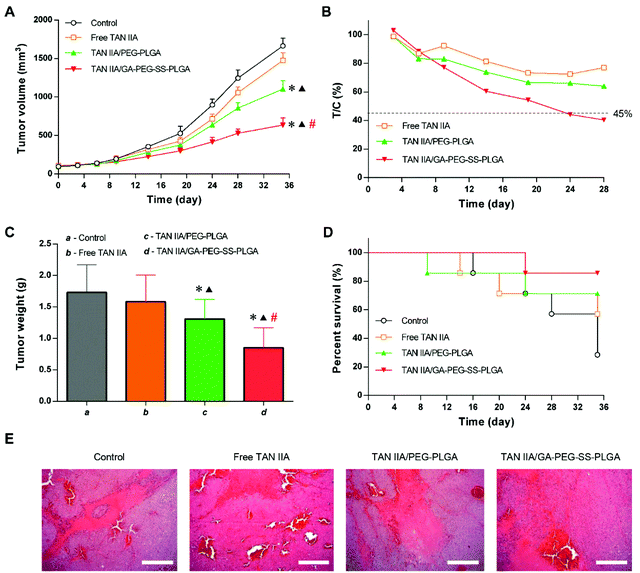
To evaluate if the increased cytotoxicity in vitro and improved circulation time and liver accumulation would enhance the therapeutic outcome, a xenograft tumor model was established in mice with HepG2 cell implantation. In this model, the inhibition rates of tumor growth by different TAN IIA formulations followed the order: TAN IIA/GA-PEG-SS-PLGA > TAN IIA/PEG-PLGA > free TAN IIA (Fig. 11A). At the end of the experiment, the average tumor volume of the free TAN IIA, TAN IIA/PEG-PLGA, and TAN IIA/GA-PEG-SS-PLGA groups were 88.7, 66.5, and 38.2% of the control group, respectively. Meanwhile, the T/C value was lower than 45% in the group treated with TAN IIA/GA-PEG-SS-PLGA micelles for 24 d (Fig. 11B), which fulfils the criterion that only the agents with T/C values less than 45% are effective for antitumor treatment.19 In addition, the average weight of tumors from the TAN IIA/GA-PEG-SS-PLGA group was merely 49.1% of the control group (Fig. 11C). Similar to HCC patients, death in tumor-bearing mice occurred due to insufficient nutrition and accumulated drug toxicity by long-term treatment. As shown in Fig. 10D, TAN IIA/GA-PEG-SS-PLGA micelles reduced the mortality of tumor-bearing mice during the test period. Histological analysis of tumor sections revealed a larger necrotic area and more cellular apoptosis in tumors treated with TAN IIA/GA-PEG-SS-PLGA micelles compared with the other groups (Fig. 10E). These results suggested that TAN IIA/GA-PEG-SS-PLGA micelles have more potent antitumor effects than either free TAN IIA or TAN IIA-loaded non-functional micelles.Discussion
Several nano-systems have been reported to improve cargo delivery efficiency in HCC therapeutics over the last decade.52 However, NP design for HCC-targeting remains challenging, because of the elaborate reticuloendothelial system (RES) in liver tissue such as Kupffer cells, specialized macrophages dispersed throughout liver sinusoids. It will capture these NPs and interfere with the delivery of therapeutic payloads.39 Much effort has been devoted to achieving selective delivery of NPs to HCC, including the PEGylation to evade the RES and functional modification with tumor-specific ligands.53 Various targeting ligands such as antibodies, aptamers, peptides, and small molecules like galactose have been employed. However, the demand for novel targeting ligands for HCC-specific delivery remains high in view of the potential immunoreaction of exogenous biomacromolecular targeting ligands54 and the instable targeting efficiency of galactose.55 Along with the identification of protein kinase C α as a GA binding site in human hepatocytes, GA was recognized as having potential to be exploited as a novel liver targeting moiety.13 More importantly, a higher expression of GA's receptor is indeed pronounced in HCC cells, suggesting that the GA functionalized micelles we designed could discriminate liver tissue and hepatoma tissue well.Because of the generally serious toxicity of chemotherapeutics, bioactive compounds in natural herbal medicines were considered as potential drug candidates in cancer treatment. Tanshinone IIA (TAN IIA), a derivative of phenanthrenequinone isolated from Salvia miltiorrhiza Bunge, can induce apoptosis and differentiation in several types of human cancer cells.56 However, the clinical use of TAN IIA is limited, due to its poor water solubility and fast elimination. Herein, TAN IIA was loaded in GA-PEG-SS-PLGA micelles to overcome these drawbacks and improve its efficiency. As shown in Fig. 10, the pharmacokinetic results indicated that GA-PEG-SS-PLGA micelles could significantly prolong the retention period and enhance liver distribution of TAN IIA, compared to free TAN IIA.
Owing to apoptosis induction being an important therapeutic target of cancer research, the pro-apoptotic effects of TAN IIA-loaded micelles on HepG2 cells and the potential mechanisms were investigated by measurement of the intracellular ROS level and mitochondrial potential, analysis of cell cycle distribution, nuclei apoptosis, caspase-3/7 activity and expression of apoptosis related proteins. All these results showed that TAN IIA-loaded micelles could significantly increase cell apoptosis, through the synergetic effect of higher cellular uptake mediated by GA ligands and fast intracellular drug release by disulfide linkages. As expected, the in vivo antitumor activities were in accordance with the in vitro results; TAN IIA-loaded GA-PEG-SS-PLGA micelles exhibited the most potent anti-HCC efficiency.
Conclusions
A novel hepatoma-targeting and redox-responsive micellar system GA-PEG-SS-PLGA was developed to deliver TAN IIA to hepatoma cells in a cell-specific and fast-release manner. These multifunctional micelles possess unique advantages: (1) they are highly biocompatible with the bio-safe PEG-PLGA copolymer; (2) GA decoration enables selective drug delivery to the GA receptor-rich hepatoma cells; (3) the redox-responsive disulfide bond remarkably accelerates drug release in GSH-rich cancer cells; (4) they exhibit improved bioavailability and high liver accumulation of TAN IIA in vivo; (5) most importantly, TAN IIA encapsulated in GA-PEG-SS-PLGA micelles causes significantly enhanced in vitro cytotoxicity and pro-apoptosis efficiency toward HepG2 cells and a greater antitumor effect in mouse tumor models. With all these advantages, these multifunctional micelles are an effective nano-vehicle to selectively deliver anticancer drugs during HCC treatment.Acknowledgements
This study was supported by the Macao Science and Technology Development Fund (077/2011/A3), the Research Fund of the University of Macau (MYRG2014-00033-ICMS-QRCM, MYRG2014-00051-ICMS-QRCM, MYRG 208 (Y3-L4)-ICMS11-WYT, MRG012/WYT/2013/ICMS, MYRG2015-00171-ICMS-QRCM), and the National Natural Science Foundation of China (81403120).References
- R. Lencioni and J. M. Llovet, Semin. Liver Dis., 2010, 30, 52–60 CrossRef CAS PubMed.
- J. D. Yang and L. R. Roberts, Nat. Rev. Gastroenterol. Hepatol., 2010, 7, 448–458 CrossRef PubMed.
- R. Haag and F. Kratz, Angew. Chem., Int. Ed., 2006, 45, 1198–1215 CrossRef CAS PubMed.
- K. Poelstra, J. Prakash and L. Beljaars, J. Controlled Release, 2012, 161, 188–197 CrossRef CAS PubMed.
- D. Sutton, N. Nasongkla, E. Blanco and J. Gao, Pharm. Res., 2007, 24, 1029–1046 CrossRef CAS PubMed.
- S. Acharya and S. K. Sahoo, Adv. Drug Delivery Rev., 2011, 63, 170–183 CrossRef CAS PubMed.
- X. Q. Zhang, X. L. Wang, P. C. Zhang, Z. L. Liu, R. X. Zhuo, H. Q. Mao and K. W. Leong, J. Controlled Release, 2005, 102, 749–763 CrossRef CAS PubMed.
- G. Hong, R. Yuan, B. Liang, J. Shen, X. Yang and X. Shuai, Biomed. Microdevices, 2008, 10, 693–700 CrossRef CAS PubMed.
- F. Danhier, O. Feron and V. Préat, J. Controlled Release, 2010, 148, 135–146 CrossRef CAS PubMed.
- D. Shangguan, L. Meng, Z. C. Cao, Z. Xiao, X. Fang, Y. Li, D. Cardona, R. P. Witek, C. Liu and W. Tan, Anal. Chem., 2008, 80, 721–728 CrossRef CAS PubMed.
- I. Hyodo, M. Mizuno, G. Yamada and T. Tsuji, Liver, 1993, 13, 80–85 CrossRef CAS PubMed.
- B. Lallemand, M. Gelbcke, J. Dubois, M. Prévost, I. Jabin and R. Kiss, Mini-Rev. Med. Chem., 2011, 11, 881–887 CrossRef CAS.
- M. Negishi, A. Irie, N. Nagata and A. Ichikawa, Biochim. Biophys. Acta, Biomembr., 1991, 1066, 77–82 CrossRef CAS.
- W. Huang, W. Wang, P. Wang, Q. Tian, C. Zhang, C. Wang, Z. Yuan, M. Liu, H. Wan and H. Tang, Acta Biomater., 2010, 6, 3927–3935 CrossRef CAS PubMed.
- Q. Tian, C. N. Zhang, X. H. Wang, W. Wang, W. Huang, R. T. Cha, C. H. Wang, Z. Yuan, M. Liu and H. Y. Wan, Biomaterials, 2010, 31, 4748–4756 CrossRef CAS PubMed.
- C. Zhang, W. Wang, T. Liu, Y. Wu, H. Guo, P. Wang, Q. Tian, Y. Wang and Z. Yuan, Biomaterials, 2012, 33, 2187–2196 CrossRef CAS PubMed.
- W. Huang, W. Wang, P. Wang, C.-N. Zhang, Q. Tian, Y. Zhang, X. H. Wang, R. T. Cha, C. H. Wang and Z. Yuan, J. Mater. Sci.: Mater. Med., 2011, 22, 853–863 CrossRef CAS PubMed.
- W. W. Qi, H. Y. Yu, H. Guo, J. Lou, Z. M. Wang, P. Liu, A. SapinMinet, P. Maincent, X. C. Hong and X. M. Hu, Mol. Pharm., 2015, 12, 675–683 CrossRef CAS PubMed.
- J. Zhang, M. Zhang, J. Ji, X. Fang, X. Pan, Y. Wang, C. Wu and M. Chen, Pharm. Res., 2015, 1–15 Search PubMed.
- O. Mezghrani, Y. Tang, X. Ke, Y. Chen, D. Hu, J. Tu, L. Zhao and N. Bourkaib, Int. J. Pharm., 2015, 478, 553–568 CrossRef CAS PubMed.
- T. H. Ying, J. H. Tsai, T. T. Wu, M. T. Tsai, W. W. Su, Y. S. Hsieh and J. Y. Liu, Chin. J. Physiol., 2008, 51, 269–274 CAS.
- X. Shuai, H. Ai, N. Nasongkla, S. Kim and J. Gao, J. Controlled Release, 2004, 98, 415–426 CrossRef CAS PubMed.
- M. A. C. Stuart, W. T. Huck, J. Genzer, M. Müller, C. Ober, M. Stamm, G. B. Sukhorukov, I. Szleifer, V. V. Tsukruk and M. Urban, Nat. Mater., 2010, 9, 101–113 CrossRef PubMed.
- Y. Bae and K. Kataoka, Adv. Drug Delivery Rev., 2009, 61, 768–784 CrossRef CAS PubMed.
- Q. Zhang, N. R. Ko and J. K. Oh, Chem. Commun., 2012, 48, 7542–7552 RSC.
- F. Meng, R. Cheng, C. Deng and Z. Zhong, Mater. Today, 2012, 15, 436–442 CrossRef CAS.
- M. Zhao, A. Biswas, B. Hu, K. Joo, P. Wang, Z. Gu and Y. Tang, Biomaterials, 2011, 32, 5223–5230 CrossRef CAS PubMed.
- J. Liu, Y. Pang, W. Huang, Z. Zhu, X. Zhu, Y. Zhou and D. Yan, Biomacromolecules, 2011, 12, 2407–2415 CrossRef CAS PubMed.
- J. Liu, Y. Pang, W. Huang, X. Huang, L. Meng, X. Zhu, Y. Zhou and D. Yan, Biomacromolecules, 2011, 12, 1567–1577 CrossRef CAS PubMed.
- F. Q. Schafer and G. R. Buettner, Free Radicals Biol. Med., 2001, 30, 1191–1212 CrossRef CAS.
- R. Cheng, F. Feng, F. Meng, C. Deng, J. Feijen and Z. Zhong, J. Controlled Release, 2011, 152, 2–12 CrossRef CAS PubMed.
- F. Meng, W. E. Hennink and Z. Zhong, Biomaterials, 2009, 30, 2180–2198 CrossRef CAS PubMed.
- K. Wang, G. F. Luo, Y. Liu, C. Li, S. X. Cheng, R. X. Zhuo and X. Z. Zhang, Polym. Chem., 2012, 3, 1084–1090 RSC.
- C. Deng, Y. Jiang, R. Cheng, F. Meng and Z. Zhong, Nano Today, 2012, 7, 467–480 CrossRef CAS PubMed.
- R. Cheng, F. Meng, C. Deng, H.-A. Klok and Z. Zhong, Biomaterials, 2013, 34, 3647–3657 CrossRef CAS PubMed.
- H. J. Sung, S. M. Choi, Y. Yoon and K. S. An, Exp. Mol. Med., 1999, 31, 174–178 CrossRef CAS PubMed.
- J. Zhang, Y. Li, X. Fang, D. Zhou, Y. Wang and M. Chen, Int. J. Pharm., 2014, 476, 185–198 CrossRef CAS PubMed.
- Y. Zhong, W. Yang, H. Sun, R. Cheng, F. Meng, C. Deng and Z. Zhong, Biomacromolecules, 2013, 14, 3723–3730 CrossRef CAS PubMed.
- S. M. Moghimi, A. C. Hunter and J. C. Murray, Pharmacol. Rev., 2001, 53, 283–318 CAS.
- X. Fang, W. Dong, C. Thornton and K. L. Willett, Aquat. Toxicol., 2010, 98, 130–138 CrossRef CAS PubMed.
- B. Jeong, L. Q. Wang and A. Gutowska, Chem. Commun., 2001, 1516–1517 RSC.
- C. Heald, S. Stolnik, K. Kujawinski, C. De Matteis, M. Garnett, L. Illum, S. Davis, S. Purkiss, R. Barlow and P. Gellert, Langmuir, 2002, 18, 3669–3675 CrossRef CAS.
- C. D. Erbetta, R. J. Alves, J. M. Resende, R. F. de Souza Freitas and R. G. De Sousa, J. Biomater. Nanobiotechnol., 2012, 3, 208–225 CrossRef CAS.
- M. Gaumet, A. Vargas, R. Gurny and F. Delie, Eur. J. Pharm. Biopharm., 2008, 69, 1–9 CrossRef CAS PubMed.
- V. Torchilin, Adv. Drug Delivery Rev., 2011, 63, 131–135 CrossRef CAS PubMed.
- Y. Zhong, W. Yang, H. Sun, R. Cheng, F. Meng, C. Deng and Z. Zhong, Biomacromolecules, 2013, 14, 3723–3730 CrossRef CAS PubMed.
- C. A. O'Brian, N. E. Ward and V. G. Vogel, Cancer Lett., 1990, 49, 9–12 CrossRef.
- M. E. LLeonart, A. Artero Castro and H. Kondoh, Mol. Cancer, 2009, 8, 1–10 CrossRef PubMed.
- A. Maiti, Chemotherapy, 2012, 1, e119 Search PubMed.
- Y. Zhang, R. Wei, X. Zhu, L. Cai, W. Jin and H. Hu, Anti-Cancer Drugs, 2012, 23, 212–219 CrossRef CAS PubMed.
- H. K. Koul, M. Pal and S. Koul, Genes Cancer, 2013, 4, 342–359 CrossRef PubMed.
- L. Brannon Peppas and J. O. Blanchette, Adv. Drug Delivery Rev., 2012, 64, 206–212 CrossRef PubMed.
- J. Yan, J. Liao, J. Lin and X. He, Tumor Biol., 2015, 36, 55–67 CrossRef CAS PubMed.
- T. T. Hansel, H. Kropshofer, T. Singer, J. A. Mitchell and A. J. George, Nat. Rev. Drug Discovery, 2010, 9, 325–338 CrossRef CAS PubMed.
- P. Hilgard, T. Schreiter, R. J. Stockert, G. Gerken and U. Treichel, Hepatology, 2004, 39, 1398–1407 CrossRef CAS PubMed.
- C. Su, G. Chen and J. Lin, Int. J. Mol. Med., 2008, 22, 613–618 CAS.
Footnotes |
| † Electronic supplementary information (ESI) available. See DOI: 10.1039/c5bm00224a |
| ‡ These authors contributed equally to the work. |
| This journal is © The Royal Society of Chemistry 2016 |


